The electron depolarization during dynamic nuclear polarization: measurements and simulations†
Y.
Hovav
,
I.
Kaminker
,
D.
Shimon
,
A.
Feintuch
,
D.
Goldfarb
and
S.
Vega
*
Weizmann Institute of Science, Rehovot, Israel. E-mail: shimon.vega@weizmann.ac.il
First published on 11th November 2014
Abstract
Dynamic nuclear polarization is typically explained either using microscopic systems, such as in the solid effect and cross effect mechanisms, or using the macroscopic formalism of spin temperature which assumes that the state of the electrons can be described using temperature coefficients, giving rise to the thermal mixing mechanism. The distinction between these mechanisms is typically made by measuring the DNP spectrum – i.e. the nuclear enhancement profile as a function of irradiation frequency. In particular, we have previously used the solid effect and cross effect mechanisms to explain temperature dependent DNP spectra. Our past analysis has however neglected the effect of depolarization of the electrons resulting from the microwave (MW) irradiation. In this work we concentrate on this electron depolarization process and perform electron–electron double resonance (ELDOR) experiments on TEMPOL and trityl frozen solutions, using a 3.34 Tesla magnet and at 2.7–30 K, in order to measure the state of the electron polarization during DNP. The experiments indicate that a significant part of the EPR line is affected by the irradiation due to spectral diffusion. Using a theoretical framework based on rate equations for the polarizations of the different electron spin packets and for those of the nuclei we simulated the various ELDOR line-shapes and reproduced the MW frequency and irradiation time dependence. The obtained electron polarization distribution cannot be described using temperature coefficients as required by the classical thermal mixing mechanism, and therefore the DNP mechanism cannot be described by thermal mixing. Instead, the theoretical framework presented here for the analysis of the ELDOR data forms a basis for future interpretation of DNP spectra in combination with EPR measurements.
1 Introduction
The inherently low signal to noise ratio detected in NMR can be dramatically increased by the use of dynamic nuclear polarization (DNP). In this technique the large polarization of unpaired electrons, mainly of stable radicals, is transferred to their neighboring nuclei, typically using continuous wave (cw) microwave (MW) irradiation. This technique has been known for more than 60 years,1–3 but it has only recently become of high interest to the NMR and MRI community due to the introduction of new technological and methodological developments. These enabled DNP in the solid state to be combined with magic angle spinning (MAS) NMR,4–10 or with the dissolution DNP methodology,11 which can be combined with high resolution liquid state NMR and MRI.The fundamental mechanism of DNP is of interest both from the point of view of the basic spin physics, which differs from most pulsed magnetic resonance experiments due to its non-coherent nature, and from a practical point of view – allowing better understanding of the processes that can lead to higher NMR and MRI signals. Three main mechanisms were used over the years to explain DNP in non-conducting solid samples: the solid effect (SE),3 the cross effect (CE)12–16 and the thermal mixing (TM)17–19 mechanisms. The SE and CE mechanisms were originally explained based on rate equations for the electron and nuclear polarizations, derived from the microscopic quantum mechanical (QM) description of small spin systems, and taking into account the effects of irradiation using a perturbation approach20 and the effects of relaxation. This QM description was recently extensively studied for DNP on static21–27 and rotating28–30 samples. Alternatively, the electron and nuclear polarizations can be considered using the macroscopic concept of spin temperature,20,31–33 as used in the TM and SE17,34,35 mechanisms in systems with EPR lines broader or narrower than the nuclear Larmor frequency, respectively. In this case, the state of the spin system is described using several temperature baths, each associated with a part of the system's Hamiltonian and characterized by its own spin temperature. In particular, the electron polarization in inhomogeneously broadened EPR lines is described using an electron Zeeman temperature and an electron non-Zeeman temperature, with the latter corresponding to the change in the electron polarization across the EPR line.
The DNP mechanism is typically studied based on measurements of the nuclear enhancement as a function of the MW frequency, termed the DNP spectrum. For radicals with an EPR line-width larger than the nuclear Larmor frequency these are interpreted either using the TM mechanism18,35–44 or a combination of the SE and CE mechanisms.45–47 There are only a few cases where the existence of spin temperature was directly detected experimentally.48–50 In addition, the DNP results were only rarely analyzed together with EPR data.49,51 In particular, while the SE and CE based analysis of the DNP line-shapes results in good fitting of the experimental line shapes, this model did not take into account the non-thermal distribution of the electron polarization within the EPR line-shape during DNP. This can influence the resulting DNP enhancement when different from its thermal value.21 As such, much insight into the DNP mechanism can be gained by first measuring the electron polarization distribution during MW irradiation (sometimes called the electron saturation profile).51–55 The latter can be explored using electron–electron double resonance56 (ELDOR) experiments, where the change in the EPR signal intensity due to a MW irradiation at different frequencies is observed. Such an experiment was performed by Granwehr and Köckenberger52 on DNP samples containing TEMPOL and trityl radicals, using longitudinally detected EPR at 1.5 K and 3.34 Tesla.
The electron polarization distribution is expected to change from its thermal value due to the MW irradiation on the electronic transitions, and because of the spread of polarization across the EPR line due to the electron spectral diffusion (eSD) process. The latter is used in the context of the TM mechanism to explain the formation of the electron non-Zeeman temperature, when its rate is faster than the electron spin lattice relaxation rate.18,19,50,57 In addition, it is of much interest in EPR,58–62 mainly in the context of time dependent echo detection, where it is explained based on electron spin flips, which induce stochastic fluctuating dipolar fields at the positions of their neighboring electrons. These electron spin flips are induced by dipolar flip-flop quantum fluctuations, the electron spin lattice relaxation mechanisms, or by hyperfine fluctuations induced by spin diffusion.20,62
In this paper the electron polarization distribution of TEMPOL and trityl containing samples under DNP conditions is monitored at 2.7–30 K, using detailed ELDOR measurements performed on a 3.34 Tesla combined pulsed-EPR and NMR spectrometer.63 The ELDOR line-shapes are analyzed using a theoretical model based on rate equations for the polarizations of the electrons and nuclei in the system, resulting in a good agreement between the simulations and the experimental line-shapes. This model includes a QM based description of the electron polarization loss due to (i) MW irradiation on the single quantum (SQ) electronic transitions, and due to (ii) SE DNP type of polarization transfer to the nuclei induced by irradiation on the electron-nucleus zero quantum (ZQen) and double quantum (DQen) transitions. In addition it includes the effects of (iii) spin–lattice relaxation as well as (iv) a phenomenological description of the spread of the electron polarization due to the eSD process. The influence of the electron polarization redistribution on the DNP mechanism and specifically on the DNP spectral profiles will be described in upcoming publications. Finally, we show that the measured electron polarization distribution cannot be described using the spin temperature coefficients, which forms the basis of the classical TM mechanism.18,35,44,50,64
2 Experimental
2.1 Sample preparation
Samples were prepared using 15 mM trityl (OX63) radical and 40 mM TEMPOL radical, dissolved in 56/44 wt% mixtures of dimethyl sulfoxide (DMSO)/H2O. 25 μl of each solution were placed in a Teflon sample holder for measurement. TEMPOL and DMSO were purchased from Sigma-Aldrich, and the trityl radical from Oxford Instruments.2.2 The NMR/EPR spectrometer
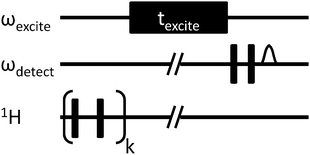
The experiments were conducted in a 3.34 T field using a combined EPR (95 GHz) and NMR (144 MHz) spectrometer,63 under experimental conditions which were previously used to study DNP enhancements and line-shapes of similar samples.45–47,65 This setup is very flexible in terms of the range of possible sample temperatures and of the MW irradiation duration, and in terms of the range of available excitation and detection frequencies. MW excitation and detection were performed using a home-built bridge with two channels, controlled by the Specman4EPR software package.66 The radio frequency (RF) excitation and detection are controlled by an APOLLO spectrometer from Tecmag Inc., externally triggered by a logic pulse generated by Specman4EPR. The probe-head and sample were located inside a Janis Research Inc. liquid helium flow cryostat, and experiments were performed in the temperature range of 2.7–30 K. Reaching 2.7 K required a reduced pressure in the cryostat, which was obtained by pumping. pulse sequence, with
  pulses of 450 ns, produced by the second channel at ωdetect. Prior to each experiment a train of RF pulses was applied on the protons in order to remove their polarization between successive scans. As a result the delay between single experiments could be set to about 5T1e, where T1e is defined below. The MW amplitude, ω1/2π, was 600 kHz, as measured by a nutation experiment. Due to the low Q of our resonator we assume that this value is uniform over the frequency range used in the experiments. For the experiments performed around 2.7 K the power was reduced, ω1/2π = 30 kHz, in order to limit sample heating within a range of 0.5 K.
The detected signals for a given ωexcite and texcite values can be expressed in terms of the electron polarization of the detected electrons prior to the application of the detection pulses, Pe(ωexcite,texcite,ωdetect), using:
| S(ωexcite,texcite,ωdetect) = s(ωdetect)Pe(ωexcite,texcite,ωdetect) + b(ωdetect), | (1) |
| Ee(ωexcite,texcite,ωdetect) = S(ωexcite,texcite,ωdetect)/S0(ωexcite′,texcite,ωdetect). | (2) |
The actual intensity of the EPR spectrum S*(ωdetect;ωexcite,texcite) at the end of a MW irradiation of duration texcite at frequency ωexcite can be calculated by multiplying Edetect(ωdetect;ωexcite,texcite) by the EPR line intensity f(ωdetect) for each ωdetect:
| S*(ωdetect;ωexcite,texcite) = f(ωdetect) × Edetect(ωdetect;ωexcite,texcite). | (3) |
This value is proportional to the total electron polarization around the detected frequency.
2.3 T 1 measurements
The electron and nuclear relaxation times, T1e and T1n, were determined by analyzing the recovery of the echo intensity after signal saturation by a long cw MW pulse (using texcite > T1e) or a RF pulse train, respectively. The NMR recovery curves could be analyzed by single exponential functions with a time constant T1n. The intensity of the EPR echo signals were recorded and fitted using either a single exponential or when required using a double exponential function with the slow (and major) component assigned to T1e. The electron relaxation times were only collected around the frequencies of the maximum EPR line intensity.3 Experimental results
In this section we show the results of ELDOR measurements on samples containing TEMPOL and trityl radicals as a function of texcite, ωexcite, and ωdetect. In particular, Edetect profiles were measured using texcite irradiation times of the order of T1e in order to allow for a possible electron non-Zeeman temperature to form in the system. The spin–lattice relaxation rates of these samples were measured and are summarized in Table 1. For convenience, the values of ωexcite and ωdetect will be given in frequency units relative to a fixed reference frequency, ωc, using δνexcite = (ωexcite − ωc)/2π and δνdetect = (ωdetect − ωc)/2π. The value of ωc/2π was set to 95 GHz in the TEMPOL case and to 94.86 GHz in the trityl case, such that ωc is about equal to the center frequency of the EPR line.| Radical | TEMPOL | Trityl | |||
|---|---|---|---|---|---|
| Temperature | 20 K | 7 K | 2.7 K | 30 K | 2.7 K |
| T 1e (ms) | 5.5 | 50 | 240 | 32 | 270 |
| T 1n (s) | 13 | 30 | 220 | 14 | 250 |
| t excite (ms) | 20 | 100 | 1000 | 100 | 1000 |
3.1 TEMPOL sample
The ELDOR measurements on a 40 mM TEMPOL solid solution were performed at 20 K, 7 K, and 2.7 K. Here the baseline distortions b(δνdetect) were significant with respect to the detected echo intensities, causing the detected echo signals to be different from zero even at full saturation conditions, resulting in a distortion of the Ee values calculated using eqn (2). Fig. 2a shows a contour of Ee(δνexcite,texcite,δνdetect) obtained from ELDOR signals for different δνdetect and δνexcite frequencies at 20 K, using texcite = 10 ms. Individual Eexcite and Edetect profiles are plotted in Fig. 2b and c, respectively. The latter have a lower spectral resolution and are therefore more susceptible to noise. In addition they are affected by changes in the experimental b(δνdetect) values. The Eexcite profiles show a sharp minimum at δνexcite = δνdetect, and a broad minimum around δνexcite = 0. The first minimum is a result of on-resonance MW saturation and the second minimum is attributed to the eSD mechanism. These broad minima appear in the Edetect profiles as an increase of their slopes around δνexcite = δνdetect when δνexcite is moving away from the center of the EPR line. In other words, irradiating at the center affects most of the electron packets composing the EPR line, while irradiation at the side affects only neighboring packets. In addition to these minima, some depolarization is observed for irradiation outside of the EPR line (see for example arrows in Fig. 2b). This is attributed to the polarization loss to the 1H nuclei in the sample due to irradiation on DQen or ZQen transitions. The result of MW irradiation on the expected EPR line intensity S*(ωdetect;ωexcite,texcite), defined in eqn (3), is plotted in Fig. 2d. As can be seen, irradiation close to the center of the EPR line results in a large reduction of the total electron polarization, whereas irradiation at the side of the spectrum has a relative small effect on it.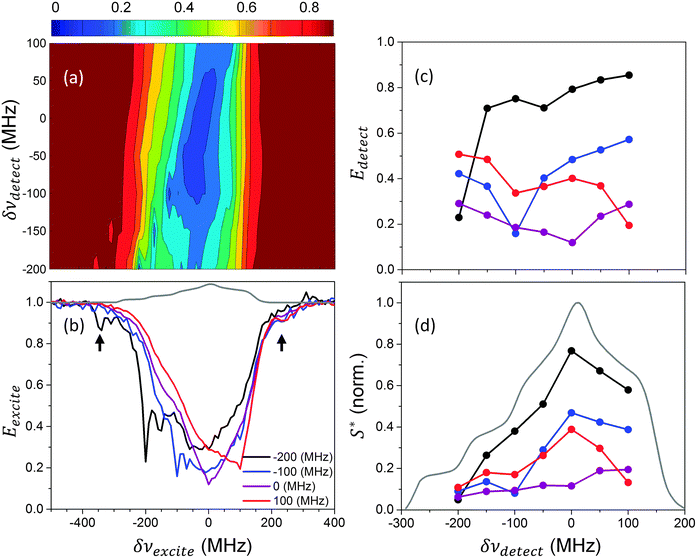 | ||
| Fig. 2 Normalized electron polarization Ee(δνexcite,texcite,δνdetect) measured for the 40 mM TEMPOL sample at 20 K, using texcite = 10 ms. In (b) and (c) several Eexcite and Edetect spectra are plotted, as taken from the full Ee contour shown in (a). This was done for several δνdetect and δνexcite values, respectively, with the values given by the color-code in (b). In (d) the expected signal intensity S* is plotted using the values obtained from (c), as given in eqn (3). The EPR line, taken from ref. 45, is plotted in gray in (b) and (d). The black arrows in (b) indicate depolarizations due to irradiation outside the EPR spectrum. All frequencies are given with respect to 95 GHz. | ||
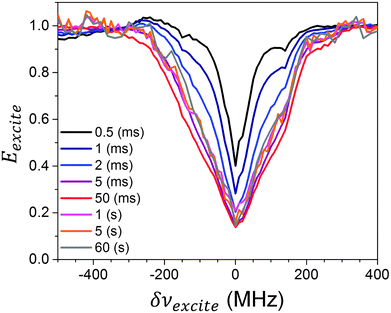
In Fig. 3Eexcite spectra obtained for different texcite values using δνdetect = 0 are plotted. For short irradiation times the MW irradiation results in a relatively narrow hole which is burned in the Eexcite spectrum around δνexcite = δνdetect, due to MW irradiation on the SQ transitions. In addition to this some depolarization can be observed when irradiating around δνexcite = δνdetect ± 144 MHz, corresponding to polarization loss to the 1H nuclei when irradiating on DQen and ZQen transitions of the detected electrons. For increasing texcite values the widths of the profile increases and after 50 ms it decreases again to some extent. A steady state profile is reached in a time scale of about 1 s, which is much longer than T1e, indicating that this narrowing effect involves polarization transfer to the 1H or 14N nuclei in the sample.53 This process is shorter than the nuclear polarization buildup time of the order of 13 s. The ELDOR results obtained at long texcite times were recorded using a single scan, and therefore show a reduced signal to noise ratio (SNR).
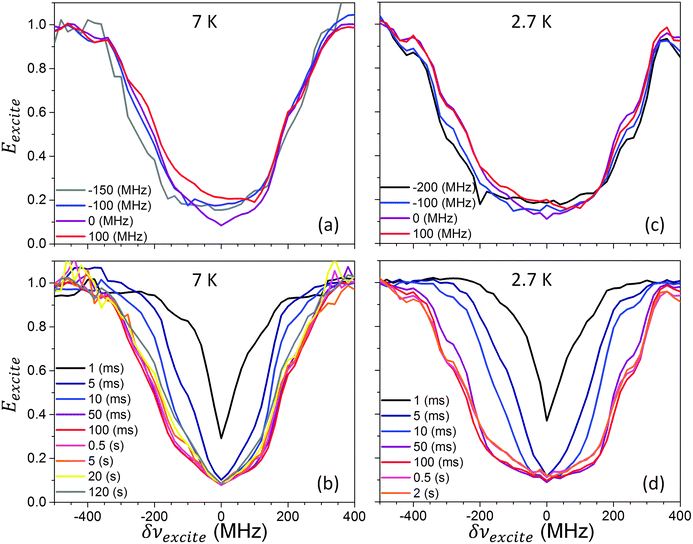
In Fig. 4Eexcite spectra measured at 7 K (a, b) and 2.7 K (c, d) are plotted (a, c) for several δνdetect frequencies, with texcite = 0.1 s at 7 K and 0.5 s at 2.7 K; and (b, d) for several texcite values and δνdetect = 0. Once again, at 2.7 K the MW power was reduced and was set to about ω1/2π = 30 kHz. As can be clearly observed, the width of the enhancement profiles broadens with the decrease in temperature, with the effect of the eSD process becoming strong enough to almost saturate the whole EPR line for MW fields applied at any δνexcite frequency inside the EPR line. As before, the saturation profiles reach their maximal width in a timescale comparable to T1e, after which they show a slight narrowing.
3.2 Trityl sample
The ELDOR measurements on a 15 mM trityl solid solution were performed at 30 K and 2.7 K. The detected echoes were much higher than the baseline artifacts b(νdetect), thus the latter could be neglected. In Fig. 5a the results of the ELDOR experiments at 30 K are summarized by plotting the contour Ee(δνexcite,texcite,δνdetect) for texcite = 0.1 s. The ELDOR results can be divided into three δνexcite frequency regions: the SQ center region, where the MW irradiation frequencies cover the frequency span of the EPR line, result in a direct saturation of the electrons; and the DQen and ZQen frequency regions, which are removed by 144 MHz from the center region, where irradiation on the electron – 1H DQen and ZQen transitions results in electron polarization loss due to SE type of polarization transfer to the surrounding nuclei.53 In addition to this, the polarization loss can spread through the EPR line due to eSD. Polarization loss in the SQ region can also occur due to irradiation on the electron – 13C DQen and ZQen transitions, influenced by the hyperfine interaction of the electrons with the natural abundance 13C nuclei of the trityl radicals themselves.67 This will only be considered in the ESI.†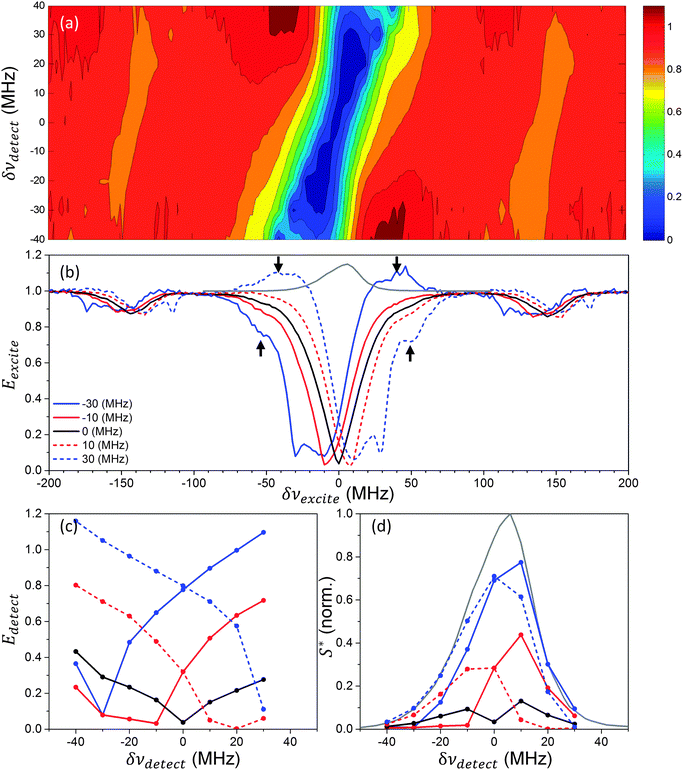 | ||
| Fig. 5 Normalized electron polarization Ee(δνexcite,texcite,δνdetect) measured for the 15 mM trityl sample at 30 K, using texcite = 100 ms. In (b) and (c) several Eexcite and Edetect spectra are plotted, as taken from the full Ee contour shown in (a). This was done for several δνdetect and δνexcite values, respectively, with the values given by the color-code in (b). In (d) the expected signal intensity S* is plotted using the values obtained from (c), as given in eqn (3). The EPR line, taken from ref. 46, is plotted in gray in (b) and (d). The arrows in (b) show the position of the electron hyper- and de-polarization features, which are not taken into account in the simulations, as explained in the text. All frequencies are given with respect to 94.86 GHz. | ||
We first examine several Eexcite profiles, as plotted in Fig. 5b. Starting from MW irradiation in the SQ region, clear minima are observed when δνexcite ≅ δνdetect and in addition broader minima appear at δνexcite values between δνdetect and zero. Small depolarization and hyperpolarization (Edetect > 1) effects are also observed when detecting around the edges of the EPR spectrum, as indicated by the black arrows in the figure. The obtained profiles are about antisymmetric with respect to δνdetect = 0, reflecting the low anisotropy of the EPR line. A similar behavior as in the SQ region can be seen when inspecting the smaller depolarization at the DQen and ZQen regions. The extra depolarization and hyperpolarization features are not observed here, possibly due to low SNR.
Several Edetect profiles are plotted in Fig. 5c, with δνexcite located inside the SQ region. Single minima are found at δνexcite ≅ δνdetect, and the shapes of these profiles around these minima have larger slopes towards the center EPR frequency than toward the edges of the EPR spectrum. In addition, the inward slopes increase when the |δνexcite| frequencies move away from zero. Once again, electron hyper-polarizations are observed for high |δνdetect| and |δνexcite| values, and the results show an inverse symmetry with respect to δνexcite = 0.
The expected EPR signal intensity S*(ωdetect;ωexcite,texcite) as a function of δνdetect for different δνexcite values are plotted in Fig. 5d. In this non-normalized representations the electron hyperpolarization is hardly recognized. Thus, at this stage we ignore these small features, and discuss possible mechanisms leading to these effects in the ESI.†
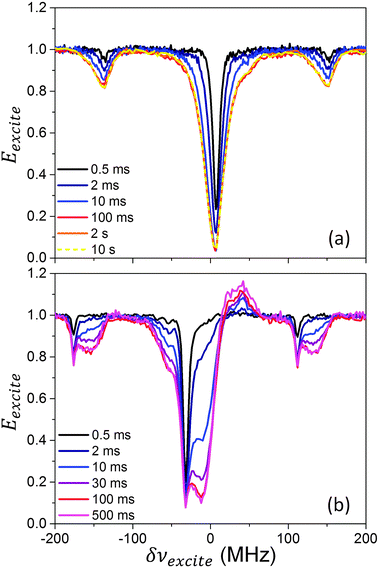
In Fig. 6Eexcite profiles are plotted for several texcite values, with δνdetect equal to (a) 10 MHz or to (b) −30 MHz. In both cases the irradiation initially burns a narrow hole in the EPR line due to irradiation on the electron SQ transitions or the electron – 1H DQen and ZQen transitions, which broadens with time. The steady state polarization distribution is reached in the timescale of the order of T1e.
In Fig. 7a the experimental Ee(δνexcite,texcite,δνdetect) values obtained at 2.7 K are shown, with texcite = 1 s. Once again, here the MW intensity was much lower (30 kHz) than during the measurement at 30 K. The Eexcite profiles (Fig. 7b) again show a minimum at δνexcite = δνdetect and an additional broad minimum closer to δνexcite = 0. Some hyperpolarization can be seen when νdetect is close to zero, as indicated by the arrows in the figure, which goes together with a narrowing of the profile. The minima in the ZQ and DQ regions are all at about the same frequency, with increasing electron depolarization for larger |δνdetect| values.
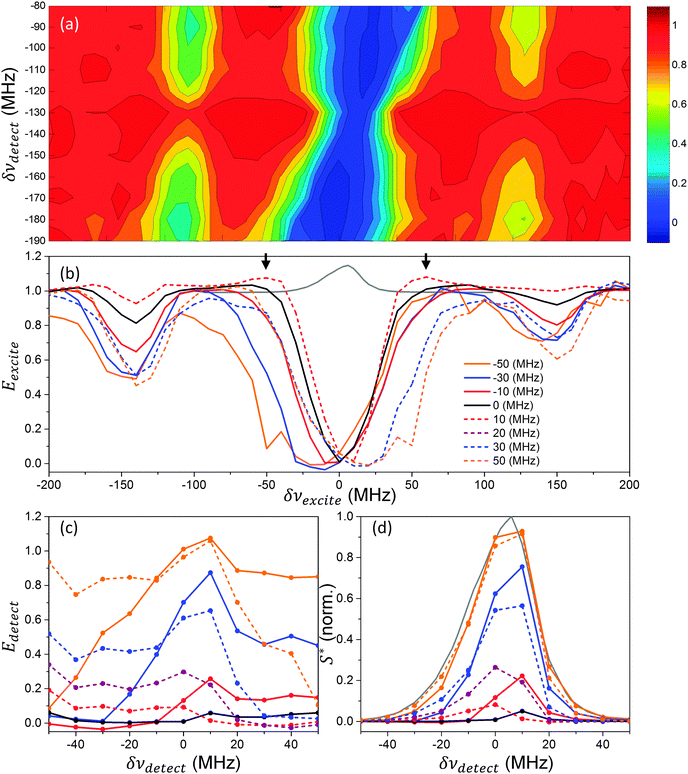 | ||
| Fig. 7 Normalized electron polarization Ee(δνexcite,texcite,δνdetect) measured for the 15 mM trityl sample at 2.7 K, using texcite = 1 s. In (b) and (c) several Eexcite and Edetect spectra are plotted, as taken from the full Ee contour shown in (a). This was done for several δνdetect and δνexcite values, respectively, with the values given by the color-code in (b). In (d) the expected signal intensity S* is plotted using the values obtained from (c), as given in eqn (3). The EPR line, taken from ref. 46, is plotted in gray in (b) and (d). The arrows in (b) show the position of the electron hyperpolarization. All frequencies are given with respect to 94.86 GHz. | ||
The Edetect profiles, plotted in Fig. 7c, again show global minima around δνdetect = δνexcite; however here there is also a local maximum around δνdetect = 0, with lower electron polarization around it. This may indicate that electron packets which are removed in frequency are connected to one another by both eSD and another mechanism. Possible explanations for this are proposed in the ESI.† The virtual symmetry axis of these profiles is slightly shifted with respect to the 30 K profiles, and is at about δνexcite = 5 MHz. The real magnitudes of these effects are relatively small when considering the actual signal, as seen in Fig. 7d.
4 Spin temperature and the experimental results
As mentioned in the Introduction, one of the fundamental assumptions of the TM mechanism is that the distribution of the electron polarizations can be described using a Zeeman temperature, TeZ, associated with the weight averaged center electron frequency ωe,0, and an additional electron non-Zeeman spin temperature, TenZ, for the parts of the Hamiltonian which contribute to the inhomogeneous EPR line shape, namely the hyperfine with strongly coupled nuclei and the g-anisotropy.18,19,35,38,44,50,57,64 The direct contribution of the dipolar interaction to TenZ is assumed to be negligible. However, it plays an important indirect role as the source of the eSD process, which enables the creation of the TneZ temperature in the system when its rate is higher than T1e−1.18,19,50,57 Under these assumptions, for a long enough MW irradiation the polarization of the electrons Pe(ωj) at a frequency ωj = ωe,0 + δωe,j can be described in the ωexcite MW rotating frame as: | (4) |
We can next compare this prediction to the experimentally detected Edetect profiles. These profiles, obtained for the TEMPOL sample at 20 K and for the trityl sample at 30 K and 2.7 K as shown in Fig. 2c, 5c and 7c, respectively, do not follow the expected monotonic change in Pe(ωj). Instead they show a clear minimum around ωdetect = ωexcite and an increase of the polarizations on both sides of these conditions. In particular, the results shown in Fig. 2d, 5d and 7d can be compared with the measurements shown in ref. 48–50, where spin temperature was observed. The Eexcite contours detected at 7 K and 2.7 K and plotted in Fig. 4a and c show only very little dependence on δνdetect, which could perhaps justify the introduction of very large TenZ values. Yet in the ESI† we show that at 7 K such a TenZ does not exist. At 2.7 K further measurements are needed to verify the existence of TenZ. Inspection of the ELDOR results obtained by Granwehr and Köckenberger52 at 1.5 K leads to the same conclusion, namely that the system cannot be described by using TeZ and TenZ temperatures for describing the Edetect profiles.
5 Theoretical analysis of the ELDOR spectra
In this section we present a model for the time evolution and frequency dependence of the electron polarization that accounts for the major parts of the experimental ELDOR results. It takes into account the effects of the spin–lattice relaxation, MW irradiation (including off-resonance effects), and eSD. In addition, the influence of the nuclei on the electrons, as was seen in the experiment, is taken into account by relying on the QM descriptions of the SE DNP processes in small spin systems.21 A justification for relying on the spin dynamics of small model spin systems to capture the physics of large and complex spin systems can be found in ref. 45–47. Although the CE mechanism can have a large influence on the nuclear polarization45–47 we did not take it into account in this model. This can be justified by the fact that during ELDOR measurements the electron polarizations do not show significant changes in timescale of the DNP enhancement buildups, and since only a small fraction of the electrons satisfy the CE condition.25,26 The model presented here does not rely on spin thermodynamics related parameters, such as spin temperature, energy conservation, and heat capacities of spin baths.5.1 Theoretical model
The model presented here describes the temporal evolution of the electron and nuclear polarizations in our systems. The electron spins in these systems are assumed to have an inhomogeneous broadened spectrum due to the anisotropy of the g-tensor. As such, in the present discussion we ignore for simplicity the fact that some of the EPR features can originate from hyperfine interactions, as in the TEMPOL case. As in previous theoretical models16,18,44,51,64,68–70 we divide the electrons into a set of electron packets with constant average resonance frequencies, ωj, and define an average electron polarization for each packet, Pe,j. The relative weights of the packets, fj, are determined by normalization of the integral of the EPR line, ∑fj = 1. As such, the detected EPR signal at a frequency ωj is proportional to NefjPe,j, where Ne is the number of unpaired electrons in the system. To add the effect of the nuclei on the electrons we distinguish between two nuclear types:47 (i) the “local” nuclei, with average polarizations Pn,j, which are directly or indirectly dipolar coupled to the electrons at ωj, and which get polarized due to irradiation on the DQen and ZQen transitions; and (ii) the remote “bulk” nuclei, with an average polarization of Pbulk, which get polarized due to spin diffusion with the local nuclei. The latter determine the signals during DNP experiments.The general form of the set of homogeneous rate equations for the electron and nuclear polarizations, for a system with N frequency bins (j = 1,…,N) can be represented as:
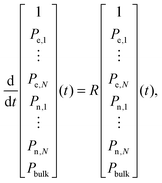 | (5) |
The rate matrix R in these coupled equations contains the actions of the electron (R1e) and nuclear (R1n) spin–lattice relaxation, the MW irradiation (RMW), the nuclear spin diffusion (RnSD), and the eSD (ReSD) processes:
| R = (R1e + R1n + RMW + RnSD + ReSD). | (6) |
The resulting polarizations can then be calculated by solving these equations for a given MW irradiation frequency ωexcite and time, texcite,
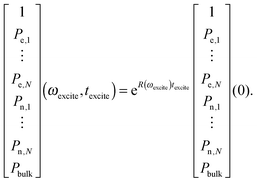 | (7) |
The explicit form of this set of equations is derived in what follows by summing up rate equations affecting one or two of these populations, derived from the rate equations for the populations in small systems, as described in ref. 21 and 22. To transfer such rate equations on the pα and pβ populations of a single spin ½ to its corresponding polarization, P = pβ − pα, we use the transformation:
 | (8) |
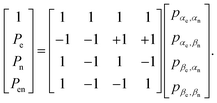 | (9) |
Here we have neglected the effect of the small state mixing that is present in a electron–nuclear system due to the non-secular hyperfine interaction. This effect is compensated by the introduction of the effective DQen and ZQen irradiation derived from the MW irradiation in the case of the SE. The transformation results in two time independent polarization components 1 and Pen and the latter can therefore be neglected. This approach is obviously a simplified version of the calculations of the quantum dynamics in a many-spin system.21,23,25,26,71
 in the
  subspace,72,73 where P0e,j = tanh(ωe,jℏ/2kBTL) are the thermal equilibrium polarizations of the electrons, and TL is the lattice temperature. In analogy, the nuclear spin–lattice rate matrix of the nuclei is defined as R1,n = ∑R1n,j + R1bulk, where R1n,j are the non-zero elements given by
  in the
  subspace, and the bulk relaxation rate matrix R1bulk has the form
  in the
  subspace. The equilibrium polarization of the nuclei equals P0n = tanh(ωnℏ/2kBTL), where ωn is the nuclear Larmor frequency, and for simplicity we assume that the nuclei have the same sign of the gyromagnetic ratio as for 1H nuclei.
In the present model we do not explicitly consider electron–nuclear cross-relaxation processes. We realize, however, that during calculations the effects of cross-relaxation processes can in many instances be mimicked by combining electron and nuclear relaxation processes.21
| RMW = ∑RjSQ + ∑RjDQ + ∑RjZQ. | (10) |
The RjSQ matrices have a single diagonal element operating on Pe,j with a value
 | (11) |
The MW irradiation on the DQen or ZQen transitions of an electron coupled to neighboring nuclei becomes allowed due to the state mixing induced by the pseudo-secular parts of their hyperfine interactions. This irradiation results in a SE process polarizing the nuclei and is represented by the matrix elements of RjZQ/DQ. This DQen or ZQen irradiation results in an equilibration of the polarizations of the electron and the nuclei.21 If on average an electron in bin j transfers its polarization to η local nuclei, and assuming the polarizations of these nuclei become all equal due to fast spin diffusion rates or dipolar state mixing, the MW irradiation will result in the ideal case in a steady state polarization of the electron given by Pe,j = ±Pn,j = P0e,j/(η + 1). To accomplish this, the sub-matrices RjDQ and RjZQ in the subspace  have the general form
  and
and  , respectively. The actual steady state polarization of the electrons and nuclei during the MW irradiation will be influenced not only by the action of these DQ and ZQ effective irradiation, but also by the relaxation times of the system.21 The values of the wDQ/ZQj rates can be estimated using perturbation theory on the Bloch equations21,22 as
 | (12) |
Although here the bulk nuclei are polarized via the local nuclei (i.e. their hyperfine interaction value is taken to be zero), it is possible to conduct the simulations by considering both of these nuclei together. This is justified for fast spin diffusion rates. In such a case only the bulk polarization should be taken into account in eqn (5), and RDQ/ZQ in eqn (10) should be substituted by RbulkDQ/ZQ = ∑Rj,bulkDQ/ZQ with rate matrices Rj,bulkDQ/ZQ with elements  and
and  in the subspace
  . The expressions for wDQ/ZQj,bulk are the same as in eqn (12) by replacing Ā± by an effective bulk hyperfine coefficient Ā±bulk. The ηbj parameter must be adjusted to the average number of polarized bulk nuclei per electron, which can be defined by ηbj = Cn/fe,jCe, where Ce and Cn are the concentrations of the electrons and nuclei, respectively, and fe,jCe is the concentration of the electrons with a frequency ωj. Once again, here we will consider the bulk nuclei to be polarized via spin diffusion by the local nuclei, as explained in what follows.
 in the
  subspace,47,74 where wnSD is the effective nuclear spin diffusion rate between neighboring nuclei and ηbj/η is the ratio between the number of bulk and local nuclei.
 . And (iii), the eSD process conserves the total polarization of the electron spin system,
  . As a result our eSD model is not energy conserving, as is required in the spectral diffusion process considered in the theory leading to the TM mechanism.75 Based on these assumptions, the polarization exchange process described by the ReSD matrix can be expressed as a sum of
  rate matrices,
  , which have non-zero elements of the form
 | (13) |
 subspace. For the
  polarization exchange rate, and in particular its dependence on the frequency difference between the bins, we choose the from:
 | (14) |
In order to characterize the effect of the ReSD rate matrix we can define a characteristic polarization exchange rate constant by considering the exchange rate between the polarizations of the electrons in neighboring bins jmax and jmax−1 with the largest fj values, fmax and fmax−1:
 | (15) |
5.2 Simulations of the experimental data
In order to compare the simulations with the experimental results, the electron polarizations were calculated using eqn (7), with the initial values of the polarization set to their thermal values for the electrons and set to zero for the nuclei, where the latter mimics the effect of ideal saturation of the nuclei. The simulated saturation values of the different electrons can then be obtained using| Ee(ωexcite,texcite,ωj) = Pe,j(ωexcite,texcite)/Pe,j(0), | (16) |
| S*(ωj;ωexcite,texcite) = fj·Edetect(ωj;ωexcite,texcite), | (17) |
The parameters entering the total rate matrix can be divided into two groups: those that are experimentally determined – i.e. the T1e and T1n,bulk relaxation times, the values of fj, the MW irradiation strength ω1 and the concentrations of the electrons and bulk nuclei, Ce and Cn; and those that we cannot determine experimentally – i.e. the T2e relaxation time (which is longer than the phase memory time of the system), the Ā± value, the wnSD rate and the ΛeSD coefficient, the T1n,j relaxation time of the local nuclei, and their concentration ηCe. In addition, we must choose the width of the frequency bins, ωj − ωj−1. These parameters depend on one another, and in particular on the bin size, which changes the frequency range on which the averaging is performed. As there are many unknown parameters the fit to the data was done manually and the parameter set chosen is not necessarily the only possibility to fit the data. The significance of the parameter values used in our simulations, as summarized in Table 2, is then in their consistency for different experimental conditions, rather than in their absolute value. In order to simplify the problem, a single T1e,j time was used for all j and was set equal to the experimental T1e value, the T2e value used was not changed with temperature, and ω1 was assumed to be frequency independent. A bin width of (ωj − ωj−1)/2π = 2 MHz was used due to computation limitations when considering the TEMPOL sample, and was kept the same in the case of the trityl sample for comparison, although in the latter a smaller value could be used.
The fitting of the experimental data was performed based on the Eexcite profiles in two steps. At first only the electron system was considered, by removing the RDQ/ZQ irradiation matrices (eqn (10)) and by varying ωexcite only in the frequency range of the EPR line. The shape of the simulated ELDOR spectrum then depends on the T2e and ΛeSD fitting parameters, with the former influencing the MW saturation efficiency as given in eqn (11). For the TEMPOL sample, where the MW irradiation can directly saturate only a small fraction of the EPR line and the spectral diffusion was dominant for the given experimental conditions, T2e had a relatively small effect on the ELDOR profile. The measured ELDOR spectra were then fitted by varying ΛeSD and using T2e = 10 μs, which is a reasonable guess. A ten-fold increase in T2e had a negligible effect and a small effect could be seen for a twofold change of the bin width. In the trityl sample the direct MW excitation can have a large influence on the entire EPR line, and a value of T2e = 100 μs had to be used to reduce this effect and allow for the experimental ELDOR profiles to be fitted. ΛeSD was then determined for this particular choice of T2e and bin width.
In the second step the RDQ/ZQ rates were reintroduced. In the trityl case, where the EPR line is much narrower than the 1H Larmor frequency, this step only affects the ELDOR results for irradiation outside of the EPR line, and therefore has no effect on the results of the first step within physical limits. In the TEMPOL case the MW irradiation can excite SQ, DQ and ZQ transitions simultaneously. However, for the parameters used in the first step, the RDQ/ZQ rates had little influence on the ELDOR profiles for ωexcite within the EPR line. This may not be the case when the influence of the spectral diffusion is reduced. Therefore, in both cases the main influence of these rates was for the case of irradiation outside of the EPR line. The ELDOR spectrum in this region was then influenced by Ā±, η, wnSD, and the T1n parameters, as well as by the T2e and ΛeSD parameters. The latter two were chosen based on the values used in the first step. The ELDOR profiles were hardly influenced by the loss of polarization to the local nuclei and was strongly influenced by the polarization transfer to the bulk nuclei. As such T1n,j were chosen to be equal to the experimentally measured T1,bulk. The value of wnSD was chosen to be of the order of the nuclear dipolar interaction, 1000 s−1, resulting in a strong coupling between the local and bulk nuclei. The polarization transfer between the electrons to the bulk nuclei then depended on Ā± and η parameters, with a faster polarization transfer for larger values of the two. Here the experimental ELDOR spectra were fitted by varying Ā± while using η = 4 as a reasonable guess.
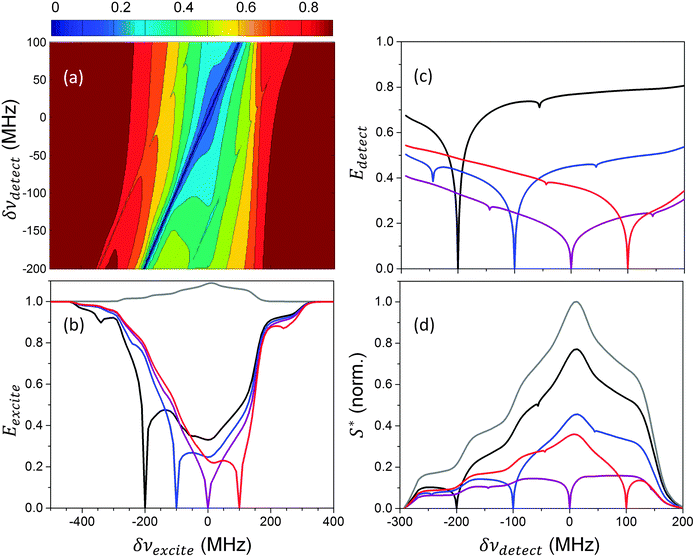 | ||
| Fig. 8 Normalized electron polarization Ee(δνexcite,texcite,δνdetect) simulated for the 40 mM TEMPOL sample at 20 K, using texcite = 10 ms. In (b) and (c) several Eexcite and Edetect spectra are plotted, as taken from the full Ee contour shown in (a). This was done for several δνdetect and δνexcite values, respectively, with the values given by the color-code in (b). In (d) the expected signal intensity S* is plotted using the values obtained from (c), as given in eqn (17). The EPR line, taken from ref. 45, is plotted in gray in (b) and (d). The parameters used in the simulations are given in Table 2. All frequencies are given with respect to 95 GHz. | ||
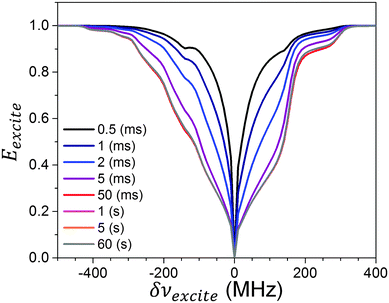 | ||
| Fig. 9 Simulated Eexcite(δνexcite) spectra at different texcite values of the 40 mM TEMPOL sample at 20 K. A detection frequency of δνdetect = 0 was used. The texcite values are defined by the color coding inside the figure, and all frequencies are given with respect to 95 GHz. The parameters used in the simulations are given in Table 2. | ||
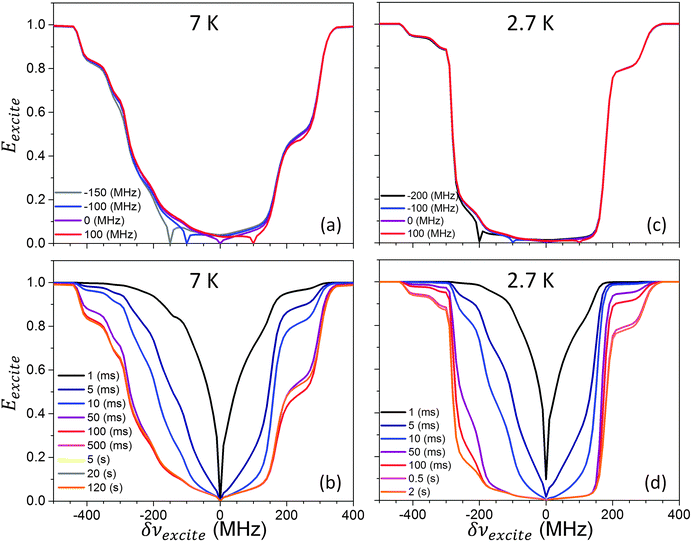 | ||
| Fig. 10 Simulated Eexcite(δνexcite) spectra of the 40 mM TEMPOL sample at 7 K and 2.7 K. In (a) the 7 K profiles obtained using texcite = 100 ms are plotted for different δνdetect values, defined by the color coding inside the figure. In (b) the 7 K Eexcite(δνexcite) profiles obtained using δνdetect = 0 are plotted for increasing texcite values, defined by the color coding inside the figure. In (c) and (d) similar profiles are plotted as in (a) and (b) but for 2.7 K, using ω1/2π = 30 kHz instead of 600 kHz, and using texcite = 500 ms in (c). The parameters used in the simulations are given in Table 2. All frequencies are given with respect to 95 GHz. | ||
Starting with the data obtained at 20 K it can be seen that a good agreement is obtained between the experimental and simulated results (Fig. 2 and 3), with the simulations showing all main features of the Eexcite and Edetect profiles (as well as the corresponding S* profiles). This includes both the effects of direct irradiation on the detected electrons close to δνdetect = δνexcite, the polarization spread due to the eSD mechanism, and the effect of irradiation on the DQen and ZQen transitions. There are however some differences that will be discussed now.
First, the temporal dependence of the experimental Eexcite profiles shows some narrowing of its shape at relatively long times. This is not fully reproduced by the simulations. The source of this effect can be due to an oversimplification of the nuclear saturation process, or due to the presence of the 14N nuclear relaxation that was not taken into account in the rate equations. In addition, the polarizations at δνdetect = δνexcite is lower in the simulation than observed experimentally. This is a result of an overestimation of the SQ MW representation in eqn (11), in particular since a single off resonance value is used for all electrons in each bin. These differences could have been corrected by applying a simple convolution procedure on the simulated profiles, mimicking the action of the detection sequence. This was not done in order to demonstrate the sharp saturation features resulting from this model. An average off resonance value could also have been added to the calculation to reduce these differences, which would also have resulted in an increase of the Ā± value needed in order to fit the experimental results.
The ELDOR data recorded at 7 K and 2.7 K (Fig. 4) are again in good agreement with the simulated results. In particular, it is apparent that the broadening of the Eexcite ELDOR profiles is a consequence of the lengthening of T1e. The simulated spectra reach values that are somewhat lower than the experimental ones, and which could be a result of the finite baseline artifact, b, as described around eqn (2). The influence of the nuclei on the ELDOR data manifests itself in the form of sharp features that are more pronounced in the simulated profiles than in the experimental ones. Possible changes in the EPR line-shape at low temperatures are not investigated and are left for future studies, together with the influence of the instantaneous diffusion and eSD on the spin relaxation measurements. It should be noted that some mismatches between the simulations and the experiments at different temperatures can be reduced when the individual ELDOR spectra are fitted independently. In addition, the influence of the nuclei on the ELDOR data could also have been calculated by considering both the local and bulk nuclei together, as explained in Section 5.1.2.
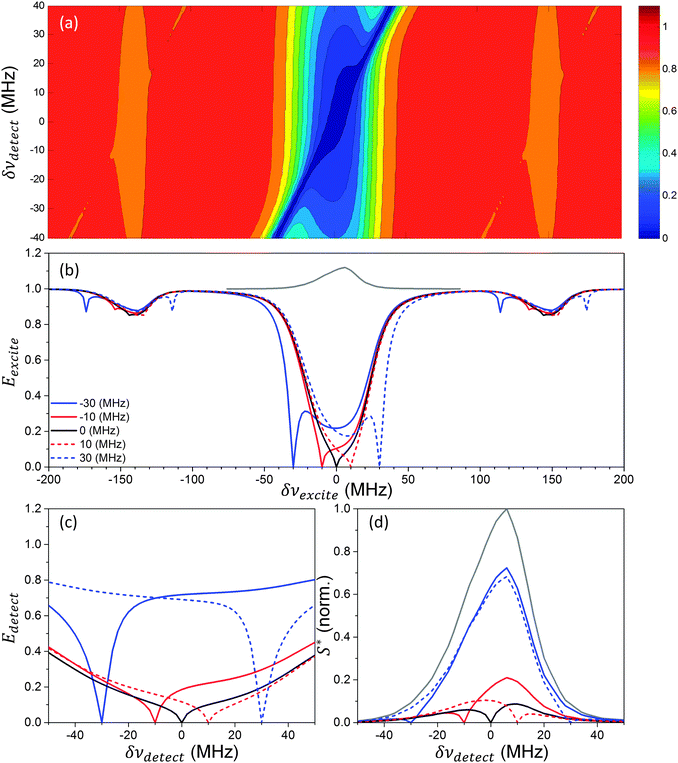 | ||
| Fig. 11 Normalized electron polarization Ee(δνexcite,texcite,δνdetect) simulated on the 15 mM trityl sample at 30 K, using texcite = 100 ms. In (b) and (c) several Eexcite and Edetect spectra are plotted, as taken from the full Ee contour shown in (a). This was done for several δνdetect and δνexcite values, respectively, with the values given by the color-code in (b). In (d) the expected signal intensity S* is plotted using the values obtained from (c), as given in eqn (17). The EPR line, taken from ref. 46, is plotted in gray in (b) and (d). The parameters used in the simulations are given in Table 2. All frequencies are given with respect to 94.86 GHz. | ||
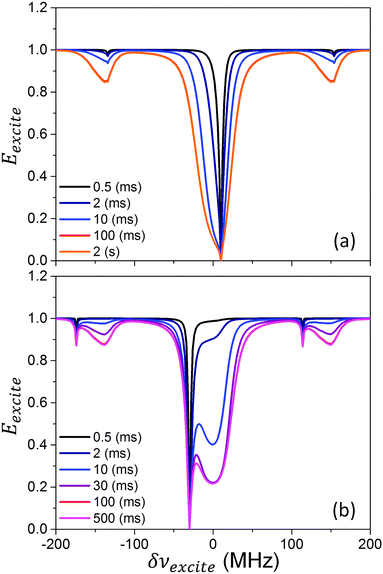 | ||
| Fig. 12 Simulated Eexcite(δνexcite) spectra at different texcite values for the 15 mM trityl sample at 30 K. A detection frequency of δνdetect = 0 was used. The texcite values are defined by the color coding inside the figure, and all frequencies are given with respect to 94.86 GHz. The parameters used in the simulations are given in Table 2. | ||
The shapes of the simulated Eexcite profiles, as plotted in Fig. 11b, show many of the experimental features, but do not capture the change in the position of the broad minimum exactly. As expected, the extra depolarization and hyperpolarization effects are not reproduced, because the source of these effects is not present in our rate equations. The individual simulated Edetect shapes in 11c have the same general features as in the experiment, with a minimum around δνexcite = δνdetect with a larger recovery towards the thermal value for irradiation farther away from δνexcite = 0. However, the experimental Edetect curves obtained for high |δνexcite| values are less symmetrical with respect to δνexcite = δνdetect than the simulated ones. These differences are much less pronounced when comparing the expected EPR signal intensity S*, as shown in Fig. 11d. The simulated time dependence of the Eexcite profiles (Fig. 12), showing the gradual change from a narrow hole in the electron polarization to broad eSD mediated features, are in agreement with the experimental results.
Some specific features appearing in 2.7 K measurements (Fig. 7) cannot be captured using our present model, and we therefore leave their interpretation for a later study. Whether or not their appearance is correlated with the unique extra features observed at 30 K must still be studied. Possible sources for these observations are large dipolar or hyperfine interactions, which cause large splittings in the SQ spectra of electrons such that only one transition is detected.79 This is illustrated in the ESI,† based on QM calculations performed on small model spin systems.
6 Discussion
In this study we have focused on the electron depolarization during static ELDOR experiments in the solid state. From the ELDOR data it immediately follows that for both the trityl sample, at 30 K and 2.7 K, and the TEMPOL sample, at 20, 7, and 2.7 K, the electron polarization is highly affected by the electron spectral diffusion (eSD) process. The ELDOR results were used to monitor the polarization of the electrons during MW irradiation at a fixed frequency, offering a way to infer whether a spin temperature was created in the electron non-Zeeman manifold, in analogy to the cw EPR detected results shown in ref. 48–50. Although an energy conserving eSD mechanism was postulated to lead to the creation of such a temperature, our measurements on the TEMPOL sample at 20 K (and the 7 K results to a lesser extent) and the trityl containing sample at 30 and 2.7 K, show clearly that the distribution of the electron polarization cannot be described using the two spin temperatures coefficients appearing in eqn (4). We conclude that the TM mechanism, as described by the Provotorov based high temperature rate equations or the low temperature Borghini based model,18,35,44,50,64 cannot be used to analyze DNP data under the conditions used here. However, these results do not show whether a common dipolar temperature50 exists in our samples, and does not directly contradict the assumptions of the bin-based TM models presented in ref. 51 and 68–70.The experimental results presented here differ from those of Granwehr and Köckenberger,52 where the double minimum in the ELDOR spectra was not observed. This may be due to the difference in samples, measurement conditions, or detection schemes and has to be addressed elsewhere. However, in both cases the eSD has a large influence on the electron polarization. Analyzing their results in the same manner as in Section 4 does again not show the formation of the above mentioned spin temperatures.
The theoretical model describing the electron depolarization presented here captures almost all of the experimental ELDOR features in the TEMPOL and the trityl case, and especially the main features due to the eSD mechanism in the TEMPOL sample. This can next be used to study the effects of the eSD on the shapes of DNP spectra, which will enable us to improve the SE and CE based analysis used in ref. 45–47 and our understanding of the electron and nuclear spin dynamics during MW irradiation. In particular, the electron depolarization is expected to result in a reduction of the DNP efficiency,21,55 which can lead to a change in the expected SE and CE line shapes and may explain the decrease of the DNP efficiency at low temperatures reported earlier.45–47
The eSD rates used here do not depend on temperature, and resulted in ΛeSD and TeSD parameters of 10 (μs)−3 and 250 μs for the trityl sample and 2000 (μs)−3 and 10 μs for the TEMPOL sample (as defined in eqn (15)). As the magnitude of ΛeSD is expected to scale with the cube of the average dipolar interaction (see Appendix A), it can be expected that ΛeSD for 15 mM trityl will be about an order of magnitude smaller than for 40 mM TEMPOL. That the actual ratio is still another order of magnitude smaller can be attributed to model limitations or to physical differences between the radicals. The former includes effects of the finite bin size and uncertainty in the simulation parameters – such as the value of T2e. Physical reasons include non-eSD electron polarization transfer mechanisms, such as polarization transfer to the nuclei and electron-nucleus relaxation, and in particular to the 14N nuclei in the TEMPOL sample.52,76–78 Such non-eSD mechanisms can explain the narrowing of the Eexcite profile of the TEMPOL sample at long MW irradiation times (Fig. 3 and 4). As a result of this discussion we must conclude that at this point the fitted values of ΛeSD cannot yet be straightforwardly correlated to the network of interacting electrons and the fluctuating dipolar interactions between them. More experimental results are necessary to enable us to interpret the ΛeSD values and to investigate their temperature dependence. These experiments must include measurements at different electron concentrations on each of the radical types and replacing 1H nuclei by 2H, and in nitroxide based radicals 14N by 15N. In addition, a better knowledge of the mechanism can be gained by measuring the electron polarization distribution as a function of time.
To conclude, in this articles we have shown that the electron spectral diffusion mechanism has a large influence on the electron polarization distributions in samples presently used during DNP experiments. These distributions can be explained using a set of rate equation for the electron and nuclear polarizations, and introducing a model for taking the eSD process into account. In future studies this model will be used to explain the influence of the electron polarization distribution on the DNP enhancements, and can also be beneficial in the context of EPR spectroscopy. The resulting distribution profiles cannot be described relying on the classical TM mechanism and this should therefore not be used during the interpretation of the DNP induced nuclear enhancements observed in our samples.
Appendix A: derivation of the electron spectral diffusion rate
In this Appendix we discuss the assumptions and some considerations leading to the form of the polarization exchange rates between the frequency bins given in eqn (14). The dependence of these rates on the interaction parameters of the spin system is difficult to derive; however a dependence on the frequency differences between the electron bins, |ωj − ωj′|, the EPR line-shape, and on the bin size, |ωj − ωj−1| can be suggested. In order to propose such a dependence we first consider the polarization exchange between two single electrons at frequencies ωj′ and ωj′′ in the system. This exchange process, ignoring the effect of all other interactions, depends on the magnitude of the off-diagonal dipolar flip-flop terms in the two-electron spin Hamiltonian. Electron spin flips modulating this dipolar interaction are the source of the eSD exchange process.20,60,62 For a fixed electron pair the efficiency of this process is largest when the resonance frequencies of the electrons are equal and decreases for increasing frequency difference |ωj − ωj′′|. Thus, the dependence of the exchange rate between these electrons,
  , on the frequency difference must have some bell shaped form. Without deriving an explicit expression for the exchange rate between the electrons that can directly be transferred to the exchange rates between the bins, we assume a Lorenzian line-shape dependence of the form
 | (18) |
 | (19) |
Here the value of the dipolar parameter ![[capital Delta, Greek, macron]](https://www.rsc.org/images/entities/i_char_e135.gif) is expected to be smaller than the dipolar interaction between neighboring electrons, and the width coefficient
is expected to be smaller than the dipolar interaction between neighboring electrons, and the width coefficient ![[small delta, Greek, macron]](https://www.rsc.org/images/entities/i_char_e0c5.gif) is again smaller than this value. The frequency differences become a multiple of the frequency width of the bins |ωj − ωj−1|. Eqn (19) can be simplified if
is again smaller than this value. The frequency differences become a multiple of the frequency width of the bins |ωj − ωj−1|. Eqn (19) can be simplified if ![[small delta, Greek, macron]](https://www.rsc.org/images/entities/i_char_e0c5.gif) ≪ |ωj − ωj′|, resulting in
≪ |ωj − ωj′|, resulting in
 | (20) |
 . This assumption is justified for the systems considered in the present study, where the value of
 ![[capital Delta, Greek, macron]](https://www.rsc.org/images/entities/i_char_e135.gif) and the bin width are both of the order of a couple of MHz.
and the bin width are both of the order of a couple of MHz.
We next consider the bin structure of our macroscopic system composed of Ne electrons, with Nj = Nefj electrons in each of the ωj bins. The rate of polarization exchange between the average polarizations Pj in bin j and Pj′ in bin j′ depends on the number of electrons in each of these bins, Nj and Nj′, the average exchange rate between pairs of electrons,  , and the number of such electron pairs, nj,j′. Realizing that we average over all possible polarization distributions inside each bin and that the average exchange rates inside the bins is faster that the inter-bin polarization exchange, such that at all time each bin can be described by an average Pj polarization, the macroscopic exchange rates
  between the pairs of bins can be estimated to have the following dependence:
 | (21) |
Assuming that each electron in bin j has only a single directly exchanging electron in bin j′, the parameter nj,j′ can be expressed by
| nj,j′ = Nefjfj′ | (22) |
 | (23) |
Thus, without taking polarization conservation into account but leaving the Boltzmann steady state conditions, we get that the exchange dynamics between pairs of polarizations is given by
 | (24) |
 matrices on the polarization distribution, as given in eqn (13), with eqn (14) given by eqn (20).
In future studies eqn (18) and (19) must be justified theoretically, and the exact dependence of the parameters in the latter (and therefore also in eqn (14)) on the electron concentration and the bin size must be derived.
Acknowledgements
We thank Dr Arnold Raitsimring for helpful discussions regarding the origins of electron spectral diffusion. This work was supported by the German-Israeli Project Cooperation of the DFG through a special allotment by the Ministry of Education and Research (BMBF) of the Federal Republic of Germany. This research was also made possible in part by the historic generosity of the Harold Perlman Family. D.G. holds the Erich Klieger Professorial Chair in Chemical Physics.References
- A. Overhauser, Phys. Rev., 1953, 92(2), 411–415 CrossRef CAS.
- T. R. Carver and C. P. Slichter, Phys. Rev., 1953, 92(1), 212–213 CrossRef CAS.
- C. Jeffries, Phys. Rev., 1957, 106(1), 164–165 CrossRef CAS.
- R. A. Wind, M. J. Duijvestijn, C. van der Lugt, A. Manenschijn and J. Vriend, Prog. Nucl. Magn. Reson. Spectrosc., 1985, 17, 33–67 CrossRef CAS.
- M. Afeworki, S. Vega and J. Schaefer, Macromolecules, 1992, 25(16), 4100–4105 CrossRef CAS.
- M. Afeworki, R. A. McKay and J. Schaefer, Macromolecules, 1992, 25(16), 4084–4091 CrossRef CAS.
- M. Afeworki and J. Schaefer, Macromolecules, 1992, 25(16), 4092–4096 CrossRef CAS.
- L. R. Becerra, G. J. Gerfen, R. J. Temkin, D. J. Singel and R. G. Griffin, Phys. Rev. Lett., 1993, 71(21), 3561–3564 CrossRef CAS.
- G. J. Gerfen, L. R. Becerra, D. A. Hall, R. G. Griffin, R. J. Temkin and D. J. Singel, J. Chem. Phys., 1995, 102(24), 9494 CrossRef CAS PubMed.
- D. A. Hall, D. Maus, G. J. Gerfen, S. J. Inati, L. R. Becerra, F. W. Dahlquist and R. G. Griffin, Science, 1997, 276(5314), 930–932 CrossRef CAS.
- J. H. Ardenkjaer-Larsen, B. Fridlund, A. Gram, G. Hansson, L. Hansson, M. H. Lerche, R. Servin, M. Thaning and K. Golman, Proc. Natl. Acad. Sci. U. S. A., 2003, 100(18), 10158–10163 CrossRef CAS PubMed.
- A. V. Kessenikh, V. I. Luschikov, A. A. Manenkov and Y. V. Taran, Sov. Phys. Solid State, 1963, 5, 321–329 Search PubMed.
- A. V. Kessenikh, V. I. Luschikov and A. A. Manenkov, Sov. Phys. Solid State, 1963, 5, 835–837 Search PubMed.
- A. V. Kessenikh, A. A. Manenkov and G. I. Pyatnitskii, Sov. Phys. Solid State, 1964, 6, 641–643 Search PubMed.
- C. Hwang and D. Hill, Phys. Rev. Lett., 1967, 18(4), 110–112 CrossRef CAS.
- D. Wollan, Phys. Rev. B: Solid State, 1976, 13(9), 3671–3685 CrossRef CAS.
- I. Solomon, Magnetic Resonance and Relaxation, North-Holland, Amsterdam, 1963, p. 25 Search PubMed.
- A. Abragam and M. Goldman, Rep. Prog. Phys., 1978, 41(3), 395–467 CrossRef CAS.
- V. A. Atsarkin and A. V. Kessenikh, Appl. Magn. Reson., 2012, 43(1–2), 7–19 CrossRef.
- A. Abragam, The Principles of Nuclear Magnetism, Oxford University Press, London, 1961 Search PubMed.
- Y. Hovav, A. Feintuch and S. Vega, J. Magn. Reson., 2010, 207(2), 176–189 CrossRef CAS PubMed.
- Y. Hovav, A. Feintuch and S. Vega, J. Chem. Phys., 2011, 134(7), 074509 CrossRef PubMed.
- A. Karabanov, A. van der Drift, L. J. Edwards, I. Kuprov and W. Köckenberger, Phys. Chem. Chem. Phys., 2012, 14(8), 2658–2668 RSC.
- K.-N. Hu, G. T. Debelouchina, A. A. Smith and R. G. Griffin, J. Chem. Phys., 2011, 134(12), 125105 CrossRef PubMed.
- Y. Hovav, A. Feintuch and S. Vega, J. Magn. Reson., 2012, 214(1), 29–41 CrossRef CAS PubMed.
- Y. Hovav, O. Levinkron, A. Feintuch and S. Vega, Appl. Magn. Reson., 2012, 43(1–2), 21–41 CrossRef CAS.
- A. Karabanov, G. Kwiatkowski and W. Köckenberger, Appl. Magn. Reson., 2012, 43(1–2), 43–58 CrossRef CAS.
- K. R. Thurber and R. Tycko, J. Chem. Phys., 2012, 137(8), 084508 CrossRef PubMed.
- F. Mentink-Vigier, U. Akbey, Y. Hovav, S. Vega, H. Oschkinat and A. Feintuch, J. Magn. Reson., 2012, 224, 13–21 CrossRef CAS PubMed.
- K. R. Thurber and R. Tycko, Isr. J. Chem., 2014, 54(1–2), 39–46 CrossRef CAS.
- A. G. Redfield, Phys. Rev., 1955, 98(6), 1787–1809 CrossRef CAS.
- B. N. Provotorov, Sov. Phys. JETP, 1962, 14(5), 1126–1131 Search PubMed.
- M. Goldman, Spin temperature and nuclear magnetic resonance in solids, Clarendon Press, Oxford, 1970 Search PubMed.
- A. Abragam and M. Borghini, Prog. Low Temp. Phys., 1964, 4, 384–449 CAS.
- W. de Boer, J. Low Temp. Phys., 1976, 22(1–2), 185–212 CrossRef CAS.
- M. Borghini and K. Scheffler, Phys. Rev. Lett., 1971, 26(22), 1362–1365 CrossRef CAS.
- S. F. J. Cox, V. Bouffard and M. Goldman, J. Phys. C: Solid State Phys., 1973, 6(5), L100–L103 CrossRef CAS.
- W. de Boer, M. Borghini, K. Morimoto, T. O. Niinikoski and F. Udo, J. Low Temp. Phys., 1974, 15(3–4), 249–267 CrossRef CAS.
- F. Kurdzesau, B. van den Brandt, A. Comment, P. Hautle, S. Jannin, J. J. van der Klink and J. A. Konter, J. Phys. D: Appl. Phys., 2008, 41(15), 155506 CrossRef.
- J. H. Ardenkjaer-Larsen, S. Macholl and H. Johannesson, Appl. Magn. Reson., 2008, 34(3–4), 509–522 CrossRef CAS.
- S. Jannin, A. Comment, F. Kurdzesau, J. Konter, P. Hautle, B. van den Brandt and J. J. van der Klink, J. Chem. Phys., 2008, 128(24), 241102 CrossRef CAS PubMed.
- L. L. Lumata, A. K. Jindal, M. E. Merritt, C. R. Malloy, A. D. Sherry and Z. Kovacs, J. Am. Chem. Soc., 2011, 133(22), 8673–8680 CrossRef CAS PubMed.
- L. L. Lumata, M. E. Merritt, C. R. Malloy, A. D. Sherry and Z. Kovacs, Appl. Magn. Reson., 2012, 43(1–2), 69–79 CrossRef CAS.
- S. Jannin, A. Comment and J. J. Klink, Appl. Magn. Reson., 2012, 43(1–2), 59–68 CrossRef CAS.
- D. Shimon, Y. Hovav, A. Feintuch, D. Goldfarb and S. Vega, Phys. Chem. Chem. Phys., 2012, 14(16), 5729–5743 RSC.
- D. Banerjee, D. Shimon, A. Feintuch, S. Vega and D. Goldfarb, J. Magn. Reson., 2013, 230, 212–219 CrossRef CAS PubMed.
- D. Shimon, A. Feintuch, D. Goldfarb and S. Vega, Phys. Chem. Chem. Phys., 2014, 16(14), 6687–6699 RSC.
- V. A. Atsarkin, Sov. Phys. JETP, 1970, 31(6), 1012–1018 Search PubMed.
- V. A. Atsarkin, Sov. Phys. JETP, 1971, 32(3), 421–425 Search PubMed.
- V. A. Atsarkin and M. I. Rodak, Sov. Phys. Usp., 1972, 15(3), 251–265 CrossRef PubMed.
- C. T. Farrar, D. A. Hall, G. J. Gerfen, S. J. Inati and R. G. Griffin, J. Chem. Phys., 2001, 114(11), 4922 CrossRef CAS PubMed.
- J. Granwehr and W. Köckenberger, Appl. Magn. Reson., 2008, 34(3–4), 355–378 CrossRef CAS.
- V. Nagarajan, Y. Hovav, A. Feintuch, S. Vega and D. Goldfarb, J. Chem. Phys., 2010, 132(21), 214504 CrossRef PubMed.
- D. Banerjee, J. C. Paniagua, V. Mugnaini, J. Veciana, A. Feintuch, M. Pons and D. Goldfarb, Phys. Chem. Chem. Phys., 2011, 13(41), 18626–18637 RSC.
- T. Siaw, M. Fehr, A. Lund, A. Latimer, S. A. Walker, D. T. Edwards and S.-I. Han, Phys. Chem. Chem. Phys., 2014, 16(35), 18694–18706 RSC.
- P. Schosseler, T. Wacker and A. Schweiger, Chem. Phys. Lett., 1994, 224(3–4), 319–324 CrossRef CAS.
- M. I. Rodak, J. Exp. Theor. Phys., 1972, 34(2), 832–842 Search PubMed.
- J. Klauder and P. Anderson, Phys. Rev., 1962, 125(3), 912–932 CrossRef CAS.
- W. B. Mims, Electron Spin Echoes, Plenum, New York, 1972, pp. 263–351 Search PubMed.
- A. M. Raitsimring, K. M. Salikhov, S. F. Bychkov and Y. D. Tsvetkov, Sov. Phys. Solid State, 1975, 17(2), 303–306 Search PubMed.
- K. M. Salikhov and Y. D. Tsvetkov, Electron Spin-Echo Studies of Spin-Spin Interactions in Solids, Wiley, New York, 1979, pp. 231–278 Search PubMed.
- S. A. Dzuba and A. Kawamori, Concepts Magn. Reson., 1996, 8(1), 49–61 CrossRef CAS.
- A. Feintuch, D. Shimon, Y. Hovav, D. Banerjee, I. Kaminker, Y. Lipkin, K. Zibzener, B. Epel, S. Vega and D. Goldfarb, J. Magn. Reson., 2011, 209(2), 136–141 CrossRef CAS PubMed.
- M. Borghini, Phys. Rev. Lett., 1968, 20(9), 419–421 CrossRef CAS.
- Y. Hovav, A. Feintuch, S. Vega and D. Goldfarb, J. Magn. Reson., 2014, 238, 94–105 CrossRef CAS PubMed.
- B. Epel, I. Gromov, S. Stoll, A. Schweiger and D. Goldfarb, Concepts Magn. Reson., Part B, 2005, 26B(1), 36–45 CrossRef.
- S. N. Trukhan, V. F. Yudanov, V. M. Tormyshev, O. Y. Rogozhnikova, D. V. Trukhin, M. K. Bowman, M. D. Krzyaniak, H. Chen and O. N. Martyanov, J. Magn. Reson., 2013, 233C, 29–36 CrossRef PubMed.
- S. Colombo Serra, A. Rosso and F. Tedoldi, Phys. Chem. Chem. Phys., 2012, 14(38), 13299–13308 RSC.
- S. Colombo Serra, A. Rosso and F. Tedoldi, Phys. Chem. Chem. Phys., 2013, 15(21), 8416–8428 RSC.
- S. Colombo Serra, M. Filibian, P. Carretta, A. Rosso and F. Tedoldi, Phys. Chem. Chem. Phys., 2014, 16(2), 753–764 RSC.
- A. Karabanov, I. Kuprov, G. T. P. Charnock, A. van der Drift, L. J. Edwards and W. Köckenberger, J. Chem. Phys., 2011, 135(8), 084106 CrossRef PubMed.
- J. Jeener, Adv. Magn. Reson., 1982, 10, 1–51 CAS.
- M. H. Levitt and L. Di Bari, Phys. Rev. Lett., 1992, 69(21), 3124–3127 CrossRef.
- M. Ernst and B. H. Meier, Spin Diffusion in Solids, in Solid State NMR of Polymers, ed. I. Ando and T. Asakura, 1988, ch. 4, vol. 84, pp. 83–121 Search PubMed.
- A. Abragam and M. Goldman, Nuclear Magnetism: Order and Disorder, Clarendon Press, Oxford, 1982 Search PubMed.
- G. G. Maresch, M. Weber, A. Dubinskii and H. Spiess, Chem. Phys. Lett., 1992, 193(1–3), 134–140 CrossRef CAS.
- M. Florent, I. Kaminker, V. Nagarajan and D. Goldfarb, J. Magn. Reson., 2011, 210(2), 192–199 CrossRef CAS PubMed.
- I. Kaminker, T. D. Wilson, M. G. Savelieff, Y. Hovav, H. Zimmermann, Y. Lu and D. Goldfarb, J. Magn. Reson., 2014, 240, 77–89 CrossRef CAS PubMed.
- C. D. Jeffries, Dynamic Nuclear Orientation, Wiley, New York, 1963 Search PubMed.
Footnote |
| † Electronic supplementary information (ESI) available. See DOI: 10.1039/c4cp03825h |
| This journal is © the Owner Societies 2015 |

