A phase field model coupling lithium diffusion and stress evolution with crack propagation and application in lithium ion batteries
Peng
Zuo
and
Ya-Pu
Zhao
*
State Key Laboratory of Nonlinear Mechanics (LNM), Institute of Mechanics, Chinese Academy of Sciences, Beijing 100190, China. E-mail: yzhao@imech.ac.cn
First published on 20th May 2014
Abstract
Cracking and fracture of electrodes under diffusion during lithiation and delithiation is one of the main factors responsible for short life span of lithium based batteries employing high capacity electrodes. Coupling effects among lithium diffusion, stress evolution and crack propagation have a significant effect on dynamic processes of electrodes during cycling. In this paper, a phase field model coupling lithium diffusion and stress evolution with crack propagation is established. Then the model is applied to a silicon thin film electrode to explore the coupling effects on diffusion and crack propagation paths. During lithiation, simulation results show that lithium accumulates at crack tips and the lithium accumulation further reduces the local hydrostatic stress. Single and multiple crack geometries are considered to elucidate some of the crack patterns in thin film electrodes as a consequence of coupling effects and crack interactions.
1 Introduction
Traditional carbonaceous materials as anode materials for commercial lithium ion batteries cannot meet the requirements for high energy capacity (for graphite 372 mA h g−1) and long life span in electrical equipment, electrical vehicles and high performance computing.1,2 In recent years, silicon (Si) has been considered as a more suitable promising anode material than commercial graphite in lithium ion batteries due to it having the highest energy density (4200 mA h g−1) of all other substitutes (e.g., antimony, tin).3–5 However, the commercialization of silicon anodes is limited by mechanical failure resulting from the huge volume change (∼400%, due to the fact that each silicon atom can theoretically accommodate 3.75 lithium atoms) and stress development in charging and discharging cycles, which leads to the loss of the conduction path for electrons.6 During the charge process (discharge process), a large number of Li ions enter (are extracted from) the silicon anode and form a fully charged state of Li22Si5 which causes a huge volume change and stress development due to the mismatch between swelling and non-swelling parts and constraining by external agencies. Several cycles later, cracks gradually form and the anode will break into pieces and even into a powder. Cracking and fracture have been the one of the most important bottlenecks for the development of lithium ion batteries.6A better understanding of the mechanisms of electrode fracture is needed to provide insights into structural reliability of electrodes and evolution of cracks during charge and discharge. Consequently, a large body of literature has appeared in the last decades on fracture in electrodes. Experimentally, crack evolution during lithiation of individual silicon nanoparticles in real time with in situ transmission electron microscopy and crack evolution of silicon particles with average sizes of 1–5 μm after 200 cycles via scanning electron microscopy have been studied.7,8 Fracture in Si nanopillars of different axial orientation and size during the first cycle of lithiation and delithiation was investigated and it was found that, upon lithiation, fracture sites are located at the surface of nanopillars between neighboring {110} lateral planes.9 In addition, cracks in a Si thin film during cycles of lithiation and delithiation were observed.6,10–12 Recently, the fracture energy of lithiated silicon thin film electrodes has been measured and the results have shown that lithiated silicon demonstrates a unique ability to flow plastically and fracture in a brittle manner.13 In order to solve the challenging problem of cracks in electrodes, many analytical models were developed. A cohesive model of crack nucleation in an initially crack free strip electrode and in a cylindrical electrode under galvanostatic process was developed to explore the critical characteristic dimension below which crack nucleation became impossible.14,15 The initiation condition of a pre-existing crack in a Si particle by Linear Elastic Fracture Mechanics (LEFM) was investigated.16 However, a full analysis of a complex electrode microstructure can only be accomplished via numerical simulations. The fracture patterns in amorphous Si thin film electrodes by modifying the two dimensional (2D) spring-block model proposed by Leung and Neda was investigated, and the simulations showed that there exists a critical film thickness below which the electrode would not crack. The spring-block model does not capture the coupling effects between diffusion and stress evolution because of its approximation of the galvanostatic charging condition with a constant strain. The cohesive zone model that takes diffusion–stress coupling into consideration was used to analyze crack propagation in silicon nanowires.17 A fully-coupled finite deformation theory for analyzing the coupled mechano-diffusional driving forces for fracture in electrode materials was developed.18 Also, a finite element method for modeling deformation, diffusion, and fracture using a cohesive zone was described by Bower.19 Bower's work gives an inspiration that lithium diffusion, stress evolution and crack propagation should be considered in the same model since coupling effects may have a significant effect on lithium diffusion, stress evolution and crack propagation. However, the modeling of crack propagation under diffusion taking multiple coupling effects into consideration is still rare in the literature. And we recall that finite element based numerical implementations of sharp crack discontinuities are complicated by complex crack topologies. In order to avoid these difficulties, a new approach which captures the main features of multi-field couplings and complex crack topologies should be proposed.
Phase field models (PFMs), also called diffuse interface models, were introduced for the purpose of avoiding tracking the interfaces. Now, PFMs have emerged as a powerful computational approach to model and predict mesoscale morphological and microstructural evolution in materials.20 Recently, PFMs have been proposed for a number of other important material evolution processes including grain growth,21 surface stress induced pattern formation22 and dislocation dynamics.23 The application of the PFMs to the challenging problem of crack propagation in solids has been explored by Aranson et al.,24 Karma et al.,25–27 Miehe et al.,28–30 Marconi et al.31 and Spatschek et al.32–34 PFMs for fracture offer self-consistent descriptions of brittle fracture in both quasistatic and dynamic regimes of crack propagation and the models capture the main features of crack propagation including the Griffith criterion predicting crack initiation and the Principle of Local Symmetry (PLS) predicting the path of the crack. In addition, PFMs for fracture are suitable for multiphysical problems. Miehe et al.29 extended the PFMs to build a three-field problem model that coupled the displacement with the electrical potential and the fracture phase field. In the present paper, a multi-field problem model coupling lithium diffusion and stress evolution with crack propagation based on PFMs is implemented.
The present paper is organized as follows. First a PFM coupling lithium diffusion and stress evolution with crack propagation is established. Then this PFM is applied to silicon thin film electrodes of lithium ion batteries to explore the coupling effects on lithium diffusion and crack propagation separately. Last, some meaningful results and future perspectives of this work are given in the conclusions.
2 A PFM coupling lithium diffusion and stress evolution with crack propagation
2.1 PFM of crack propagation
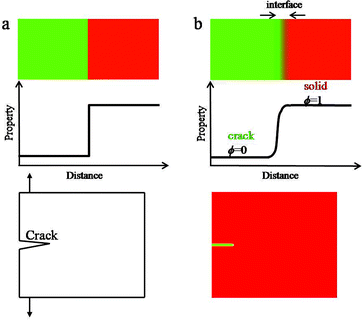
The classical theory of LEFM regards cracks as sharp interface models, where the crack behaviour is determined by the singularities of the stress field at the crack tip. However, such singularities would lead to difficult numerical issues when considering the movement, interaction of many cracks and crack propagation path. Different to the traditional sharp interface model, in the PFM, cracks are regarded as general phase transformations which are represented continuously by a single variable known as the order parameter ϕ. In this context, the order parameter ϕ is called the fracture order parameter representing the state of the solid and changes from 0 to 1.25 For example, ϕ = 1, ϕ = 0 and 0 < ϕ < 1 represent the intact, fully broken and transitional regions in the material, respectively. The evolution equation of the fracture order parameter is derived by a variational method from the total free energy of the system. The difference between the sharp interface model and the diffuse interface model is shown in Fig. 1. In the sharp interface model, properties change sharply across the interface and can be described mathematically by a step function. While in the diffuse interface model, properties vary smoothly across the interface according to a hyperbolic tangent function.In the present case, establishing the PFM coupling lithium diffusion and stress evolution with crack propagation consists of three main steps. First, parameters of the system to describe the transition of the system are selected. Then, the total free energy of the system based on the selected parameters is determined. Last, the governing equations of the system are derived by solving the Cahn–Hilliard equation for the local conserved parameter and the Ginzberg–Landau equations for non-conserved parameters.
2.2 Parameters of the system
In this PFM, the total free energy of the system is characterized by lithium concentration, elastic deformation and cracks in the system, therefore the field parameters of interest are local concentration c, displacement field ui and fracture order parameter ϕ. c represents the local concentration of lithium, which is non-dimensionalized by maximum concentration cmax, and takes values between 0 and 1. ui is introduced due to consideration of elastic strain energy of the system. ϕ represents the crack regions in the system as described in the previous section and also takes values between 0 and 1. In general, the values of c and ϕ are nonuniform, and as in all PFMs, both variables are assumed to vary smoothly and continuously in space. Therefore all parameters of the system are functions of space and time.2.3 Total free energy of the system
The total free energy of the system is expressed as a functional of the parameters, c, ui, ϕ | (1) |
The integral term on the right-hand side of eqn (1) includes four contributions: (A) fc, the density of free energy of a homogeneous system of uniform concentration c. (B) fϕ, the density of free energy of fracture order parameter representing cracks in the system. (C) fu, the elastic strain energy density. (D) kc(∇c)2/2 and kϕ(∇ϕ)2/2, gradient energies. The formation of each term in eqn (1) is described below.
(A) fc is the density of free energy of a homogeneous system of uniform concentration c. Part of the chemical potential is a derivative of fc, μ1 = ∂fc/∂c. In general, fc is usually modeled by a regular solution model35 or an ideal solution model36 in the literature. In the present work, and considering that the focus of the present paper is coupling effects on lithium diffusion and crack propagation and for the simplicity of the simulation, fc is modeled by the following36
μ1 = ∂fc/∂c = μ0 + NAcmaxkBT![[thin space (1/6-em)]](https://www.rsc.org/images/entities/char_2009.gif) ln ln![[thin space (1/6-em)]](https://www.rsc.org/images/entities/char_2009.gif) c c | (2) |
(B) fϕ is modeled by the following when choosing the two minima at ϕ = 0 and ϕ = 1
| fϕ = hf(ϕ) = 16hϕ2(1 − ϕ)2 | (3) |
(C) fu is the elastic strain energy density. When considering the coupling between the fracture order parameter and the elastic field, the elastic strain energy density should be modified and modeled as follows
| fu = g(ϕ)(ξstrain − ξc) + ξc | (4) |
 , with α > 2. This function is such that in regions where the material is fully broken (ϕ = 0), the contribution to the elastic energy is zero, while in regions where the material is intact, the contribution to elastic energy recovers to that prescribed by linear elasticity. Taking into account the coupling through the function g(ϕ), when ξstrain > ξc, the broken state is favored, while when ξstrain < ξc, the intact state is favored. In addition, the stress has a great influence on lithium concentration in amorphous silicon electrodes.37 With consideration of coupling between diffusion and elastic field, ξstrain is written explicitly as follows38
 | (5) |
(D) The gradient energy densities, kc(∇c)2/2 and kϕ(∇ϕ)2/2, arise from the spatial variations of concentration and fracture order parameter, respectively. The term kc(∇c)2/2 contributes to the interface energy between lithiated and delithiated phases. And the term kϕ(∇ϕ)2/2 is related to the fracture surface energy. kc and kϕ are gradient energy coefficients.
2.4 Governing equations of the system
Through a variational method, the dynamic evolution of the parameters can be derived, which is found to be of the form of the Cahn–Hilliard equation or the Ginzburg–Landau equation, depending on whether the parameter can be assumed to be locally conserved or locally non-conserved.20 Due to the characteristic time of the elastic field being far less than that of the other two fields (concentration and fracture order parameter), the evolution equation of displacement is assumed to be quasistatic. The three governing equations of the system are derived by solving the Cahn–Hilliard equation which controls the evolution of locally conserved parameter, c, and the Ginzburg–Landau equations which control the evolution of locally non-conserved parameters, ui and ϕ: | (6) |
 | (7) |
 | (8) |
![[f with combining macron]](https://www.rsc.org/images/entities/i_char_0066_0304.gif) = fc + fϕ + fu + ½kc(∇c)2 + ½kϕ(∇ϕ)2 is the integral term in eqn (1).
= fc + fϕ + fu + ½kc(∇c)2 + ½kϕ(∇ϕ)2 is the integral term in eqn (1). ![[M with combining macron]](https://www.rsc.org/images/entities/i_char_004d_0304.gif) is molecular mobility and χ is a relaxation constant of the fracture order parameter.
is molecular mobility and χ is a relaxation constant of the fracture order parameter.
In eqn (6), which describes diffusion process, δF/δc represents the general chemical potential
 | (9) |
 | (10) |
μ = μ0 + NAcmaxkBT![[thin space (1/6-em)]](https://www.rsc.org/images/entities/char_2009.gif) ln ln![[thin space (1/6-em)]](https://www.rsc.org/images/entities/char_2009.gif) c − kc∇2c − Ω c − kc∇2c − Ω![[small sigma, Greek, tilde]](https://www.rsc.org/images/entities/i_char_e10d.gif) cmax cmax | (11) |
![[small sigma, Greek, tilde]](https://www.rsc.org/images/entities/i_char_e10d.gif) = g(ϕ)σ is modified hydrostatic stress.
= g(ϕ)σ is modified hydrostatic stress.
The flux vector, J, is assumed to be proportional to the gradient of the chemical potential, ∇μ. But the direction of the flux vector is opposite to that of the gradient of the chemical potential. For an interstitial diffuser, J can be written as
J = −Mc∇μ = −MNAcmaxkBT∇c + Mckc∇∇2c + McΩcmax∇![[small sigma, Greek, tilde]](https://www.rsc.org/images/entities/i_char_e10d.gif) | (12) |
![[M with combining macron]](https://www.rsc.org/images/entities/i_char_004d_0304.gif) = Mc is assumed and M is also molecular mobility.
= Mc is assumed and M is also molecular mobility.
The dynamic evolution of the concentration profile is governed by the mass conservation equation
 | (13) |
This dynamic evolution equation can be written in a more convenient form as
 | (14) |
Eqn (7) is the modified elastic equilibrium equation coupling elastic field with crack propagation, and can be written explicitly as follows
| ∂j[g(ϕ)σij] = 0 | (15) |
 | (16) |
Eqn (8), controlling dynamic evolution of fracture order parameter, is written as
 | (17) |
Eqn (14), (15) and (17) are the complete set of governing equations of the system. With proper initial and boundary conditions, the system will be well-posed.
3 Application to thin film electrode
3.1 Thin film electrode
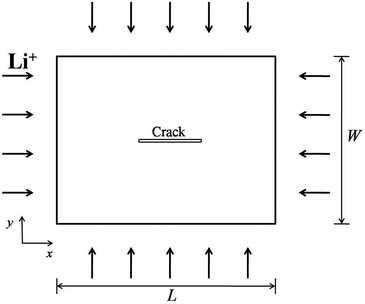
In general, a thin film electrode material (e.g., Si or Sn) is deposited on a current collector, usually made of Cu or Ti, via a thin-film deposition technique such as electron beam evaporation or sputtering. During the lithiation or delithiation process, a large volume change takes place when lithium intercalates into (or disintercalates from) the thin film. The constraint due to bonding between the film and the current collector and an inhomogenous distribution of lithium typically lead to a high stress level and an initial crack nucleating randomly in the thin film at the first cycle which will eventually evolve into a fracture pattern in the subsequent cycles. Some experiments indicate that the film–substrate interface is a weaker constraint due to interfacial sliding, which is of benefit to reduce the stress level in the thin film.39 In this case, the main focus is to explore the coupling effects on lithium diffusion and crack propagation in the thin film electrode during charge and discharge. To simplify the highly complicated 3D problem, the thin film is modeled as a 2D plane stress situation with free stress boundary conditions, ignoring the film–substrate weak constraint (see Fig. 2). The consideration of a 2D plane stress state model for the thin film electrode during charging and discharging requires less computation than that for a 3D model.The governing equations of the dynamic process in the simplified 2D thin film electrode model are obtained by degenerating the previous governing equations of the 3D problem (eqn (14)–(17)) into 2D one
 | (18) |
 | (19) |
 | (20) |
 | (21) |
 ,
,  ,
,  , u1 and u2 are displacements of x and y directions, respectively. In addition, in eqn (18), the fourth order terms are ignored for convenience in the numerical simulation.
Initial and boundary conditions are set as follows: for concentration, a constant concentration is taken on the boundary to simulate the charge process. In this paper, c = 1 (representing the maximum concentration) is taken on the boundary and the initial value of concentration on the thin film is zero at t = 0. For the displacement field, the free stress boundary condition is taken and the undeformed state is taken as the initial state. For the fracture order parameter, ϕ = 1 on the boundary is taken and the initial conditions corresponding to ϕ = 1 for intact phase and ϕ = 0 for cracked phase are used.
For convenience, the governing equations are non-dimensionalized. On consideration that energy is dissipated in the process zone around the crack tip where ϕ varies rapidly in space and time, eqn (21) implies that the size of the process zone is  , and the time of energy dissipation in this zone is τ = 1/(χEεc2).26 Also, by considering the diffusion, another characteristic time of the system is implied by eqn (18), t = ξ2/(MkBT). We take
  and t = ξ2/(MkBT) as characteristic length and time of the system, rescaling lengths by ξ, and times by t. After nondimensionalization, the system has three dimensionless parameters τ/t, h/(Eεc2) and ΩE/(NAkBT). If τ/t ≫ 1, the crack propagation is dominated by the dissipation rate in the process zone. In the opposite limit τ/t ≪ 1, the crack propagation is dominated by the equilibrium of the displacement field. h/(Eεc2) represents the ratio between surface energy and fracture energy. ΩE/(NAkBT) represents the coupling effect between diffusion and elastic field.
In addition, two significant criteria, the Griffith criterion predicting crack initiation and the Principle of Local Symmetry (PLS) predicting the path of the crack after crack initiation, are embedded in the PFM.27 In this 2D model, the fracture energy, which is equal to two times the surface energy theoretically, can be expressed as
 | (22) |
 . The Griffith critical condition states that a crack begins to propagate once the imposed elastic energy at the crack tip is higher than the fracture energy. The Principle of Local Symmetry (PLS) states that the crack advances in such a way that in plane shear stress vanishes in the vicinity of the crack tip, or the crack propagates in a pure opening mode (Mode I) where the stress field is symmetrical at the crack tip. The PLS can be expressed explicitly as
| KII = 0 | (23) |
The above initial-boundary value problem does not seem to propose an analytical solution. In the present study, this initial-boundary value problem, especially the equation system, eqn (18)–(21), is implemented into a finite-element code through the commercial software Comsol Multiphysics. The parameters used in the numerical simulation are tabulated in Table 1.
| E, elastic constant of silicon | 80 GPa |
| v, Poisson's ratio of silicon | 0.22 |
| Ω, partial molar volume | 8.5 × 10⁻⁶ m3 mol−1 |
| M, molecular mobility | 500 m2 J−1 s−1 |
| k B, Boltzmann constant | 1.38 × 10⁻²³ J K−1 |
| T, absolute temperature | 300 K |
| N A, Avogadro's constant | 6.02 × 10²³ mol−1 |
| ε c , threshold strain | 0.01 |
| h, energy barrier | 5 J m−3 |
| c max, maximum concentration | 1.18 × 10⁴ mol m−3 |
| τ/t, dimensionless number | 1 |
3.2 Coupling effects on lithium diffusion
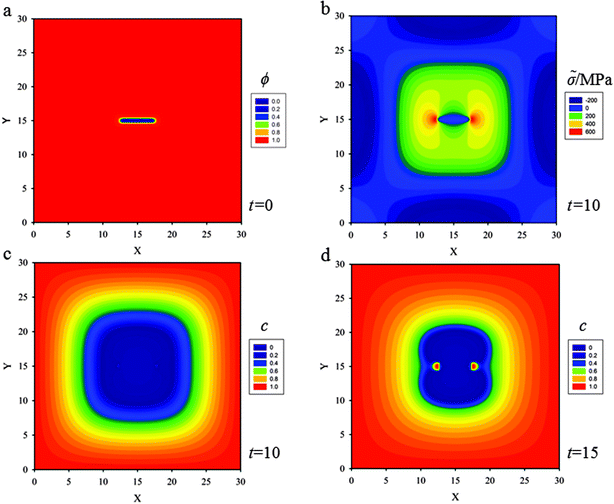
In order to emphasize the coupling effects among diffusion, stress evolution and crack propagation on lithium diffusion, in this case, the width of the square thin film electrode is W = L = 30ξ, and a stationary initial crack at the center of the 2D media of length 5ξ is set which will not evolve in the calculation (see Fig. 3a). The other initial and boundary conditions will be taken as the values displayed in Section 3.1.In Fig. 3b, as lithium diffuses into the thin film, the material in the outer region expands, leading to compressive stress within the lithiated outer region, and a corresponding tensile stress in the inner region where the initial crack is set. Due to the existence of a central crack in the thin film, two high stress localized regions with 600 MPa (red in Fig. 3b) appear at the crack tips. These high stress localizations are also known as stress concentrations. Meanwhile, the gradient of hydrostatic pressure has a significant effect on the diffusion process, especially at the crack tips. According to eqn (12), lithium flows from regions of lower hydrostatic stress to regions of higher hydrostatic stress, and since the large stress gradient is around the crack tips, there are large lithium fluxes towards the crack tips. In Fig. 3c and d, an evident accumulation of lithium in localized regions at the crack tips (red in Fig. 3d), corresponding to a concentration of 1.18 × 10⁴ mol m−3, can be seen due to the high hydrostatic stress at t = 15. Although, there are no experimental data in the literature to compare with the simulation results that lithium accumulates at the crack tips, similar phenomena of accumulation of hydrogen in hydrogen embrittlement scenarios could be found in experiments40 and simulations.41
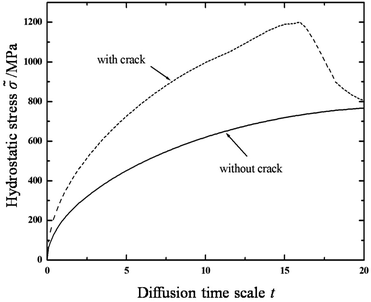
Accumulation of lithium at the crack tips further reduces hydrostatic stress due to volumetric expansion caused by a stress-free strain. According to the strain component form εij = εEij + Ωcδij/3, for a given total strain, εij, an increase in the strain caused by volumetric expansion, Ωcδij/3, will lower the elastic strain, εEij, leading to a corresponding decrease in stress. Furthermore, because of the reduced stress state at the crack tips, the crack will be more stable. In order to explore the stress state at the crack tips in detail, the evolution of hydrostatic stress at the crack tip (coordinate: x = 18, y = 15) is plotted in Fig. 4 under two cases, one of which (the solid line) is plotted without a central crack in the thin film, the other one (the dashed line) is plotted with a central crack. One obvious observation is that hydrostatic stress increases gradually with lithium diffusing into the thin film when there is not a central crack set in the thin film. The other obvious observation is that the hydrostatic stress in the thin film with a central crack is higher than that in the thin film without a central crack, due to the stress concentration at crack tips. In particular, as analysed above, the hydrostatic stress at the crack tips evidently undergoes changes in two stages. In the first stage, the hydrostatic stress increases to the peak value at t = 15, and then it decreases dramatically due to the accumulation of lithium at the crack tips.
3.3 Coupling effects on crack propagation
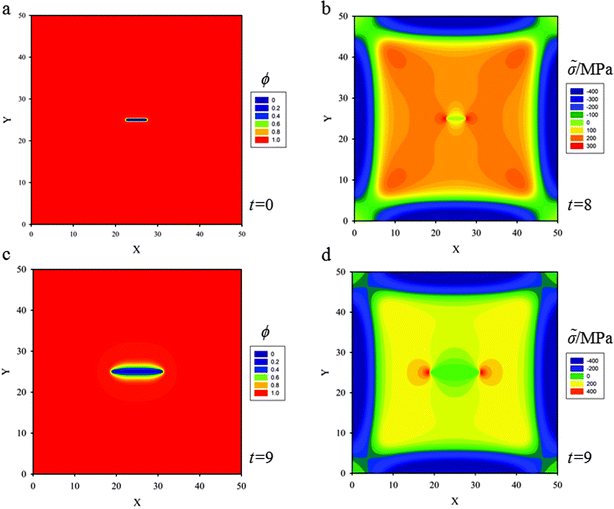
Coupling effects among diffusion, stress evolution and crack propagation have a great influence on diffusion as well as crack propagation. In the thin film electrode, multiple cracks, rather than a single crack, appear in the first cycle. The interaction between cracks is another important factor that affects crack propagation during sequential cycles. In this section, insights are provided into crack trajectories when cracks are close enough to interact. Without loss of generality, we assume the following scenarios: a single crack, two parallel cracks, two vertical cracks, two oblique cracks and three skew parallel cracks in the thin film and we let lithium diffuse into the thin film to explore the evolution of these multiple cracks. In this section, W = L = 50ξ is used as the model size. The initial and boundary conditions will be taken as values displayed in Section 3.1, and the parameters in the numerical simulation are taken from Table 1.(a) First, a single crack of length 5ξ is placed at the center of the thin film (Fig. 5a). As lithium diffuses into the thin film, the compressive stress field in the outer lithiated region and the tensile stress field in the inner region gradually evolve and there is a stress concentration (shown in red corresponding to a hydrostatic stress of 300 MPa) at the crack tips (Fig. 5b). When the Griffith critical condition is reached at the crack tip (with hydrostatic stress of 300 MPa), at t = 8, a crack starts to propagate. Fig. 5c shows that the crack propagates along with the original direction in which KII = 0 due to the symmetrical stress field. Fig. 5d shows the stress distribution after crack propagation.
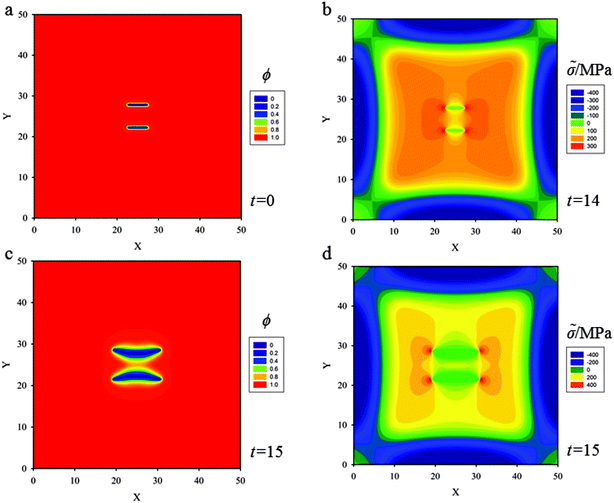
(b) A pair of aligned cracks of length 5ξ, lying side by side at a distance 5ξ is placed at the center of the thin film (Fig. 6a). If just one single crack is placed in the thin film, straight propagation due to the symmetrical stress field causing KII = 0 illustrated in the previous section will occur. In the case of two aligned cracks, as lithium diffuses into the thin film, the stress field near the crack tips of the upper crack consists of two parts, one is induced by the upper crack itself, and the other is induced by the lower crack acting on the upper crack, so does the lower crack (Fig. 6b). This is similar to the interaction between two parallel screw dislocations.
When the Griffith critical condition (with hydrostatic stress of 300 MPa) is reached at the crack tips, the cracks start to propagate (Fig. 6b). Fig. 6c shows that as the upper crack propagates it diverges from straight propagation and kinks upwards. The lower crack kinks downwards. The crack paths evolving from the two initial cracks spread apart. In this sense, the two aligned cracks ‘repel’ each other.
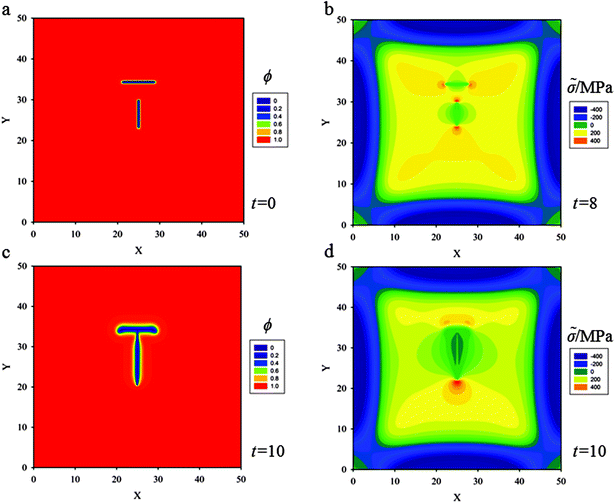
(c) A horizontal crack of length 6ξ with another crack of length 5ξ approaching the horizontal one at a right angle of distance 5ξ is placed, as shown in Fig. 7a. Fig. 7b shows that superposition of stress fields induced by the horizontal crack and by the vertical crack leads to an asymmetrical stress field at crack tips for the horizontal crack, and a symmetrical one for the vertical crack. When the Griffith critical condition is reached (with hydrostatic stress of 300 MPa), the cracks start to propagate (Fig. 7b). The horizontal crack propagates diverging from straight propagation and kinks downward. The vertical crack propagates along the initial direction and intersects the horizontal one at a right angle (see Fig. 7c).
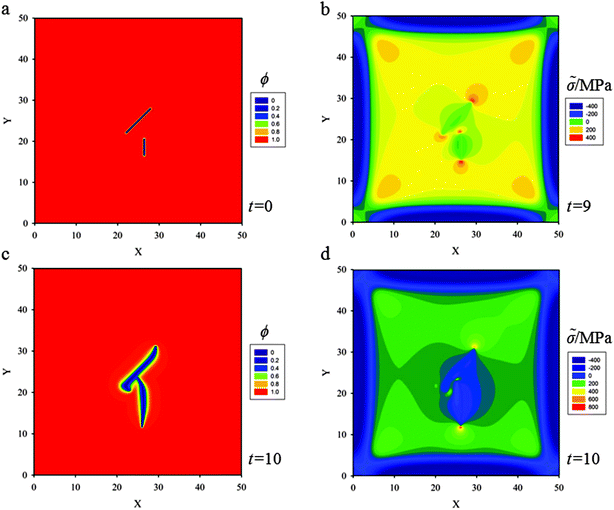
For a more general situation, two cracks with oblique positions are placed at the center of the thin film. Further simulations show that the two cracks still intersect at a right angle (see Fig. 8). These results could give a qualitative explanation why most junction angles are about 90° in thin film electrodes during cycling.42
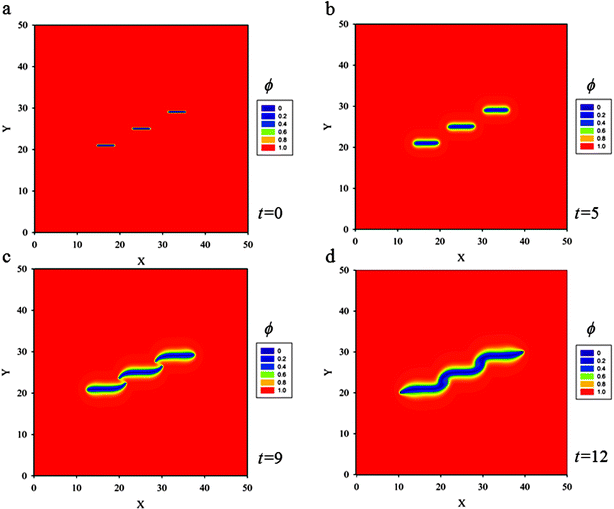
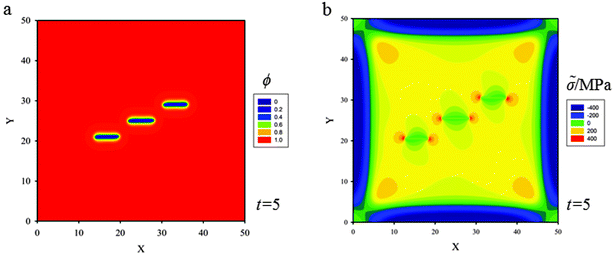
(d) Three skew parallel cracks of length 5ξ and separation distance between two of them 5ξ are placed at the center of the thin film (Fig. 9a). Snapshots of crack propagation at different times during lithiation are shown in Fig. 9. Fig. 10 illustrates the distribution of hydrostatic stress at t = 5 during lithiation. Fig. 10b shows that the stress fields of internal crack tips are strongly influenced by the nearest crack, but the stress fields of external tips are less influenced. Therefore, the behaviour of the internal tips is significantly different from that of the external tips. Fig. 9 shows the internal tips have a strong tendency to attract each other, while the external tips propagate along the original direction. In the end, these three cracks coalesce and merge into only one single crack so as to relieve the elastic energy stored in the thin film most efficiently.
4 Conclusions
A PFM coupling lithium diffusion and stress evolution with crack propagation is formulated. Then the PFM is applied to a silicon thin film electrode to study the coupling effects on diffusion and crack propagation during lithiation.Simulation results demonstrate that the coupling effects among diffusion, stress evolution and crack propagation significantly affect the lithium diffusion leading to accumulation of lithium at crack tips due to the high hydrostatic stress and that accumulation of lithium at crack tips further reduces the hydrostatic stress due to volumetric expansion. Simulation results also demonstrate that a single straight crack propagates along the original direction, two parallel cracks ‘repel’ each other, two perpendicular cracks and even two oblique cracks meet at a right angle, and three skew parallel cracks coalesce and merge into one crack.
The present study assists the understanding of the dynamic process and failure mechanism of electrodes in lithium ion batteries, and provides insightful guidelines for viable design of electrodes in the future.
Acknowledgements
This work was supported by the National Natural Science Foundation of China (NSFC, Grant No. 11372313), the Key Research Program of the Chinese Academy of Sciences (Grant No. KJZD-EW-M01), the Instrument Developing Project of the Chinese Academy of Sciences (Grant No. Y2010031) and the CAS/SAFEA International Partnership Program for Creative Research Teams.References
- D. Larcher, S. Beattie, M. Morcrette, K. Edstrom, J. C. Jumas and J. M. Tarascon, J. Mater. Chem., 2007, 17, 3759–3772 RSC.
- U. Kasavajjula, C. S. Wang and A. J. Appleby, J. Power Sources, 2007, 163, 1003–1039 CrossRef CAS.
- B. A. Boukamp, G. C. Lesh and R. A. Huggins, J. Electrochem. Soc., 1981, 128, 725–729 CrossRef CAS PubMed.
- X. M. He, W. H. Pu, L. Wang, J. G. Ren, C. Y. Jiang and C. R. Wan, Electrochim. Acta, 2007, 52, 3651–3653 CrossRef CAS PubMed.
- Y. Kwon, M. G. Kim, Y. Kim, Y. Lee and J. P. Cho, Electrochem. Solid-State Lett., 2006, 9, A34–A38 CrossRef CAS PubMed.
- L. Y. Beaulieu, K. W. Eberman, R. L. Turner, L. J. Krause and J. R. Dahn, Electrochem. Solid-State Lett., 2001, 4, A137–A140 CrossRef CAS PubMed.
- X. H. Liu, L. Zhong, S. Huang, S. X. Mao, T. Zhu and J. Y. Huang, ACS Nano, 2012, 6, 1522–1531 CrossRef CAS PubMed.
- J. L. Zang and Y. P. Zhao, Int. J. Eng. Sci., 2012, 61, 156–170 CrossRef CAS PubMed.
- S. W. Lee, M. T. McDowell, L. A. Berla, W. D. Nix and Y. Cui, Proc. Natl. Acad. Sci. U. S. A., 2012, 109, 4080–4085 CrossRef CAS PubMed.
- M. J. Chon, V. A. Sethuraman, A. McCormick, V. Srinivasan and P. R. Guduru, Phys. Rev. Lett., 2011, 107, 045503 CrossRef CAS.
- X. Xia, P. Liu, M. W. Verbrugge, H. Haftbaradaran and H. J. Gao, J. Power Sources, 2011, 196, 1409–1416 CrossRef PubMed.
- J. C. Li, A. K. Dozier, Y. C. Li, F. Q. Yang and Y. T. Cheng, J. Electrochem. Soc., 2011, 158, A689–A694 CrossRef CAS.
- M. Pharr, Z. G. Suo and J. J. Vlassak, Nano Lett., 2013, 13, 5570–5577 CrossRef CAS.
- T. K. Bhandakkar and H. J. Gao, Int. J. Solids Struct., 2010, 47, 1424–1434 CrossRef CAS PubMed.
- T. K. Bhandakkar and H. J. Gao, Int. J. Solids Struct., 2011, 48, 2304–2309 CrossRef CAS PubMed.
- K. J. Zhao, M. Pharr, Q. Wan, W. L. Wang, E. Kaxiras, J. J. Vlassak and Z. G. Suo, J. Electrochem. Soc., 2012, 159, A1–A6 CrossRef PubMed.
- R. Grantab and V. B. Shenoy, J. Electrochem. Soc., 2012, 159, A584–A591 CrossRef CAS PubMed.
- Y. F. Gao and M. Zhou, J. Power Sources, 2013, 230, 176–193 CrossRef CAS PubMed.
- A. F. Bower and P. R. Guduru, Modell. Simul. Mater. Sci. Eng., 2012, 20, 045004 CrossRef.
- L. Q. Chen, Annu. Rev. Mater. Res., 2002, 32, 113–140 CrossRef CAS.
- L. Q. Chen and W. Yang, Phys. Rev. B: Condens. Matter Mater. Phys., 1994, 50, 15752–15756 CrossRef CAS.
- W. Lu and Z. G. Suo, J. Mech. Phys. Solids, 2001, 49, 1937–1950 CrossRef.
- Y. U. Wang, Y. M. Jin, A. M. Cuitino and A. G. Khachaturyan, Acta Mater., 2001, 49, 1847–1857 CrossRef CAS.
- I. S. Aranson, V. A. Kalatsky and V. M. Vinokur, Phys. Rev. Lett., 2000, 85, 118–121 CrossRef CAS.
- A. Karma, D. A. Kessler and H. Levine, Phys. Rev. Lett., 2001, 87, 045501 CrossRef CAS.
- A. Karma and A. E. Lobkovsky, Phys. Rev. Lett., 2004, 92, 245510 CrossRef.
- V. Hakim and A. Karma, J. Mech. Phys. Solids, 2009, 57, 342–368 CrossRef CAS PubMed.
- C. Miehe, M. Hofacker and F. Welschinger, Comput. Methods Appl. Mech. Eng., 2010, 199, 2765–2778 CrossRef PubMed.
- C. Miehe, F. Welschinger and M. Hofacker, J. Mech. Phys. Solids, 2010, 58, 1716–1740 CrossRef CAS PubMed.
- M. Hofacker and C. Miehe, Int. J. Numer. Meth. Eng., 2013, 93, 276–301 CrossRef.
- V. I. Marconi and E. A. Jagla, Phys. Rev. E: Stat., Nonlinear, Soft Matter Phys., 2005, 71, 036110 CrossRef CAS.
- R. Spatschek, M. Hartmann, E. Brener and H. M. Krumbhaar, Phys. Rev. Lett., 2006, 96, 015502 CrossRef.
- R. Spatschek, C. M. Gugenberger, E. Brener and B. Nestler, Phys. Rev. E: Stat., Nonlinear, Soft Matter Phys., 2007, 75, 066111 CrossRef CAS.
- M. Fleck, D. Pilipenko, R. Spatschek and E. A. Brener, Phys. Rev. E: Stat., Nonlinear, Soft Matter Phys., 2011, 83, 046213 CrossRef CAS.
- G. K. Singh, G. Ceder and M. Z. Bazant, Electrochim. Acta, 2008, 53, 7599–7613 CrossRef CAS PubMed.
- F. Q. Yang, Mater. Sci. Eng., A, 2005, 409, 153–159 CrossRef PubMed.
- B. W. Sheldon, S. K. Soni, X. C. Xiao and Y. Qi, Electrochem. Solid-State Lett., 2012, 15, A9–A11 CrossRef CAS PubMed.
- Y. C. Fung and P. Tong, Classical and Computational Solid Mechanics, World Scientific, Singapore, 2001 Search PubMed.
- H. Haftbaradaran, X. C. Xiao, M. W. Verbrugge and H. J. Gao, J. Power Sources, 2012, 206, 357–366 CrossRef CAS PubMed.
- T. D. Lee, T. Goldenberg and J. P. Hirth, Metall. Trans. A, 1979, 10, 199–208 CrossRef.
- A. Taha and P. Sofronis, Eng. Fract. Mech., 2001, 68, 803–837 CrossRef.
- Y. H. Wang, Y. He, R. J. Xiao, H. Li, K. E. Aifantis and X. J. Huang, J. Power Sources, 2012, 202, 236–245 CrossRef CAS PubMed.
| This journal is © the Owner Societies 2015 |

