
 Open Access Article
 This Open Access Article is licensed under a
 Creative Commons Attribution 3.0 Unported Licence
A straightforward implementation of in situ solution electrochemical 13C NMR spectroscopy for studying reactions on commercial electrocatalysts: ethanol oxidation
L.
Huang
ab,
E. G.
Sorte
a,
S.-G.
Sun
*b and
Y. Y. J.
Tong
*a
aDepartment of Chemistry, Georgetown University, 37th & O Streets, NW, Washington, DC 20057, USA. E-mail: yyt@georgetown.edu
bDepartments of Chemistry and State Key Laboratory for Physical Chemistry of Solid Surfaces, Xiamen University, Xiamen 361005, P. R. China. E-mail: sgsun@xmu.edu.cn
First published on 2nd April 2015
Abstract
Identifying and quantifying electrocatalytic-reaction-generated solution species, be they reaction intermediates or products, are highly desirable in terms of understanding the associated reaction mechanisms. We report herein a straightforward implementation of in situ solution electrochemical 13C NMR spectroscopy for the first time that enables in situ studies of reactions on commercial fuel-cell electrocatalysts (Pt and PtRu blacks). Using ethanol oxidation reaction (EOR) as a working example, we discovered that (1) the complete oxidation of ethanol to CO2 only took place dominantly at the very beginning of a potentiostatic chronoamperometric (CA) measurement and (2) the PtRu had a much higher activity in catalysing oxygen insertion reaction that leads to acetic acid.
Solution NMR spectroscopy is probably the method of choice in identifying and quantifying reaction-related species in mechanistic studies of homogeneous reactions.1 However, it has rarely been applied to delineating electrochemically-driven reactions due largely to the intrinsic incompatibility between conventional NMR detection using inductive coils and the electrical conduction necessary for electrochemical (EC) reactions.2,3 Still, there has been a continuous effort over the last decade to bring this powerful analytical method into play in studying EC redox reactions in situ.4–8 In order to overcome the aforementioned detection incompatibility and also maintain the high-resolution feature of solution NMR, sophisticated designs of EC-NMR cells have been proposed in which deposition of cylindrically symmetric ultrathin (<100 nm) Au film as the working electrode is a prerequisite.5,8 While the feasibility of such EC-NMR cells has been demonstrated, their configurations are not easily amenable to studying electrocatalysis in which the focus is on the performance of electrocatalysts as the working electrode. Recently, while still limited to 1H NMR, Dunsch and co-workers developed a rather simple EC-NMR cell that used carbon fibres as the working electrode.7 We report herein our adaptation of the EC-NMR cell for the first in situ solution 13C NMR study of ethanol oxidation reaction (EOR) on commercial (Johnson Matthey or J-M) Pt black and PtRu black electrocatalysts by taking advantage of the fact that the electrocatalysts can be easily loaded onto the carbon fibres by simple drop-casting or a dip-adsorption process. We hope that this simple advancement will encourage the broader use of in situ EC-NMR in electrochemistry in general and electrocatalysis in particular.
Fig. 1 shows the schematic of the EC-NMR cell that we adapted based on a 10 mm standard commercial NMR tube used in routine solution NMR measurements. It consisted of a carbon fiber bundle as the working electrode (WE), a Pt gauze as the counter electrode (CE) and a thin chlorinated silver (Ag/AgCl) wire as the quasi-reference electrode (RE). The carbon fiber or Pt gauze was adjoined to a capillary-housed copper wire by conductive adhesive. The carbon-fiber-protruding end of the capillary was sealed by epoxy resin so that only carbon fiber could contact the electrolyte. The other end of the capillary was simply wrapped with poly(tetrafluoroethylene) (PTFE) tape to hold the connecting copper wire. The chlorinated Ag/AgCl quasi-RE was made by immersing a silver wire that was pre-cleaned in an aqua regia solution in a saturated KCl solution. To quantify the reaction species, we used an internal reference consisting of a short capillary sealed with 1-13C labeled octanethiol inside as indicated in Fig. 1. Its integrated NMR signal at 23 ppm was used to normalize all the NMR signals reported here. Radio frequency chokes were used to isolate NMR detection from any electrical interference using the potentiostat (VoltaLab PGZ100, Radiometer).
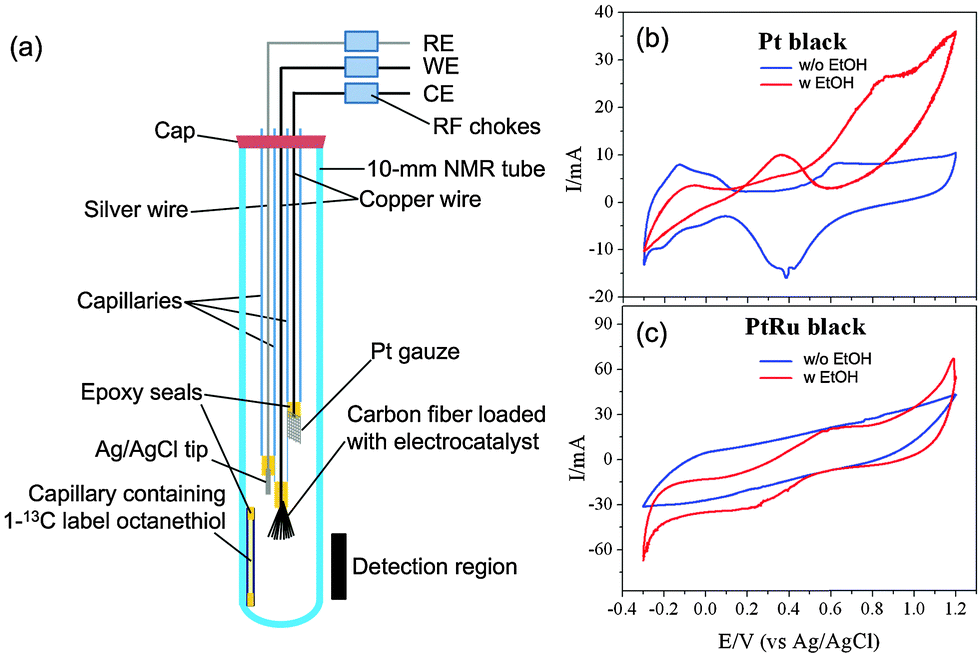 | ||
| Fig. 1 (a) Schematic of the EC-NMR cell adapted from Dunsch et al.'s work. The cell is based on a standard 10 mm commercial NMR tube used in high-resolution solution NMR so it can be used directly with a routine solution NMR spectrometer. RF chokes are used to isolate the NMR detection from the EC potentiostat. The position of the carbon fibre bundle as the working electrode is critically important to preserve the original Q-factor of the NMR probe. (b) Normal (blue) and EOR (red) CVs on the activated Pt black. (c) Normal (blue) and EOR (red) CVs on the activated PtRu black. | ||
As a testing case of the above setup, we investigated the EOR on two different electrocatalysts, J-M Pt black and PtRu black, comparatively. All NMR measurements were carried out on a hybrid Bruker/Tecmag 300 MHz spectrometer using a standard 10 mm probe. 13C-labeled ethanol CH313CH2OH (99%, Cambridge Isotope) was used in the study. The normal Q-factor of the probe is ∼75, which gave a full width at half maximum (FWHM) of ∼8 Hz for the 13C-labeled ethanol peak at 58 ppm. We found that the Q-factor was very sensitive to the position of the carbon fibre bundle with respect to the NMR detection coil when the EC-NMR cell was used. If the carbon fibre bundle was just above the detection coil, as shown in Fig. 1, the Q factor was not affected, so a FWHM of 8 Hz could still be obtained for the ethanol peak at 58 ppm. Lowering further the carbon fibre bundle into the detection coil, the Q-factor dropped dramatically to ∼25, leading to lower sensitivity, making 13C NMR unattainable. We used the former position for all the NMR measurements reported here; 128 scans were acquired for signal averaging for a given 13C NMR spectrum using a standard proton-decoupling pulse sequence with a repetition delay of 5 s.
0.1 mL of the Pt or PtRu black suspension (20 mg mL−1) was drop-casted onto the carbon fibre bundle and was then air-dried. Before any NMR measurements, the electrocatalyst adsorbed onto the carbon fibre bundle was activated by holding the electrode potential at −0.5 V and 0.8 V (vs. Ag/AgCl wire) for 5 s alternatively for 10 cycles in a 0.1 M HClO4 + 0.1 M CH3CH2OH solution. Fig. 1b and c present the normal (blue curve) and EOR (red curve) cyclic voltammograms (CVs) of the activated samples. After the activation, the original ethanol-containing electrolyte was exchanged to a 0.1 M HClO4 + 0.1 M CH313CH2OH solution for NMR measurements. Fig. 2 compares the NMR spectra obtained before (blue) and after (red) the EOR on Pt black (Fig. 2a) and PtRu black (Fig. 2b). In agreement with what has been known previously,6 two EOR-generated species were observed: acetic acid (CH313COOH) at 177 ppm and acetaldehyde (CH313CHO) at 208 ppm. As can be seen from the spectra, the EOR on the PtRu black produced a much higher percentage of acetic acid than on the Pt black while the latter produced a higher percentage of acetaldehyde, which showcased different reaction mechanisms on these two different electrocatalysts.
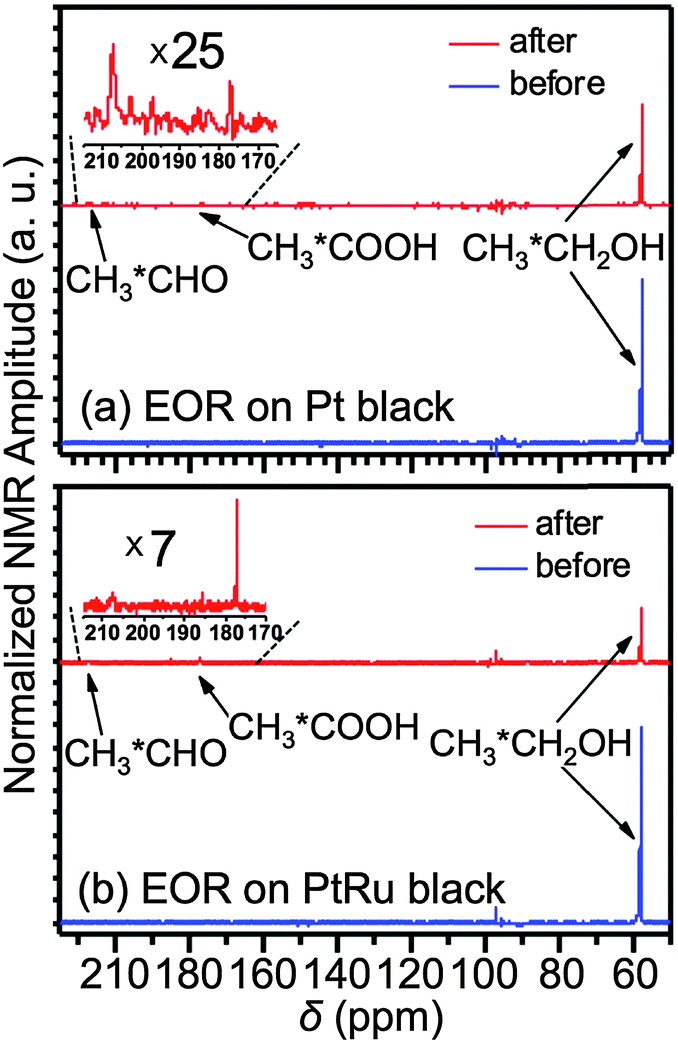 | ||
| Fig. 2 In situ solution 13C NMR spectra obtained before (blue) and after (red) EOR on the Pt black (a) and PtRu black (b). The insets are the zoom-in spectra of acetaldehyde (208 ppm) and acetic acid (177 ppm) produced during the EOR. | ||
Further mechanistic details were gleaned by following the EOR on both samples for 24 h by the in situ solution EC 13C NMR spectroscopy. Fig. 3a shows the chronoamperometric (CA) currents recorded over 24 h during the NMR measurements of the EOR at 0.2 V (vs. Ag/AgCl wire) on the Pt and PtRu blacks respectively (The spikes were caused by returning to 0.2 V after potential jumps to −0.5 V for 5 s to replenish the surface.) The CA currents indicate that the EOR activity was higher on the PtRu than on the Pt black. Fig. 3b and c present the NMR measured concentration changes of the three species, ethanol (black squares), acetic acid (red circles) and acetaldehyde (blue triangles), over 24 h by normalizing the peak integrals with that of the internal standard. No other species were observed during that period, which is in contrast with recent solution NMR measurements of ethanol fuel cell exhausts in which ethane-1,1-diol was observed during electrode-potential dependent experiments.6
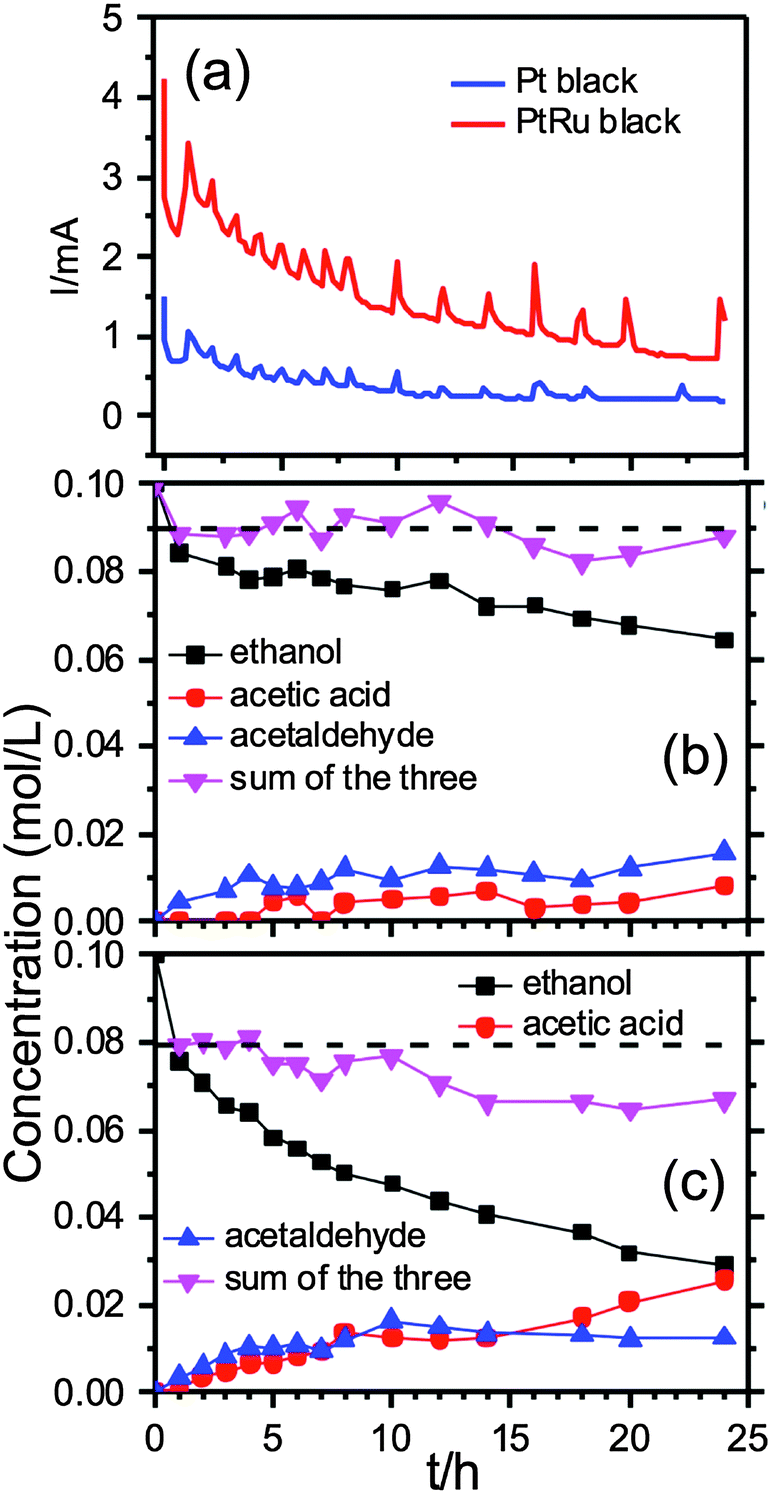 | ||
| Fig. 3 (a) The CA currents at 0.2 V (vs. Ag/AgCl wire) recorded during the in situ13C NMR measurements of EOR on the Pt black (blue) and the PtRu black (red). The spikes were caused by returning to 0.2 V after potential jumps to −0.5 V for 5 s to replenish the surface. (b)/(c) 13C NMR measured concentrations of ethanol (black squares), acetic acid (red circles) and acetaldehyde (blue triangles) during the EOR on the Pt black (b) and the PtRu black (c) over a period of 24 h. The inversed pink triangles are the remaining total carbon content (RTCC). | ||
More specifically, Fig. 3b shows that the EOR on the Pt black produced more acetaldehyde than acetic acid over the entire 24 h period. However, this is not the case for the EOR on the PtRu black: the production of acetaldehyde was only slightly higher than acetic acid over the first 7 h, then the amounts of the two species became equal over the next 7 to 8 h, and finally acetic acid took over in the remaining time.
The inversed pink triangles show the remaining total carbon content (RTCC) in the solution as measured with the 13C NMR by adding ethanol, acetic acid and acetaldehyde together. It is intriguing to observe that the RTCC in solution for the EOR on the Pt black was more or less constant after the first hour, as indicated by the horizontal dashed line in Fig. 3b. As the missing carbon content indicates presumably the production of volatile CO2, the data suggest that the complete oxidation of ethanol to CO2 on the Pt black (∼10%) only took place during the first hour of the reaction. The ensuing current came almost exclusively from reactions to acetaldehyde and acetic acid.
For the EOR on the PtRu black, the activity for complete oxidation of ethanol to CO2 was also highest at the beginning hour of the reaction (∼20% conversion to CO2 as indicated by the horizontal dashed line). But it continued, notwithstanding at a much slower rate, (∼10% conversion to CO2) until the ∼ 14 h mark after which the RTCC in solution became constant, again suggesting no further CO2 generation. Overall, the ethanol conversion rate to other species was much higher, i.e., more active, on the PtRu black (∼70%) than on the Pt black (∼30%), which is in good agreement with the CA data in Fig. 3a. It appears that the PtRu is much better than the Pt black in catalysing oxygen insertion reaction that leads to acetic acid.
In summary, we have demonstrated the feasibility of a rather easy and versatile approach to realize in situ solution EC-NMR spectroscopy of electrocatalysis by adapting Dunsch et al.'s work7 and using EOR on commercial Pt and PtRu black as a working example to showcase the first in situ solution 13C NMR study of the relevant electrocatalysis. The latter not only shows clearly mechanistic differences in the EOR on the Pt black vs. the PtRu black, but also reveals for the first time that the complete ethanol oxidation to CO2 on these two electrocatalysts only took place dominantly at the very beginning of a potentiostatic CA reaction, a reaction mode that is most relevant to a fuel cell setting and warrants further detailed investigations. However, almost no CO2 generation beyond the first hour of the EOR is likely caused by the observation that the initially active sites for C–C bond breaking were blocked by the EOR-generated poisonous species, such as adsorbed CO, as the EOR continued.9 As to the relatively higher CO2 production and oxygen insertion reaction rate observed on the PtRu, they could be rationalized by the appearance of the Pt–Ru boundary sites responsible for more C–C bond breaking and the more oxophilic Ru for facilitating oxygen insertion reaction respectively.10,11
Technically, all the components needed to build the EC-NMR cell are readily available so its construction should be amenable to a generic chemistry research lab. Moreover, the NMR measurements can be carried out on any walk-in solution NMR spectrometer that should be available in most if not all research universities. We therefore expect that the demonstrated in situ solution EC-NMR approach should be of interest to many practitioners in the field and should provide molecular level information that complements nicely to that obtainable by in situ differential EC mass spectrometry, IR and Raman spectroscopy in unraveling important reaction mechanisms in electrocatalysis.
The work in the Tong lab was supported by a grant from DOE-BES (DE-FG02-07ER15895). ES also thanks financial support from the Georgetown College and Graduate School. LH was an exchange PhD student from SGS's lab where the research is supported by the NSFC (21229301 and 21321062).
Notes and references
- E. M. Viviente, P. S. Pregosin and D. Schott, in Mechanisms in Homogeneous Catalysis. A Spectroscopic Approach, ed. B. Heaton, WILEY-VCH Verlag GmbH & Co. KGaA, Weinhein, 2005, pp. 1–80 Search PubMed.
- Y. Y. Tong, in In-Situ Spectroscopic Studies of Adsorption at Electrode and Electrocatalysis, ed. S.-G. Sun, P. A. Christensen and A. Wieckowski, 2007, pp. 441–469 Search PubMed.
- O. H. Han, Prog. NMR Spectr., 2013, 72, 1–41 CrossRef CAS PubMed.
- R. Boisseau, U. Bussy, P. Giraudeau and M. Boujtita, Anal. Chem., 2015, 87, 372–375 CrossRef CAS PubMed.
- X. Zhang and J. W. Zwanziger, J. Magn. Reson., 2011, 208, 136–147 CrossRef CAS PubMed.
- I. Kim, O. H. Han, S. A. Chae, Y. Paik, S.-H. Kwon, K.-S. Lee, Y.-E. Sung and H. Kim, Angew. Chem., Int. Ed., 2011, 50, 2270–2274 CrossRef CAS PubMed.
- S. Klod, F. Ziegs and L. Dunsch, Anal. Chem., 2009, 81, 10262–10267 CrossRef CAS PubMed.
- R. D. Webster, Anal. Chem., 2004, 76, 1603–1610 CrossRef CAS.
- L. W. H. Leung and M. J. Weaver, J. Phys. Chem., 1988, 92, 4019–4022 CrossRef CAS.
- D. J. Chen, S. G. Sun and Y. Y. J. Tong, Chem. Commun., 2014, 50, 12963–12965 RSC.
- N. Fujiwara, K. A. Friedrich and U. Stimming, J. Electroanal. Chem., 1999, 472, 120–125 CrossRef CAS.
| This journal is © The Royal Society of Chemistry 2015 |