Simultaneous separation and sensitive detection of four β2-agonists in biological specimens by CE-UV using a field-enhanced sample injection method
Cheng
Chen
,
Lingchen
Meng
,
Meixian
Li
and
Zhiwei
Zhu
*
Beijing National Laboratory for Molecular Sciences, College of Chemistry and Molecular Engineering, Peking University, Beijing 100871, P. R. China. E-mail: zwzhu@pku.edu.cn; Fax: +86-10-62751708; Tel: +86-10-62757953
First published on 14th November 2014
Abstract
A rapid, sensitive and cost-effective CE-UV method has been developed for the simultaneous separation and sensitive determination of clenbuterol, salbutamol, ractopamine and fenoterol in pig blood and human urine samples. Field-enhanced sample injection (FESI) as an effective online concentration technique was applied to improve the detection sensitivity of β2-agonists. Several factors, such as the concentration and pH of the background solution, sample matrix, injection time and voltage, and the length of the water plug, were systematically optimized. Under the optimum conditions, the detection limits of the β2-agonists range from 2.7 to 7.2 nM, which were improved nearly 2000 times by CE-UV compared with conventional methods, except for fenoterol. Eventually, the proposed method was successfully applied to the analysis of spiked blood and urine samples with good recoveries, which provides a novel method to monitor the illegal use of β2-agonists in athletes and livestock.
1. Introduction
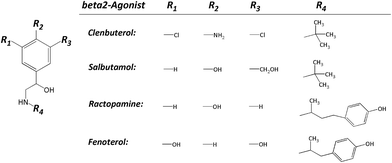
Clenbuterol (Clen), salbutamol (Sal), ractopamine (Rac) and fenoterol (Fen) (their structures shown in Fig. 1) are members of β2 adrenergic agonists, which have been used by sufferers of breathing disorders as a decongestant and bronchodilator.1 People with chronic breathing disorders such as asthma use drugs like β2 adrenergic agonists to make breathing easier.2 The β2-agonist also causes an increase in aerobic capacity, central nervous system stimulation, blood pressure, and oxygen transportation.3 As it is, athletes use β2-agonists as performance-enhancing drugs which has been prohibited by the World Anti-Doping Agency since 2004. In addition, β2-agonists have also been used as a produced-animal feed because they can speed up muscle building and fat burning. However, when people consume these produced-animals for a long time, the β2-agonists would be accumulated in the human body which could cause vomiting, palpitations, tachycardia, and myocardial infarction, serious enough to cause death.4 In fact, any kind of β2-agonist was rigorously prohibited from being used as a growth promoter for produced-animals in China and the European Union. Only trace of ractopamine is permitted in pork or beef in the USA, Japan, Australia and Canada, usually less than 30 ppb.5 Hence, there is an increasing need to develop simple, accurate and quantitative techniques to monitor β2-agonists in biological specimens either in human urine or animal blood.To date, different analytical methods have been reported for β2-agonist determination. Conventional chromatographic methods involving the use of a mass detector have been widely applied for the confirmation and precise quantitation of β2-agonists, including CE-MS,6,7 HPLC-MS8–10 and GC-MS.11,12 ELC-FIA,13 CE-ECL14 and ELISA15 also have been utilized. Although the determination of β2-agonists by these methods is promising, most of them have been associated with several shortcomings, such as complicated pre-purification procedures, expensive equipment and costly reagents, which finally limit their wider applications.16 Therefore, more conveniently operated, cost-and-time effective methods are still highly required to be developed for the analysis of β2-agonists.
CE-UV has been considered as a fast, efficient and cost-effective analytical separation method, and it has already become a powerful analytical technique in pharmaceutical and biomedical aspects. Unfortunately, due to the small loaded sample volume and the narrow optical path length, the sensitivity is relatively low when used as an online UV detector. Online sample pre-concentration is an efficient approach to enhance the sensitivity for trace analysis such as field-enhanced sample injection (FESI),17,18 field amplified sample stacking (FASS)19 and large-volume sample stacking (LVSS).20
As shown in Fig. 2, FESI is based on the fact that each given analyte presents a different velocity either in the high-conductivity background electrolyte (BGS) zone or in the low-conductivity sample zone (water). Due to the presence of a preinjected short plug of low conductivity (diluted buffer or water) at the capillary inlet, the analyte moves rapidly from the sample vial into the capillary at a higher electric field. Once they reach the high conductivity BGS, their velocity slows down significantly where fast attenuation of the electric field strength occurs. Thus it will result in a stacking process at the boundary between the sample matrix and BGS.21 In this work, we developed a method to separate and detect four kinds of β2-agonists rapidly and conveniently with the advantages of low detection limit, fast analysis time and wide linear range.
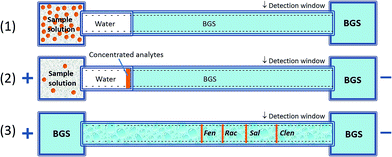 | ||
| Fig. 2 Schematic diagram of a preconcentration mechanism with FESI. (1) Pressurized injection of water plug; (2) field-enhanced sample injection; (3) separation after injection. | ||
2. Materials and methods
2.1. Reagents
Clenbuterol hydrochloride, salbutamol, ractopamine hydrochloride and fenoterol hydrochloride were purchased from Sigma. The water used was the commercial purified water from Wahaha (Hangzhou, China). All the chemicals and reagents were of analytical grade and used without further purification.2.2. CE apparatus
All experiments were performed with a P/ACE MDQ instrument coupled with a diode-array UV detector (Beckman Coulter, USA). Instrument control and data acquisition were carried out using 32Karat software (Version 8.0). A 50.2 cm (40.0 cm from the inlet of the capillary to the detector) uncoated fused-silica capillary tubing with 50 μm i.d. and 364 μm o.d. was obtained from Polymicro Technologies (USA).2.3. CE procedure
0.30 M stock solutions were prepared by dissolving Clen, Sal, Rac and Fen standards in water and stored in the refrigerator at 4 °C. They were diluted with water to the desired concentration before using. Prior to the experiment, new capillaries were pre-treated by sequentially rinsing with 1.0 M HCl for 10 min, then with water for 10 min, and finally with running buffer for 15 min. Between each run, the capillary was flushed with running buffer for 3 min so as to maintain an active and reproducible inner surface. The voltage applied in the separation was +20 kV. The capillary was held at 25 °C and the wavelength of the UV detector was maintained at 200 nm. Injection was performed electrokinetically after a short water plug in FESI. The injection voltage, injection time and the length of the water plug were studied and optimized in this work. All solutions were filtered through a 0.22 μm pore polytetrafluoroethylene membrane filter before injection to capillary. All measurements were carried out at least three times.2.4. Preparation of the sample
The whole blood samples of pigs were collected from slaughterhouses in Lanzhou, China, followed by centrifugation at 8000 rpm for 10 min, then the supernatant sample was collected and diluted 10-fold with water. In order to maintain a lower ionic strength of the sample matrix, no anticoagulant was added into the samples. The urine samples were collected from one of the authors and the preparation procedure was similar to that of blood samples. The as-prepared samples should be tested within 24 h. All experiments were performed in compliance with the relevant laws and institutional guidelines, and were approved by the College of Chemistry and Molecular Engineering of Peking University.3. Results and discussion
3.1. The effect of the pH of buffer
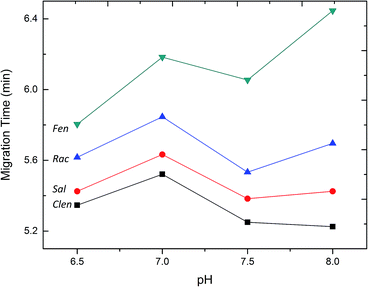
At the very beginning, the separation conditions were conventionally investigated by capillary zone electrophoresis (CZE). Since the background electrolytes, including their pH and concentration, have a significant impact on the efficiency, resolution and sensitivity of FESI-CE separation, the effect of running buffer was firstly investigated. The four mixed β2-agonist samples were introduced into the capillary at a low pressure of 0.5 psi for 5 s in the optimization experiment. As shown in Fig. 1, these four β2-agonists possess a common β-hydroxyamino group on the side chain of aniline (Clen) or phenol (Sal, Rac and Fen), but are differentiated from each other by varied substituents on the aryl moiety. The more phenolic hydroxyl groups would lead to more negative charges of the compound, and the alcoholic hydroxyl group like R3 in Sal is relatively weak. Obviously, the molecular weight is also a factor that cannot be neglected. So of the four β2-agonists Clen runs fastest in the capillary, followed by Sal, Rac and Fen.Fig. 3 shows the separation of the four β2-agonists under different pH values in the range of 6.5–8.0 in phosphate buffer. The result indicated that the separation resolution of the four samples was improved with the increase of buffer pH from 6.5 to 8.0. Nevertheless, a higher pH value would result in less buffering capacity which finally influenced the reproducibility of the migration time of the peaks. When the borate buffer was tried under the pH from 8.0 to 10.0, a system peak overlapped some of the sample peaks, which should be due to the interaction between the β2-agonist with borate. So the best resolution was obtained under a pH of 8.0 in phosphate buffer.
3.2. The effect of the concentration of buffer
The concentration of phosphate buffer was also optimized in our study. Fig. 4 shows that various separations were performed by varying the concentration of phosphate buffer from 50 to 100 mM. Increasing the ionic strength resulted in an increased analysis time and the separation resolutions were better at a higher concentration. This could be explained by the fact that the loading capacity of the background electrolytes increased together with the concentration of phosphate buffer. It was found that a higher concentration would give rise to Joule heating which caused the peak broadening. Considering that the peak broadening in FESI would affect the sensitivity in our study, 50 mM phosphate buffer at pH 8.0 was thus used for subsequent analyses. The results of CZE method regression analysis on calibration and the detection limits are summarized in Table 1.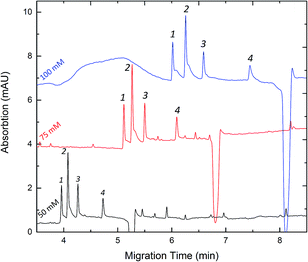 | ||
| Fig. 4 Effect of the concentration of buffer on the migration time and separation resolution. Experimental conditions: pH 8.0 phosphate buffer. Peak identities: 1-Clen; 2-Sal; 3-Rac; 4-Fen. Other conditions are the same as in Fig. 3. | ||
| Component | Calibration curvea | Correlation coefficient | RSD (%, n = 5) | Detection limit (μM) | Linear range (μM) | |
|---|---|---|---|---|---|---|
| Migration time | Peak area | |||||
| a y: peak area, mAu s; x: concentration of the analyte, μM. | ||||||
| Clen | y = 61.92x + 20.8 | 0.9997 | 0.30 | 5.2 | 13 | 30–600 |
| Sal | y = 167.9x + 168.3 | 0.9997 | 0.23 | 6.7 | 7.2 | 15–300 |
| Rac | y = 103.3x − 124.8 | 0.9983 | 0.31 | 4.9 | 5.3 | 15–300 |
| Fen | y = 355.5x − 244.4 | 0.9991 | 0.48 | 8.5 | 2.7 | 15–300 |
3.3. Injection parameters
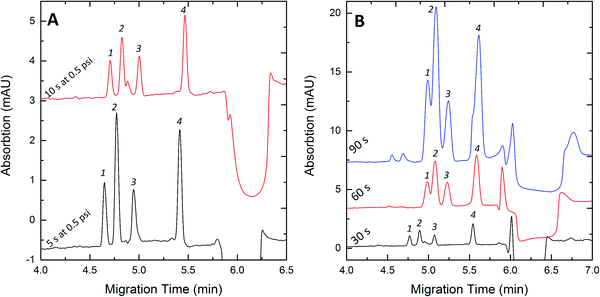
FESI as an on-line concentration method was investigated to improve the detection sensitivities of the four β2-agonists. The parameters affecting the concentration efficiency of FESI, including the sample matrix, injection time, injection voltage and the length of the water plug, were systematically investigated.The effect of electrokinetic injection voltage on peak heights was studied. Actually, the injection voltage has a similar effect on the efficiency of stacking and there is a relationship between the two factors which can lead to different experimental results. So we adjusted the two parameters simultaneously in order to study which would cause an additional impact on the sample stacking efficiency. The peak heights were enhanced with increase of the injection voltage from +1 to +15 kV at different injection times (30 s to 90 s). The peak broadening increased when the electrokinetic injection voltage increased above +10 kV. Based on an overall consideration of the two injection factors, 60 s under +10 kV injection voltage was chosen as the optimum injection time. The results of regression analysis on calibration, detection limits and enhancement factors with FESI are summarized in Table 2. It was observed that the detection limit with FESI-based stacking was greatly enhanced as compared with those in normal CZE. Moreover, as shown in Table 3, compared with the reported studies that employed the UV detector,23–25 the detection limit for β2-agonists in this study was 0.75–2 μg mL−1 (about 3–8 μM); the sensitivity is greatly improved by at least 3 orders of magnitude for the β2-agonists in our study, compared to a sensitivity value of 0.1–0.5 ng mL−1 (about 0.5–2 nM) in the latest reported work using CE-ESI/MS which employed field-amplification sample stacking (FASS) as an online concentration method.7
| Component | Calibration curvea | Correlation coefficient | RSD (%, n = 5) | Detection limit (nM) | Linear range (nM) | Enhancement factor | |
|---|---|---|---|---|---|---|---|
| Migration time | Peak area | ||||||
| a y: peak area, mAu s; x: concentration of analyte, nM. | |||||||
| Clen | y = 172x + 1150 | 0.9969 | 0.41 | 8.2 | 7.2 | 10–300 | 1800 |
| Sal | y = 892x + 4680 | 0.9984 | 0.28 | 4.5 | 3.6 | 5–150 | 2000 |
| Rac | y = 781x + 927 | 0.9991 | 0.64 | 6.9 | 2.7 | 5–150 | 1900 |
| Fen | y = 768x + 43.3 | 0.9997 | 0.53 | 5.3 | 5.3 | 10–300 | 600 |
| Method | Detection limit (nM) | |||
|---|---|---|---|---|
| Clen | Sal | Rac | Fen | |
| CE-UV24 | 1600 | 2100 | — | 1300 |
| CE-UV26 | — | 17![[thin space (1/6-em)]](https://www.rsc.org/images/entities/char_2009.gif) 000 000 |
— | — |
| CE-EC27 | 320 | 710 | 300 | — |
| CE-ECL14 | 260 | 84 | — | — |
| CE-ECL28 | 81 | 340 | — | — |
| CE-MS7 | 0.25 | 0.41 | — | — |
| This method | 7.2 | 3.6 | 2.7 | 5.3 |
3.4. Applications
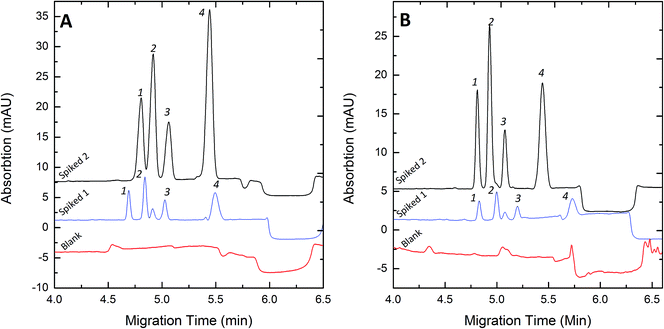
To evaluate the FESI technique, the proposed methods were applied to the analysis of pig blood and human urine sample. Thanks to its high sensitivity, we could dilute the sample solutions 1000-fold with deionized water before injection in order to decrease the ionic strength of the sample matrix. Typical electropherograms for the analysis of spiked samples are illustrated in Fig. 6. The quantitative results and the recoveries of this method are listed in Table 4.| Sample | Component | Original (nM) | Added (nM) | Found (nM) | Recovery (%) |
|---|---|---|---|---|---|
| Blood | Clen | — | 60 | 58 | 97 |
| Sal | — | 30 | 34 | 113 | |
| Rac | — | 30 | 28 | 93 | |
| Fen | — | 60 | 61 | 102 | |
| Urine | Clen | — | 40 | 42 | 105 |
| Sal | — | 20 | 18 | 90 | |
| Rac | 40 | 44 | 110 | ||
| Fen | 20 | 23 | 115 |
4. Concluding remarks
A rapid, simple and sensitive CE-FESI method has been developed for the detection of β2-agonists. Compared to CZE and other reported methods, the proposed method has much higher stacking efficiency for the four β2-agonists with an extremely low detection limit ranging from 2.7 to 7.2 nM. The results of this study show a great potential for this method as a useful tool for the rapid and sensitive determination of β2-agonists in pig blood and human urine samples. Meanwhile, it shows that the utilization of the cheap and simple CE-UV technique in the fields of public-health risks with regard to food and sports is quite promising.Acknowledgements
This work was supported by the National Natural Science Foundation of China (NSFC, no. 21175006, 21335001 and 21475002).Notes and references
- J. M. Weiler and E. O. Meltzer, Ann. Allergy, Asthma, Immunol., 1997, 79, 327–332 CrossRef CAS.
- I. D. Prather, D. E. Brown, P. North and J. R. Wilson, Med. Sci. Sports Exercise, 1995, 27, 1118–1121 CAS.
- A. Polettini, J. Chromatogr. B: Biomed. Sci. Appl., 1996, 687, 27–42 CrossRef CAS.
- G. Brambilla, T. Cenci, F. Franconi, R. Galarini, A. Macri, F. Rondoni, M. Strozzi and A. Loizzo, Toxicol. Lett., 2000, 114, 47–53 CrossRef CAS.
- F. Ramos, I. Silveira, J. M. Silva, J. Barbosa, C. Cruz, J. Martins, C. Neves and C. Alves, Am. J. Med., 2004, 117, 362 CrossRef.
- S. L. Nilsson, C. Andersson, P. J. R. Sjoberg, D. Bylund, P. Petersson, M. Jornten-Karlsson and K. E. Markides, Rapid Commun. Mass Spectrom., 2003, 17, 2267–2272 CrossRef CAS.
- Y. He, X. Li, P. Tong, M. H. Lu, L. Zhang and G. N. Chen, Talanta, 2013, 104, 97–102 CrossRef CAS.
- J. Pleadin, A. Vulic, N. Persi and N. Vahcic, Meat Sci., 2010, 86, 733–737 CrossRef CAS.
- F. Badoud, D. Guillarme, J. Boccard, E. Grata, M. Saugy, S. Rudaz and J. L. Veuthey, Forensic Sci. Int., 2011, 213, 49–61 CrossRef CAS.
- Y. W. You, C. E. Uboh, L. R. Soma, F. Y. Guan, X. Q. Li, Y. Liu, J. A. Rudy, J. W. Chen and D. Tsang, J. Chromatogr. A, 2011, 1218, 3982–3993 CrossRef CAS.
- L. M. He, Y. J. Su, Z. L. Zeng, Y. H. Liu and X. H. Huang, Anim. Feed Sci. Technol., 2007, 132, 316–323 CrossRef CAS.
- L. Zhao, J. A. Zhao, W. G. Huangfu and Y. L. Wu, Chromatographia, 2010, 72, 365–368 CAS.
- C. A. Lindino and L. O. S. Bulhoes, Talanta, 2007, 72, 1746–1751 CrossRef CAS.
- Y. Bao, F. Yang and X. R. Yang, Electroanalysis, 2012, 24, 1597–1603 CrossRef CAS.
- W. Haasnoot, P. Stouten, A. Lommen, G. Cazemier, D. Hooijerink and R. Schilt, Analyst, 1994, 119, 2675–2680 RSC.
- M. K. Parr, G. Opfermann and W. Schanzer, Bioanalysis, 2009, 1, 437–450 CrossRef CAS.
- Z. Liu, K. Otsuka and S. Terabe, Electrophoresis, 2001, 22, 3791–3797 CrossRef CAS.
- P. Pantuckova, P. Kuban and P. Bocek, J. Chromatogr. A, 2013, 1299, 33–39 CrossRef CAS.
- S. Redweik, C. Cianciulli, M. Hara, Y. H. Xu and H. Watzig, Electrophoresis, 2013, 34, 1812–1819 CrossRef CAS.
- Y. He and H. K. Lee, Anal. Chem., 1999, 71, 995–1001 CrossRef CAS.
- M. R. Pourhaghighi, J. M. Busnel and H. H. Girault, Electrophoresis, 2011, 32, 1795–1803 CrossRef CAS.
- Y. Jin, L. C. Meng, M. X. Li and Z. W. Zhu, Electrophoresis, 2010, 31, 3913–3920 CrossRef CAS.
- M. Mazzarino, X. de la Torre, F. Mazzei and F. Botre, J. Sep. Sci., 2009, 32, 3562–3570 CrossRef CAS.
- S. Sirichai and P. Khanatharana, Talanta, 2008, 76, 1194–1198 CrossRef CAS.
- S. S. Zhou, Y. Q. Wang, T. De Beer, W. R. G. Baeyens, G. T. Fei, M. Dilinuer and J. Ouyang, Electrophoresis, 2008, 29, 2321–2329 CrossRef CAS.
| This journal is © The Royal Society of Chemistry 2015 |

