Sequential detection of Fe3+ and As3+ ions by naked eye through aggregation and disaggregation of biogenic gold nanoparticles†
Somasundaram
Kaviya
and
Edamana
Prasad
*
Department of Chemistry, Indian Institute of Technology Madras, Chennai-600 036, TN, India. E-mail: pre@iitm.ac.in; Fax: +91-44-2257-4202; Tel: +91-44-2257-4232
First published on 7th November 2014
Abstract
We have synthesized and stabilized spherical, flower, urchin and polydispersed AuNPs using pomegranate (Punica granatum) peel extract. The AuNPs act as sequential sensors towards Fe3+ as well as As3+ ions. Upon addition of Fe3+ ions, the AuNPs aggregate due to the interaction between the capping agent and Fe3+ ions. The aggregation results in a color change that is visible to the naked eye, which originates from the inter-plasmon coupling of the AuNPs. Interestingly, the AuNP–Fe system disaggregates only in the presence of As3+ ions, resulting in a further color change in the visible region. The aggregation and disaggregation phenomena were examined by UV-vis spectroscopy, DLS, SEM, and TEM. The rates for the aggregation and disaggregation of the AuNP systems in the presence of the metal ions were determined. The naked eye detection limits for Fe3+ and As3+ ions were 10−7 and 10−4 M, respectively. Finally, we have demonstrated the practical application of biosynthesized AuNPs by real sample analysis.
Introduction
Size and shape selective synthesis of gold nanoparticles (AuNPs) has gained significant attention because of the wide range of applications of AuNPs in the fields of sensors,1 water purification,2 surface enhanced Raman spectroscopy (SERS),3 catalysis,4 antimicrobial research,5 and drug delivery.6 For example, spherical shaped, relatively smaller NPs were effective for catalyzing the reduction of p-nitrophenol.7 In an elegant study, Halas and co-workers have demonstrated the shape effects of gold nanosystems by comparing the release kinetics of DNA from gold nanorods and gold nanoshells. The results indicated that controlled release kinetics were obtained from the gold nanorods.8 Dong and their group reported shape dependent SERS using a gold nanowire network, nanoflower array, nanosheets and nanoflowers, where the nanoflower array exhibited relatively stronger SERS signals.9 Studies revealed that smaller sized, spherical AuNPs show higher cellular uptake and penetration into cancer cells compared to Au nanorods.10,11Various physical,12 chemical3 and biological4 methods have been utilized to synthesize NPs with different sizes and shapes. Among the biological methods, the use of plant or plant fractions as a source for synthesizing NPs4,13 were highly preferred over other biological materials such as alga,14 or fungus15 because the latter require an elaborate process of maintaining cell cultures. The present study describes the use of pomegranate (Punica granatum) peel extract for the biosynthesis of AuNPs with different sizes and shapes. While pomegranate peel extract has been used to stabilise AuNPs,16 the effect of pomegranate peel extract as a capping agent to generate AuNPs with varied size and shape has not been investigated. More importantly, we have utilized the AuNP systems stabilized by peel extract for the naked eye detection of Fe3+ ions (10−7 M). Furthermore, the sensor–analyte system (Au–Fe3+) was utilized for the subsequent colorimetric selective detection of As3+ ions (10−4 M) in aqueous solution. While a large number of metal NP based sensors are available towards toxic ions, generating a color change observed by the naked eye for the sequential detection of Fe3+ and As3+ ions under ambient conditions has not been demonstrated so far. We have utilized UV-visible spectroscopy, dynamic light scattering (DLS), scanning electron microscopy (SEM), and transmission electron microscopy (TEM) for characterizing and analyzing the nanosystems. The kinetic studies provide invaluable information regarding the mechanistic aspect of the sensing process. The rates of the aggregation and disaggregation processes involved in the sensing mechanism has also been determined.
Experimental
Materials
All the chemicals were purchased from Sigma-Aldrich (USA) and used as received without further purification. Double distilled water was used for the experiments. Fresh and ripened pomegranate was purchased from the local market at Chennai (TN, India).Preparation of the extract
Pomegranate peels were removed and washed with distilled water before and after peeling. About 2 g of peel was transferred into a clean beaker containing 100 mL of distilled water and boiled for 5 min. The extract was filtered using Whatman filter paper no. 40 and stored in the refrigerator for further use.Synthesis of gold nanoparticles with different shapes
Aqueous solution of HAuCl4 (10 mL) was prepared in four different concentrations (concentration ranges between 10−2 M to 10−5 M). 200 μL of the extract was added to each solution of HAuCl4 at room temperature. After the addition of the extract, the reaction mixture was mixed by shaking prior to the experiment.Characterization
UV-visible spectroscopic studies were recorded on a UV-3100 Hitachi spectrometer. The IR spectra were taken using a Perkin Elmer FT-IR spectrometer. Zeta potential and particle size measurements were carried out using zeta sizer (Malvern). The size and morphology of the AuNPs were examined using scanning electron microscopy (SEM) (FEI Quanta FEG 200) and transmission electron microscopy (TEM) (Philips Tecnai 12). Energy dispersive X-ray spectroscopy (EDAX) and selective area electron diffraction (SAED) analysis were performed using a transmission electron microscope, equipped with an EDAX and SAED attachment, respectively. A Bruker D8 advance powder X-day diffractometer with Cu Kα radiation was used for X-ray diffraction analysis. Inductively coupled plasma-optical emission spectroscopy (ICP-OES) measurements were carried out using a Perkin Elmer Optima 5300 DV. The photographs were taken with a Canon A3200 IS digital camera.Colorimetric assay
Colorimetric detection experiments in the presence of various metal ions (Na+, K+, Li+, Ca2+, Cu2+, Mg2+, Mn2+, Co2+, Zn2+, Ni2+, Pb2+, Cd2+, Hg2+, UO22+, Ba2+, Fe2+, Bi3+, Fe3+, As3+, Al3+, Cr3+, Ce4+, V4+, As5+) were performed in aqueous solution with biosynthesized AuNPs (1 to 4) at room temperature. The concentration of the Fe3+ and As3+ ions was varied from 10−1 M to 10−7 M and 10−1 M to 10−4 M, respectively. 100 μL of metal ion was added to 200 μL of AuNPs, along with the addition of ∼1 mL of water. The sensing and selectivity of the metal ions were monitored using UV-vis absorption spectroscopy by changes in the surface plasmon resonance (SPR) peak of the AuNPs.Kinetic studies
The kinetic experiments were carried out by monitoring the changes in the absorption band of the AuNPs in the presence of the metal ions (Fe3+ and As3+), under pseudo-first-order conditions. The rate constants were determined using graphical methods where the observed rate constants were plotted against the concentrations of the analyte metal ions.Results and discussion
Our aim is to synthesize gold nanoparticles with different sizes and shapes in order to find the impact of size/shape variations on toxic metal ion sensing. The detection of toxic metal ions in water is important because imbalance in the concentration of such species can lead to a number of diseases.17–20Pomegranate peels have been used in folk medicine as remedies for dysentery, diarrhea and stomatitis.21,22 The peels are rich in tannins and polyphenols23–25 and they have also been used in anti-cancer, anti-inflammatory, anti-helminthic treatments.26,27 We hypothesized that the presence of polyphenols in the peel extract can potentially reduce the gold ions and the available amino acids/poly peptides can stabilize the nanosystems by steric effects.
We also hypothesized that the presence of various functional groups in pomegranate peel extract can also be used to sense toxic metal ions.
Factors affecting the size and shape of AuNPs
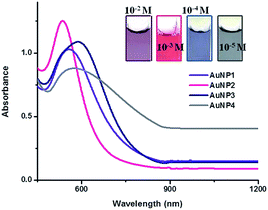
Initially, we fixed the concentration of HAuCl4 (10−3 M) (10 mL) and varied the amount of peel extract from 100 μL to 1 mL. We observed that the AuNP solution formed was red in color and the color did not change as a function of the peel extract concentration. However, UV-vis spectra of the solutions exhibit slight spectral broadening as the concentration of the peel extract increases (Fig. S1†). Since the SPR band maxima remain the same in these experiments, the formation of AuNPs with different shapes is less likely. The TEM analysis also corroborates this hypothesis (vide infra). The variable concentration study suggests that 200 μL of the extract provides the optimum condition for obtaining smaller sized spherical NPs from 10−3 M HAuCl4. The spectral broadening also suggests that the aggregation propensity of the NPs increases as the concentration of the peel extract increases >200 μL. Conversely, increasing the concentration of HAuCl4 from 10−5 to 10−2 M, keeping the peel extract concentration identical (200 μL), results in a clear shift in the SPR absorption maxima (Fig. 1). This indicates drastic changes in the size and/or shape of the NPs as a function of the metal precursor. The TEM analysis supports this hypothesis and the images clearly exhibit polydispersed, spherical, flower and urchin shaped NPs for different concentrations of the NP precursor (Fig. 2 and S2†). The experiments were reproduced four times and identical TEM images were obtained. From the above results, it is concluded that the size and shape of the NPs can be controlled by keeping the concentration of the peel extract identical (200 μL in the present case) and varying the concentration of the metal ion precursor.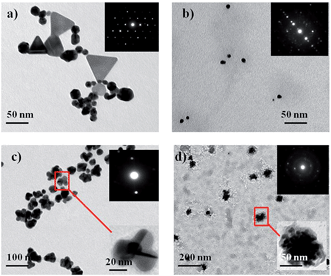 | ||
| Fig. 2 TEM images of (a) AuNP1, (b) AuNP2, (c) AuNP3 and (d) AuNP4. The insets are the corresponding SAED images. | ||
Upon the addition of the extract (200 μL) to different concentrations of HAuCl4 solutions (10−2 to 10−5 M), the color of the solutions changed from pale yellow to violet, red, blue and ash within one minute. The solutions are respectively named as AuNP1, AuNP2, AuNP3 and AuNP4. The UV-vis absorption spectra of AuNP1 to AuNP4 solutions are shown in Fig. 1, along with the corresponding photographs (Fig. 1 inset).
AuNP2 exhibits a sharp absorption compared to the other solutions, indicating that spherical and uniform sized AuNPs were generated. The red shift in the SPR peak for AuNP3 and AuNP4 indicates that there is a relative increment in the particle size.28
A careful analysis of the TEM images indicates that AuNP1 contains spherical, triangular and hexagonal shaped particles (Fig. 2a). Conversely, all of the nanoparticles in AuNP2 are spherical, well dispersed and uniform in size (∼20 nm) and shape (Fig. 2b). The shapes of AuNP3 and AuNP4 are flower and urchin, respectively. While these NPs are monodispersed, they have increased size (∼50 and 100 nm, respectively), which is consistent with the UV-vis study (Fig. 2c and d).
SAED patterns of the pomegranate peel extract-stabilized AuNPs are given in the insets of Fig. 2. The image reflects the (111), (200), (220) and (311) diffraction patterns which indicates the fcc structure of the AuNPs. The presence of elemental gold is confirmed by EDX analysis. It shows a strong peak of Au at 2.2 keV, which is characteristic of AuNPs (Fig. S3†).29 XRD patterns of the AuNPs (1–4) were recorded by drop casting of the solution on glass slides. The Bragg's reflections (111), (200), (220) and (311) were clearly observed (Fig. S4†) which also indicate the fcc structure of the AuNPs,30 consistent with the SAED pattern.
Next, we carried out dynamic light scattering and zeta potential measurements for the synthesized monodispersed nanoparticles. The results are summarized in Table S1.† It is shown that the zeta potential of the nanoparticles follows the order AuNP2 < AuNP3 < AuNP4 and the nanoparticles are negatively charged on the surface (AuNP1 was not analysed for zeta potential measurements due to the presence of polydispersed particles). The hydrodynamic radius also follows the order AuNP2 < AuNP3 < AuNP4.
Mechanism for the formation of NPs
Pomegranate peels are rich in phytochemicals. It is a rich source of tannins and phenolic compounds such as punicalagin and punicalin.17–19N-Methyl granatonine is a coloring agent which is present in an alkaloid form in the aqueous extract of peels.31 The functional groups present in the extract are confirmed by taking an FT-IR spectrum of the peel extract where spectral bands ranging from 763 to 3342 cm−1 were observed (Fig. S5†). The band at 3342 cm−1 is attributed to the stretching vibration of O–H in the phenolic groups of polyphenols. The peaks at 2926, 2315 and 2138 cm−1 are due to the stretching vibrations of C–H and O–C–O groups. The C![[double bond, length as m-dash]](https://www.rsc.org/images/entities/char_e001.gif) C stretching vibration is observed at 1644 cm−1 and the peaks at 1450, 1211, 1047 and 763 cm−1 correspond to stretching vibrations from C
C stretching vibration is observed at 1644 cm−1 and the peaks at 1450, 1211, 1047 and 763 cm−1 correspond to stretching vibrations from C![[double bond, length as m-dash]](https://www.rsc.org/images/entities/char_e001.gif) C, C–O, C–OH and C–H groups, respectively. Fig. S6† shows the UV-vis absorption spectra of the aqueous peel extract. The peeks at 228, 256 and 374 nm exactly match with the spectra of the phenolic compound punicalagin.32 Hence, it can be concluded that these functional groups (–C
C, C–O, C–OH and C–H groups, respectively. Fig. S6† shows the UV-vis absorption spectra of the aqueous peel extract. The peeks at 228, 256 and 374 nm exactly match with the spectra of the phenolic compound punicalagin.32 Hence, it can be concluded that these functional groups (–C![[double bond, length as m-dash]](https://www.rsc.org/images/entities/char_e001.gif) C–, CH3, C
C–, CH3, C![[double bond, length as m-dash]](https://www.rsc.org/images/entities/char_e001.gif) O, OH) present in the extract are responsible for the reduction and stabilization of the formed nanoparticles.33
O, OH) present in the extract are responsible for the reduction and stabilization of the formed nanoparticles.33
The variation in size and shape of the AuNPs can be explained based on the ratio between Au3+ ions and the capping agent. When the ratio is relatively high, the aggregation propensity will be high, leading to the formation of NPs with various sizes and shapes. For example, the AuNP1 system provides NPs with various sizes and shapes due to the relatively high concentration of the Au3+ ions compared to the capping agent (i.e., a high ratio between Au3+ and capping agent). On the other hand, the uniform size and shape in AuNP2 indicates that the amount of the capping agent and Au3+ ions is optimised so that the aggregation propensity is controlled. When the ratio between Au3+ ions and the capping agent is low, as in the case of AuNP3 and AuNP4, the concentration of the capping agent is increased further, and the aggregation propensity of the systems also increases. This leads to flower and urchin shaped NPs. The fact that the size and shape of the NPs remain the same for AuNP3 and AuNP4 suggests that aggregation was controlled in nature.
Naked eye colorimetric detection of Fe3+ by AuNPs (1–4)
We used the aqueous pomegranate peel extract-stabilized AuNPs (1–4) for the colorimetric detection of metal ions in aqueous solution. AuNPs show size and shape dependent SPR, which are highly sensitive to selected analytes.33,34 Depending on the extent of aggregation, the shift of SPR may vary from the visible to near-IR region.35,36 In the present study, the selectivity of the AuNPs was investigated with twenty-four different metal ions (Fig. 3, S7 and S8†). We observed that the NPs exhibited a color change only in the presence of Fe3+ ions, which can be observed by the naked eye. Interestingly, the color change due to the presence of Fe3+ ions was unique in the four different AuNP systems. While AuNP1 shows a color variation from violet to brown, AuNP2 exhibits a color change from red to brown, in the presence of Fe3+ ions. AuNP3 and AuNP4 show color changes from blue to ash and ash to black, respectively. The above color changes are due to the formation of different sized AuNP aggregates in the presence of Fe3+ ions, which are confirmed by UV-vis spectroscopy. The intensity of the SPR band for AuNP1 and AuNP2 is decreased in the presence of Fe3+ ions, with the concomitant increase of two SPR bands at ∼700 nm and ∼1060 nm (Fig. S9a and b†). The intensity of the SPR peaks of AuNP3 and AuNP4 were also decreased as Fe3+ concentration was increased, with the formation of an additional SPR band in the NIR region (Fig. S9c and d†). Since the color contrast in AuNP2 and AuNP3 is relatively high in the presence of Fe3+ ions, the naked eye detection of Fe3+ ions was feasible for solutions as dilute as 10−7 M.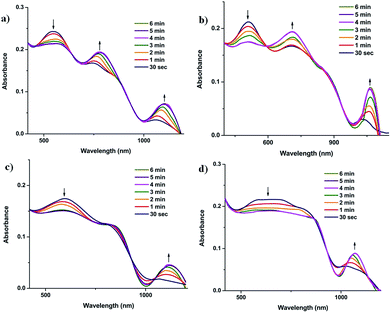 | ||
| Fig. 3 The time-dependent aggregation of (a) AuNP1, (b) AuNP2, (c) AuNP3 and (d) AuNP4 monitored by UV-vis absorption in the presence of 10−6 M [Fe3+]. | ||
Morphological changes of the AuNPs induced by Fe3+ ions were examined through scanning electron microscopy (SEM) and transmission electron microscopy (TEM). The addition of Fe3+ ions (10−6 M) to the AuNP solution triggers NP aggregation as is evident from the TEM images (Fig. 4). Careful examination of the TEM images indicates the formation of alloy NPs and core@shell NPs37–39 in AuNP2 (Fig 4b and S10†). We also observed that the formation of core@shell NPs is less compared to that of alloy NPs in the case of AuNP2. In the presence of Fe3+ ions, AuNP3 and AuNP4 systems form urchin and cubic shape aggregates in solution (Fig. 4c and d). The formation of alloy or core–shell NPs depends on the distribution of Fe3+ ions on the surface of AuNPs.40 The fact that the SPR band in the AuNP systems shifts from the visible to IR region upon the addition of Fe3+ ions suggests that the metal ion binds with the biomolecules on the surface of the NPs and brings them together, resulting in inter-plasmonic coupling interactions.32–39,41–44 The aggregation propensity of the NPs depends on the concentration of metal ion, the binding nature of the functional groups on the NP surface, and the size and shape of the NPs.
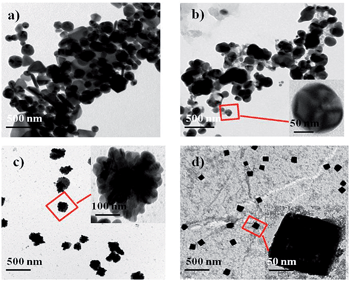 | ||
| Fig. 4 TEM images of (a) AuNP1, (b) AuNP2, (c) AuNP3 and (d) AuNP4 in the presence of Fe3+ ions (10−6 M). The images are taken after 2 min of addition. | ||
The centrifuged sample was taken for XRD analysis and diffraction peaks at 33.13, 35.64, 40.89, 54.10, 57.59 and 62.47 are indexed as (104), (110), (113), (116), (018) and (214) (Fig. S11†). These reflections correspond to the rhombohedral structure of α-Fe2O3.43 This indicates that Fe0 is oxidized to α-Fe2O3 NPs in all of the four different AuNPs.40 The presence of iron in the aggregates was also confirmed by EDAX analysis (Fig. S12†). These results are consistent with the XRD analysis. We investigated the effect of other metal ions on the AuNP and Fe3+ system. The results suggest that there is no change in the SPR absorption of AuNPs in the presence of other metal ions (except As3+ ions) (Fig. S13†).
Rate of aggregation of AuNPs (1–4) by Fe3+
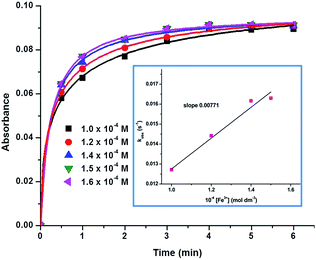
We monitored the time-dependent changes in the absorption of AuNPs in the presence of Fe3+ ions. UV-vis spectra show that upon addition of Fe3+ ions, the peak intensity of AuNPs at ∼550 nm is decreased and the intensity of additional peaks in the visible and NIR regions are enhanced, presumably due to the aggregation of NPs (Fig. 3). It is also noticed that the intensity of the additional peaks is enhanced and reached a plateau after four minutes. Similarly, time dependent DLS experiments suggest that aggregation reaches a saturated level after four minutes (Fig. S14 and 15†). The changes in the size and shape of the AuNP–Fe aggregates were also monitored by time-dependent SEM and TEM. The morphology of AuNP1, AuNP2, AuNP3, and AuNP4 has been changed from their respective initial structures to dendritic (Fig. S16b), flower (Fig. S16d), sheet (Fig. S17b) and flower bouquet (Fig. S17d†).In order to find out the rate of aggregation of the AuNPs in the presence of Fe3+ ions, rate studies have been carried out under pseudo-first-order conditions, by keeping [Fe3+] in excess (>10 times). The time-dependent changes of the SPR of the NPs were monitored using UV-vis spectroscopy. All of the AuNP systems showed logistic growth of aggregation (Fig. 5 and S18†). We found the observed rate constant from the logistic growth curve of the absorbance vs. time plot. Furthermore, we found the bimolecular rate constant by the linear fitting of the observed rate constants vs. concentration of Fe3+ ions, which is given in Fig. S19.† The bimolecular rate constant values for all of the four AuNP–Fe systems are given in Table S2.† The concentration of Fe3+ ions was changed from 1.0 × 10⁻⁴ M to 1.6 × 10⁻⁴ M (Fig. 5 and S18†).
Naked eye colorimetric sensing of As3+ by AuNP–Fe system
It is clear from the interference study that the presence of As3+ ions affects the NIR absorption peak of the AuNP–Fe system. In the literature, reports are available for the sensing/adsorption of As3+ ions by iron, iron oxide NPs,45–47 and Au/Au–Fe NPs modified electrodes.48,49 However, relatively very few reports are available regarding As3+ sensing based on AuNPs50 and Au nanoclusters.51Among the various metal ions examined, the addition of only As3+ (10−4 M) in the AuNP–Fe system results in a drastic color change. The color change due to the presence of As3+ was detectable by the naked eye, as in the case of Fe3+ detection by the AuNPs. We have monitored the absorption spectrum of the AuNP–Fe system with twenty-three different metal ions in aqueous solution (Fig. S12†).
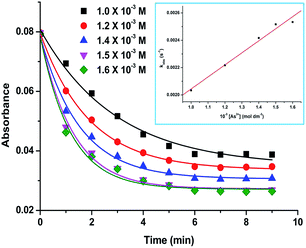
The UV-vis absorption spectra show that upon addition of As3+ to the AuNP–Fe system, the intensity of the SPR peak at the near-IR region is decreased (Fig. 6 and S20†) and the intensity of the SPR peak in the visible region is increased. This suggests that the AuNP–Fe disaggregates in the presence of As3+ ions. The graph of absorption vs. time indicates that the disaggregation process followed an exponential decay (Fig. 7 and S20†). The rate of disaggregation of the AuNP–Fe system was determined by monitoring the SPR in the presence of different concentrations of As3+ in the AuNP–Fe systems (Fig. 6 and S20†). We found the disaggregation rate constant values for the systems by the linear fitting of the observed rate constant vs. concentration of As3+ ions (inset, Fig. 7, S21 and Table S3†). The disaggregation of AuNP–Fe with the addition of As3+ was also monitored by SEM and the images clearly show fragmentation after the addition of As3+ (Fig. 8 and S22–26†). The disaggregation of the AuNP–Fe system was further confirmed by time-dependent DLS measurements. The results show that the size of the aggregates is decreased in the presence of As3+ ions. The time taken for the size re-organization was close to that observed by UV-vis spectroscopy (Fig. S27 and 28†).
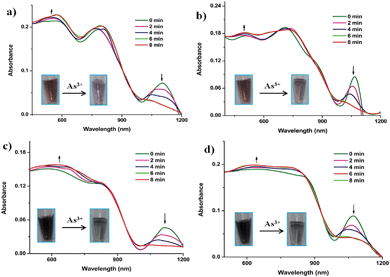 | ||
| Fig. 6 UV-vis absorption spectra showing the time-dependent disaggregation of (a) AuNP1–Fe, (b) AuNP2–Fe, (c) AuNP3–Fe, (d) AuNP4–Fe systems in the presence of 10−3 M of As3+ ions. | ||
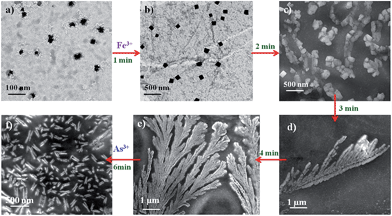 | ||
| Fig. 8 TEM (a and b) and SEM (c–f) images showing the aggregation and disaggregation of AuNP4 in the presence of Fe3+ (10−6 M) and As3+ (10−3 M) ions. | ||
It has been reported in the literature that a strong interaction is likely to occur between As3+ and α-Fe2O3.52 It is feasible that α-Fe2O3 could leach out due to the interaction, which is confirmed by XRD analysis of the aggregates (Fig. S29†).53 The disaggregation results again show a color change/color disappearance. The detection limit for As3+ by the naked eye has been calculated as 10−4 M. An interference study was also carried out with other metal ions and the results suggest that the AuNP–Fe system is selectively sensing As3+ ions (Fig. S30†). The schematic representation of aggregation followed by the disaggregation process is shown in Scheme 1.
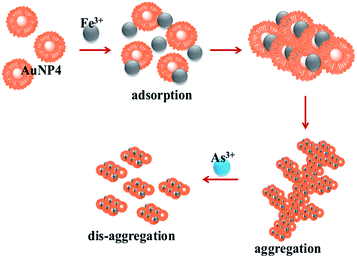 | ||
| Scheme 1 Proposed mechanism for the aggregation and disaggregation of AuNP4 with the addition of Fe3+ and As3+ ions. | ||
Application of AuNPs in real sample analysis
In order to test the sensing ability of the as-synthesized AuNP based systems, tap water was collected and analysed using the NPs. Initially, the water sample was filtered through Whatman filter paper no. 40 and then utilized for testing. About 200 μL of tap water was added to 100 μL of different AuNPs (AuNP1–4). The color of the solution was changed upon keeping the solution for ten minutes and the UV-vis spectra indicate similar changes to that obtained in the presence of Fe3+ ions (Fig. S31†). The presence of Fe3+ ions in tap water was further confirmed by ICP-OES and the amount was quantified as 0.012 mg L−1. The results suggest that the as-synthesized AuNP system provides a cost effective way of detecting the presence of iron and arsenic by ‘naked eye detection’ for real-time water analysis.Conclusion
In this work, we have synthesised and stabilized four different types of AuNPs using pomegranate peel extract. The as-synthesized AuNP systems have been utilized to detect Fe3+ ions at 10−7 M of the analyte, leading to a definite color change in the visible region. The adsorbed Fe3+ ions form alloy as well as core–shell nanosystems with the AuNPs. Furthermore, the AuNP–Fe systems were used to sense As3+ ions in aqueous solution via a reversible aggregation path way. The sensing of As3+ ions can be monitored by the naked eye and the detection limit was 10−4 M. The methods of NP synthesis and sequential metal ion sensing are simple, cost effective, time saving and eco-friendly. Finally, we demonstrated the practical application of these bio-NPs by the analysis of tap water. The results taken together indicate that the presence of pomegranate peal extract is essential for the sequential detection of metal ions, due to its rich content of several functional groups.Acknowledgements
S. Kaviya thanks the INSPIRE fellowship from DST, Govt. of India. We thank the financial support from DST Nano Mission {Ref. no. SR/NM/MS-115/2010 (G)}. We thank SAIF, IITM, for providing FT-IR and SEM facility.Notes and references
- Y. H. Chien, C. C. Huang, S. W. Wang and C. S. Yeh, Green Chem., 2011, 13, 1162–1166 RSC.
- S. K. Das, A. R. Das and A. K. Guha, Langmuir, 2009, 25, 8192–8199 CrossRef CAS PubMed.
- C. M. MacLaughlin, N. Mullaithilaga, G. Yang, S. Y. Ip, C. Wang and G. C. Walker, Langmuir, 2013, 29, 1908–1919 CrossRef CAS PubMed.
- V. Reddy, R. S. Torati, S. Oh and C. Kim, Ind. Eng. Chem. Res., 2013, 52, 556–564 CrossRef CAS.
- D. Mubarakali, N. Thajuddin, K. Jeganathan and M. Gunasekaran, Colloids Surf., B, 2011, 85, 360–365 CrossRef CAS PubMed.
- C. K. Kim, P. Ghosh and V. M. Rotello, Nanoscale, 2009, 1, 61–67 RSC.
- S. K. Das, C. Dickinson, F. Lafir, D. F. Brougham and E. Marsili, Green Chem., 2012, 14, 1322–1334 RSC.
- R. Huschka, J. Zuloage, M. W. Knight, L. V. Brown, P. Nordlander and N. J. Halas, J. Am. Chem. Soc., 2011, 133, 12247–12255 CrossRef CAS PubMed.
- T. Wang, X. Hu and S. Dong, J. Phys. Chem. B, 2006, 110, 16930–16936 CrossRef CAS PubMed.
- K. Huang, H. Ma, J. Liu, S. Huo, A. Kumar, T. Wei, X. Zhang, S. Jin, Y. Gan, P. C. Wang, S. He, X. Zhang and X. J. Liang, ACS Nano, 2012, 6, 4483–4493 CrossRef CAS PubMed.
- C. Xu, D. Yang, L. Mei, B. Lu, L. Chen, Q. Li, H. Zhu and T. Wang, ACS Appl. Mater. Interfaces, 2013, 5, 2715–2724 CAS.
- D. Jang and D. Kim, Appl. Phys. A, 2004, 79, 1985–1988 CAS.
- S. Kaviya, J. Santhanalakshmi, B. Viswanathan, J. Muthumary and K. Srinivasan, Spectrochim. Acta, Part A, 2011, 79, 594–598 CrossRef CAS PubMed.
- K. Kalishwaralal, V. Deepak, S. R. K. Pandian, M. Kottaisamy, S. Barathmanikanth, B. Kartikeyan and S. Gurunathan, Colloids Surf., B, 2010, 77, 257–262 CrossRef CAS PubMed.
- P. Mukherjee, A. Ahmad, D. Mandal, S. Senapati, S. R. Sainkar, M. I. Khan, R. Parishcha, P. V. Ajaykumar, M. Alam, R. Kumar and M. Sastry, Nano Lett., 2001, 1, 515–519 CrossRef CAS.
- M. Ganeshkumar, M. Sathishkumar, T. Ponrasu, M. G. Dinesh and L. Suguna, Colloids Surf., B, 2013, 106, 208–216 CrossRef CAS PubMed.
- J. R. Burdo and J. R. Connor, BioMetals, 2003, 16, 63–75 CrossRef CAS.
- B. K. Mandal and K. T. Suzuki, Talanta, 2002, 58, 201–235 CrossRef CAS.
- J. C. Saha, A. K. Dikshit, M. Bandyopadhyay and K. C. Saha, Crit. Rev. Environ. Sci. Technol., 1999, 29, 281–313 CrossRef CAS.
- H. S. Yu, W. T. Liao and C. Y. Chai, J. Biomed. Sci., 2006, 13, 657–666 CrossRef CAS PubMed.
- K. Boukef, H. R. Souissi and G. Balansard, Plantes Medicinales et Phytotherapie, 1982, 16, 260–279 Search PubMed.
- A. Caceres, L. M. Giron, S. R. Alvarado and M. F. Torres, J. Ethnopharmacol., 1987, 20, 223–237 CrossRef CAS.
- H. Saad, F. C. Bouhtoury, A. Pizzi, K. Rode, B. Charrier and N. Ayed, Ind. Crops Prod., 2012, 40, 239–246 CrossRef CAS PubMed.
- M. Cam and Y. Hisil, Food Chem., 2010, 123, 878–885 CrossRef CAS PubMed.
- T. Ismail, P. Sestili and S. Akhter, J. Ethnopharmacol., 2012, 143, 397–405 CrossRef CAS PubMed.
- E. A. Hayouni, K. Miled, S. Boubaker, Z. Bellasfar, M. Abedrabbad, H. Iwaskie, H. Okue, T. Matsuie, F. Limama and M. Hamdi, Phytomedicine, 2011, 18, 976–984 CrossRef CAS PubMed.
- G. Mousavinejad, Z. E. Djomeh, K. Rezaei and M. H. H. Khodaparast, Food Chem., 2009, 115, 1274–1278 CrossRef CAS PubMed.
- T. Sen and A. Patra, J. Phys. Chem. C, 2009, 113, 13125–13132 CAS.
- S. Das, A. R. Das and A. K. Guha, Small, 2010, 6, 1012–1021 CrossRef CAS PubMed.
- N. Ozkal and S. Dinc, Ankara Univ. Eczacilik Fak. Derg., 1994, 22, 21–29 Search PubMed.
- J. Moilanen, J. Sinkkonen and J. P. Salminen, Chemoecology, 2013, 23, 165–179 CrossRef CAS PubMed.
- S. Kaviya and E. Prasad, ACS Sustainable Chem. Eng., 2014, 2, 699–705 CrossRef CAS.
- J. Schmitt, P. Machtle, D. Eck, H. Mohwald and C. A. Helm, Langmuir, 1999, 15, 3256–3266 CrossRef CAS.
- P. Mulvaney, Langmuir, 1996, 12, 788–800 CrossRef CAS.
- S. P. Wu, Y. P. Chen and Y. M. Sung, Analyst, 2011, 136, 1887–1891 RSC.
- T. J. Norman, C. D. Grant, D. Magana and J. Z. Zhang, J. Phys. Chem. B, 2002, 106, 7005–7012 CrossRef CAS.
- D. L. Lu, K. Domen and K. I. Tanaka, Langmuir, 2002, 18, 3226–3232 CrossRef CAS.
- N. Dahal and V. Chikan, Chem. Mater., 2008, 20, 6389–6395 CrossRef CAS.
- K. C. F. Leung, S. Xuan, X. Zhu, D. Wang, C. P. Chak, S. F. Lee, W. K. W. Ho and B. C. T. Chung, Chem. Soc. Rev., 2012, 41, 1911–1928 RSC.
- M. B. Cortie and A. M. M. Donagh, Chem. Rev., 2011, 111, 3713–3735 CrossRef CAS PubMed.
- H. Yu, M. Chen, P. M. Rice, S. X. Wang, R. L. White and S. Sun, Nano Lett., 2005, 5, 379–382 CrossRef CAS PubMed.
- A. Gole, J. W. Stone, W. R. Gemmill, H. C. Loye and C. J. Murphy, Langmuir, 2008, 24, 6232–6237 CrossRef CAS PubMed.
- L. Zhou, H. Xu, H. Zhang, J. Yang, S. B. Hartono, K. Qian, J. Zou and C. Yu, Chem. Commun., 2013, 49, 8695–8697 RSC.
- H. Jans and Q. Huo, Chem. Soc. Rev., 2012, 41, 2849–2866 RSC.
- N. Horzum, M. M. Demir, M. Nairat and T. Shahwan, RSC Adv., 2013, 3, 7828–7837 RSC.
- A. Gupta, M. Yunus and N. Sankararamakrishnan, Ind. Eng. Chem. Res., 2013, 52, 2066–2072 CrossRef CAS.
- C. Gao, X. Y. Yu, S. Q. Xiong, J. H. Liu and X. J. Huang, Anal. Chem., 2013, 85, 2673–2680 CrossRef CAS PubMed.
- X. Dai, O. Nekrassova, M. E. Hyde and R. G. Compton, Anal. Chem., 2004, 76, 5924–5929 CrossRef CAS PubMed.
- H. Cui, W. Yang, X. Li, H. Zhao and Z. Yuan, Anal. Methods, 2012, 4, 4176–4181 RSC.
- N. Xia, Y. Shi, R. Zhang, F. Zhao, F. Liu and L. Liu, Anal. Methods, 2012, 4, 3937–3941 RSC.
- S. Roy, G. Palui and A. Banerjee, Nanoscale, 2012, 4, 2734–2740 RSC.
- R. Prucek, J. Tucek, J. Kolarik, J. Filip, Z. Marusak, V. K. Sharma and R. Zboril, Environ. Sci. Technol., 2013, 47, 3283–3292 CAS.
- S. K. Tripathy, J. Y. Woo and C. S. Han, Sens. Actuators, B, 2013, 181, 114–118 CrossRef CAS PubMed.
Footnote |
| † Electronic supplementary information (ESI) available: See DOI: 10.1039/c4ay02342k |
| This journal is © The Royal Society of Chemistry 2015 |

