
A multiplex chemiluminescent biosensor for type B-fumonisins and aflatoxin B1 quantitative detection in maize flour†
Martina
Zangheri
a,
Fabio
Di Nardo
b,
Laura
Anfossi
b,
Cristina
Giovannoli
b,
Claudio
Baggiani
b,
Aldo
Roda
ac and
Mara
Mirasoli
*ac
aDepartment of Chemistry “G. Ciamician”, University of Bologna, via Selmi 2, 40126 Bologna, Italy. E-mail: mara.mirasoli@unibo.it
bDepartment of Chemistry, University of Turin, Via P. Giuria, 5, 10125 Torino, Italy
cNational Institute for Biostructures and Biosystems (INBB), Viale Medaglie d'Oro 305, 00136 Rome, Italy
First published on 21st October 2014
Abstract
A multiplex chemiluminescent biosensor for simple, rapid and ultrasensitive on-site quantification of aflatoxin B1 and type B-fumonisins in maize samples has been developed. The biosensor integrates a multiplex indirect competitive lateral flow immunoassay (LFIA) based on enzyme-catalyzed chemiluminescence detection and a highly sensitive portable charge-coupled device (CCD) camera, employed in a lensless “contact” imaging configuration. The developed assay requires a simple extraction of the analytes from maize flour samples followed by their detection with a 30 min assay time. The use of chemiluminescence detection allowed accurate and objective analytes quantification, enabling simultaneous detection of type B-fumonisins and aflatoxin B1 down to 6 μg kg−1 and 1.5 μg kg−1, respectively, thus fulfilling the standards imposed by the legislation of European Union. Maize flour samples spiked with both analytes were subjected to multiplex analysis obtaining recoveries ranging from 80 to 115% and the coefficient of variation below 20%. Finally, analysis of naturally contaminated maize samples resulted in a good agreement between CL-LFIA and a validated confirmatory HPLC-UV and commercial ELISA kit, obtaining recoveries in the range 88–120%. The proposed CL-LFIA protocol is rapid, inexpensive, easy-to-use, and fit for the purpose of rapid screening of mycotoxins in maize flour.
Introduction
The development of rapid and portable analytical devices for on-site screening applications is one of the most active trends in the field of agrofood analysis, since contamination with toxic substances (e.g., natural toxins, pesticides, veterinary drug residues, environmental pollutants) or microorganisms poses severe safety issues, as well as great economic concern.Immunochromatographic assays (also named lateral-flow immunoassays, LFIA) have shown to be particularly advantageous for such applications, since they provide rapid, simple, specific analyses with no instrumental requirement. Following their success in diagnostics, application in agrofood screening is now an emerging field. In order to foster the use of LFIA methods as screening tools for food safety, two promising fields of research have been recently identified, namely the development of multiplex assays and their combination with portable recording devices.1 Such features will enhance the competing ability of these portable tests with laboratory-based screening methods, directly providing on-site quantitative information on a number of analytes in a given sample. This will enable accurate screening of a large number of samples directly where they are obtained and significant savings in terms of time and costs, since only the actual suspicious samples will be transported to the analytical laboratory for confirmatory analyses. Aflatoxins and fumonisins are secondary metabolites produced by Aspergillus and Fusarium respectively, growing on agricultural commodities in the field or after harvest.2 Since mycotoxins represent one of the most important threat for cereal safety,3 exhibiting acute toxic, carcinogenic, mutagenic, teratogenic, immunotoxic and estrogenic effects in man and animals,4,5 the European Commission (EC) has established maximum residue limits (MRLs) in cereals and cereal-based foods and feeds: 4000 μg kg−1 for type B-fumonisin and 4 μg kg−1 for the sum of aflatoxins B1 (AfB1), B2, G1 and G2 as well as 2 μg kg−1 for AfB1.6
A wide number of LFIA methods have been developed for mycotoxin detection in feed and food.1,7–9 We recently reported a chemiluminescence (CL) LFIA-based biosensor for simple, rapid and ultrasensitive on-site quantification of type B-fumonisins in maize flour down to 25 μg kg−1, which has been successfully applied to both standard and real samples.10 It is well known that enzyme-catalyzed CL detection provides high detectability, rapidity, specificity and a wide linear range in immunoassays,11,12 especially in miniaturized formats.13 This approach has been recently extended to LFIA methods, converting them from qualitative methods (when conventional colloidal gold labelling is employed) to highly sensitive and quantitative assays.14–16
There is a growing demand for multiplex screening assays to replace single-analyte ones, since several mycotoxins may coexist in a single product and yield to synergistic toxic effects.2,7 Despite immunochromatography technology potentially offers easy implementation of multi-residue analysis and obvious economic encouragement for this approach, few multiplex LFIA assays have been described in the literature up to now,8,17–21 and none of them have exploited the advantages of CL detection.
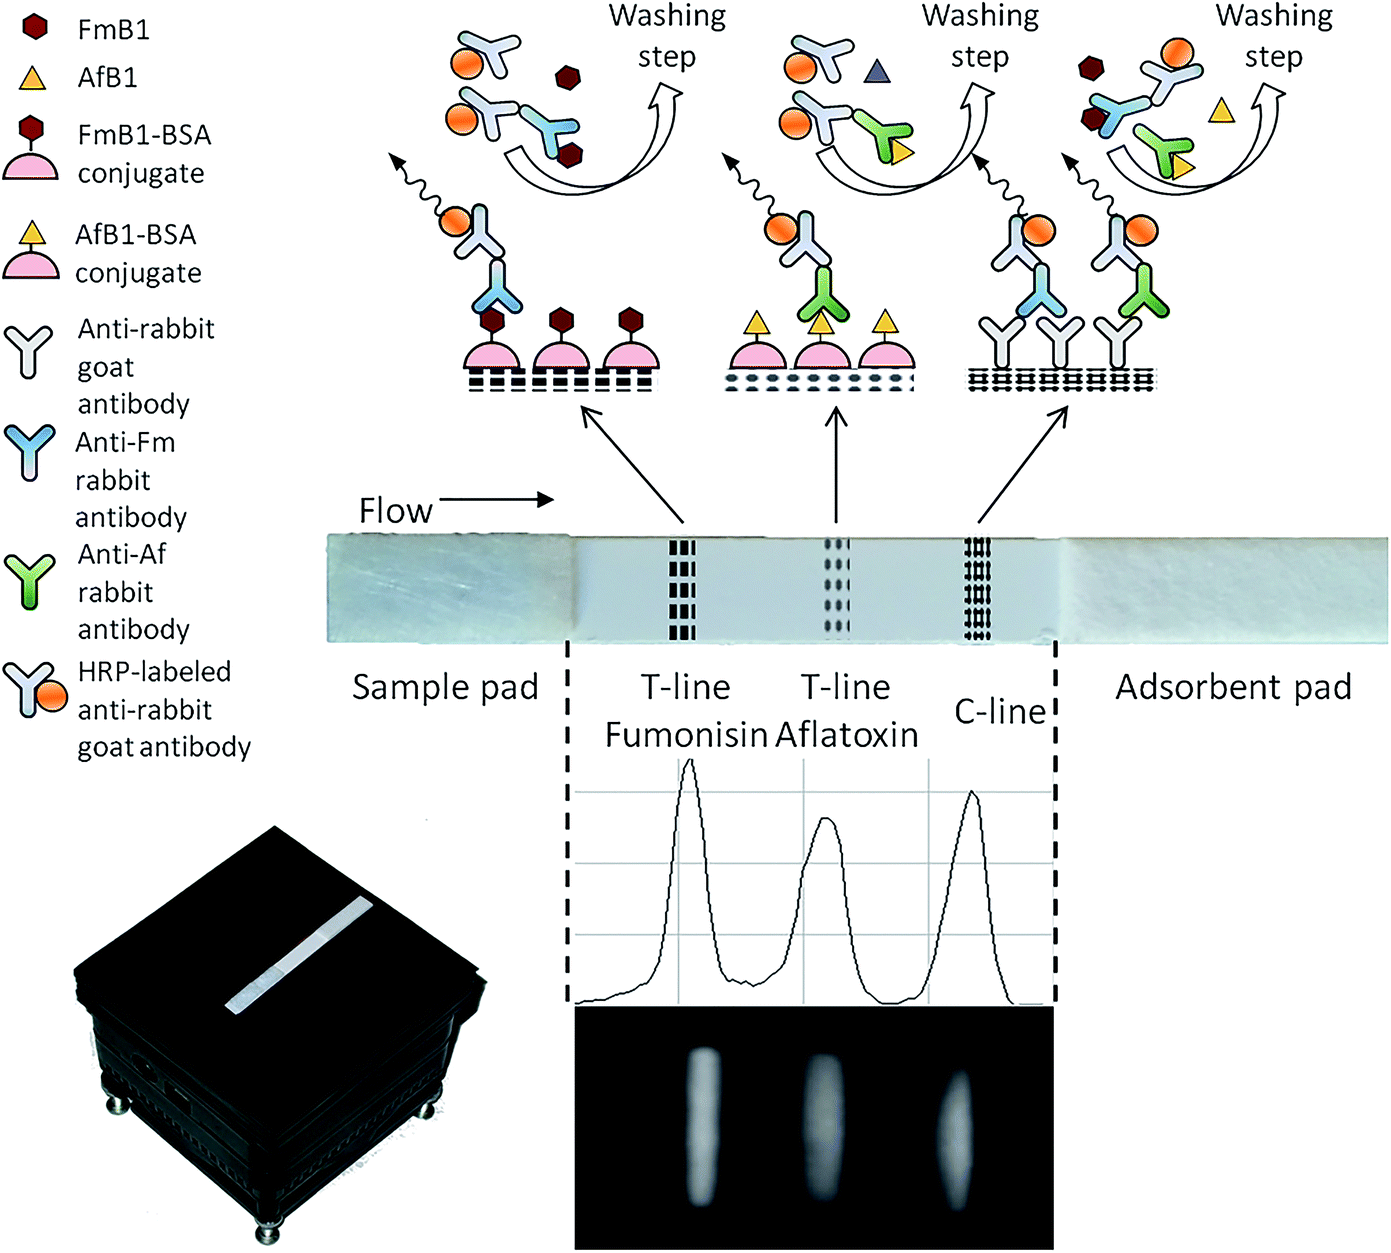
Herein we report the development of a biosensor for the multiplex detection of type-B fumonisins and AfB1 in maize samples. The biosensor is based on a portable ultrasensitive CCD-based “contact” imaging device coupled with a CL-LFIA strip, on which two competitive immunoassays are simultaneously performed. Aflatoxin B1 conjugated with bovine serum albumin (AfB1–BSA) and fumonisin B1 (FmB1)–BSA conjugate were immobilized in different positions along the strip. Upon sample application, type-B fumonisins and AfB1 in the sample competed with immobilized analogues for their specific anti-fumonisin or anti-aflatoxin antibodies added to the sample. Signal detection was performed by CL contact imaging upon addition of a horseradish peroxidase (HRP)-labelled secondary antibody and the suitable enzyme CL substrate. With this format, a quantitative and objective measurement of target analytes below EU regulatory levels was performed, thus enabling rapid and reliable identification of those samples requiring confirmatory analysis.
Materials and methods
Reagents
FmB1, AfB1, aflatoxin B2, aflatoxin G1, aflatoxin G2, ochratoxin A, deoxynivalenol, and zearalenone (Oekanal certified solutions), BSA, Tween-20 and HRP-labeled goat anti-rabbit immunoglobulin were purchased from Sigma Aldrich (St. Louis, MO, USA). Ultrapure water was produced by a Millipore Milli Q system (Millipore, Bedford, MA). The Supersignal ELISA Femto CL substrate for HRP was bought from Thermo Fisher Scientific Inc. (Rockford, IL).FmB1 and AfB1 powder were purchased from Fermentek (Jerusalem, Israel). The goat anti-rabbit antibody was purchased from AbCam (Cambridge, UK). Rabbit anti-FmB1 antibodies and rabbit anti-AfB1 antibodies were kindly supplied by Generon srl (Modena, Italy). The other reagents were of analytical grade and were employed as received. Phosphate buffered saline (PBS) was prepared as follows: 10 mmol L−1 Na2HPO4, 2 mmol L−1 KH2PO4, 137 mmol L−1 NaCl, 2.7 mmol L−1 KCl, and pH 7.4. Assay strips for LFIA were prepared by immobilizing on nitrocellulose membranes, from bottom to top of the strip, the FmB1–BSA conjugate, the AfB1–BSA conjugate, and the goat anti-rabbit antibody to form the two test lines (T-lines) and the control line (C-line), respectively, keeping a distance of 4 mm between the lines (Fig. 1, Panel C). The membranes were then assembled with a sample and an adsorbent pad and cut into sections. Details are available as ESI.†
 | ||
| Fig. 1 Top: a scheme of the multiplex CL-LFIA assay on the nitrocellulose strip. Bottom: a CCD-based device in a contact imaging detection format for acquiring CL signals from LFIA strips; a chemiluminescence image and intensity profile of a nitrocellulose membrane where adjacent lines were immobilized at a 4 mm distance. | ||
Preparation of mycotoxin–BSA conjugates
The FmB1–BSA conjugate was synthesized according to Christensen et al.,22 with slight modifications. Details are available as ESI.†The AfB1–oxime hapten (AfB1–CMO), synthesized according to Kolosova et al.,23 was employed for the preparation of the AfB1–BSA conjugate by the N-hydroxysuccinimide ester method as follows: 5.7 mg of AfB1–CMO were reacted overnight at room temperature with 5 mg of BSA dissolved in 0.15 M sodium bicarbonate pH 8.3 and the pure conjugate was obtained from gel-filtration, as described above. AfB1–BSA concentration was determined through the Brilliant Blue Coomassie method.
Conjugates were supplemented with 0.1% sodium azide and stored refrigerated.
Instrumentation
The biosensor, shown in Fig. 1, was assembled employing a previously described CCD-based contact imaging configuration.10,24 In particular, the LFIA strip was placed directly in contact with the thermoelectrically-cooled CCD sensor through a round fiber optic taper. A mask was used to ensure reproducible strip positioning. This assembly was enclosed in a dark box to provide shielding from ambient light. During the acquisition the CCD sensor temperature was kept at −10 °C.Assay procedure
The nitrocellulose strip was placed horizontally on the larger fiber optic taper surface, then the LFIA assay was started by depositing on the bottom of the strip a volume of 100 μL of solution, containing 40 μL of PBS with 3% BSA (w/v) and 0.1% Tween 20 (v/v), 5 μL of HRP-labeled goat anti-rabbit antibody diluted 1![[thin space (1/6-em)]](https://www.rsc.org/images/entities/char_2009.gif) :500 (v/v) in PBS, 5 μL of rabbit anti-FmB1 and anti-AfB1 antibody, each diluted 1:500 (v/v) in PBS, and 50 μL of the maize sample extract (or blank maize sample extract for the blank, or FmB1 and AfB1 standard solutions prepared in blank maize sample extract to produce calibration curves). Upon complete migration of the solution (10 min), the strip was washed by flowing 100 μL of PBS for 10 min. Then 70 μL of the CL substrate was added at the bottom of the strip and let flow through the membrane (4 min), which was kept at 25 °C. The CL signal was acquired with the contact CCD-based imaging device (5 s acquisition time). Total analysis time was about 30 min. The scheme of the multiplex CL-LFIA assay on the nitrocellulose strip is showed in Fig. 1. To obtain quantitative information, the mean photon emission was measured in the areas corresponding to C-line and T-lines of the LFIA strip and each was subtracted of the mean background signal measured in two adjacent areas below and above the line. The T-line/C-line ratio was calculated for each analyte and then converted into B/B0 ratio by dividing it for the T-line/C-line ratio measured in the absence of the target analyte (B0, i.e., maximum T-line/C-line value). Calibration curves were obtained by plotting B/B0 values against the log of analyte concentration and fitting the experimental data with a four-parameter logistic equation. Linearization of the calibration curve was obtained through the logit–log transformation, by plotting the logit of the B/B0 ratio (as a percentage) against the log of analyte concentration. The best data fit was obtained by linear regression of the standard points.
:500 (v/v) in PBS, 5 μL of rabbit anti-FmB1 and anti-AfB1 antibody, each diluted 1:500 (v/v) in PBS, and 50 μL of the maize sample extract (or blank maize sample extract for the blank, or FmB1 and AfB1 standard solutions prepared in blank maize sample extract to produce calibration curves). Upon complete migration of the solution (10 min), the strip was washed by flowing 100 μL of PBS for 10 min. Then 70 μL of the CL substrate was added at the bottom of the strip and let flow through the membrane (4 min), which was kept at 25 °C. The CL signal was acquired with the contact CCD-based imaging device (5 s acquisition time). Total analysis time was about 30 min. The scheme of the multiplex CL-LFIA assay on the nitrocellulose strip is showed in Fig. 1. To obtain quantitative information, the mean photon emission was measured in the areas corresponding to C-line and T-lines of the LFIA strip and each was subtracted of the mean background signal measured in two adjacent areas below and above the line. The T-line/C-line ratio was calculated for each analyte and then converted into B/B0 ratio by dividing it for the T-line/C-line ratio measured in the absence of the target analyte (B0, i.e., maximum T-line/C-line value). Calibration curves were obtained by plotting B/B0 values against the log of analyte concentration and fitting the experimental data with a four-parameter logistic equation. Linearization of the calibration curve was obtained through the logit–log transformation, by plotting the logit of the B/B0 ratio (as a percentage) against the log of analyte concentration. The best data fit was obtained by linear regression of the standard points.
Analysis of maize samples
Maize flour samples were obtained directly from producers or mills. Fumonisin content was determined by HPLC-UV as previously described.25 AfB1 contamination was assessed by a commercial ELISA kit (EuroClone SpA, Milano, Italy).Maize flour samples were subjected to a pre-analytical extraction procedure previously described.10 Briefly, 1 g of maize flour was suspended in 10 mL of PBS buffer, hand-shaken for 3 min at RT and let settle for 5 min. Then, a 100 μL aliquot of the supernatant was heated for 3 min at 100 °C to inactivate endogenous maize peroxidase, then cooled to room temperature and subjected to analysis by LFIA. Heating was performed on a indium-tin oxide (ITO)-coated glass (SPI Supplies/Structure Probe Inc., West Chester, PA) employing a Frame-Seal slide chamber (Bio-Rad Laboratories, Hercules, CA) to contain the sample and avoid evaporation. To obtain the analyte concentration value for each sample, its B/B0 value was calculated as described above and interpolated on a stored calibration curve.
Results and discussion
A duplex indirect competitive CL-LFIA was developed by depositing on a test strip AfB1–BSA and FmB1–BSA on T-lines and goat anti-rabbit antibody on a unique C-line. With this format, each of the two analytes present in the sample competes with its corresponding immobilized hapten for binding the specific anti-AfB1 or anti-FmB1 rabbit antibodies, which are in turn detected by employing HRP-conjugated anti-rabbit antibody and CL detection. Anti-rabbit antibodies immobilized on the C-line allow confirmation of correct test development by capturing any rabbit-antibody-based signal reagent (i.e. the presence of the signal indicated the correct migration of the reactants along the strip). Moreover, normalizing the signal of T-lines with respect to that of C-line allows correction of environmental and matrix factors that might affect the intensity of CL signals on the strip (i.e. changes in room temperature or the presence of HRP inhibitors in the sample), thus providing a strip-to-strip normalization factor. Indeed, as previously reported,25 it is expected that the C-line intensity is fairly independent from analytes concentration.Signals were detected employing an ultrasensitive cooled CCD sensor employed in a “contact imaging” approach, as previously described. As shown in Fig. 1C, a 4 mm distance between adjacent lines was sufficient to prevent interference in signal detection. According to the competitive immunoassay principle, the light emission intensity of the T-lines gradually decreased up to their complete disappearance as the concentration of the respective analyte in the sample increased, while the C-line intensity was employed as a normalization value.
Optimization of experimental parameters
Assay parameters (concentration of immunoreagents and selection of the saturation agent) were optimised to generate assays with limits of detection (LODs) and dynamic ranges useful for detecting AfB1 and FmB1 in maize samples below regulatory limits. Furthermore, the methods were optimized considering that in order to detect simultaneously both analytes, the three lines on a strip should provide a similar signal intensity. This ensures the possibility to use a single integration time for the simultaneous measurement of the CL signals on a strip, preventing cross-talk phenomena.The concentrations of primary and secondary antibodies yielding the highest detectability for FmB1 and AfB1 were evaluated. The optimal concentration of anti-fumonisin (1:500 v/v), anti-aflatoxin (1:500 v/v) and HRP-labelled anti-rabbit (1:500 v/v) was selected as the dilution that provides the highest detectability and the best compromise between the effects described above. Data referring to the optimization of the immunoreagents dilution are available as ESI.†
Furthermore, different protocols were assayed for saturating the nitrocellulose membrane, thus reducing nonspecific adsorption of the immunoreagents and increasing the signal intensity of the lines, as previously shown.25 In particular, different saturation agents (BSA, non fat dry milk, soybean milk) and additives in the running buffer were tested. The best performance was obtained by incubating the nitrocellulose strips with 1% BSA (w/v) in PBS buffer for 5 min at room temperature and by adding 3% BSA (w/v) and 0.1% Tween 20 (v/v) in the running buffer.
Finally, the absence of cross reactivity (CR) between the two analytes was checked by running each primary antibody in the absence of analytes in solution. As shown in Fig. 2, no CR between anti-fumonisin antibody and AfB1 (left panel), nor between anti-aflatoxin and FmB1 (right panel) was observed, as confirmed by the absence of the upper and lower T-lines, respectively.
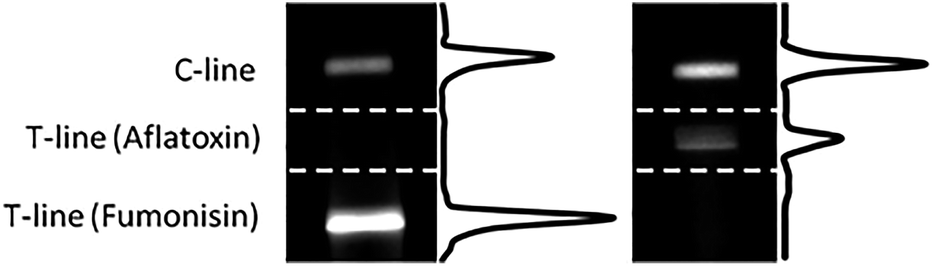 | ||
| Fig. 2 Chemiluminescence images and intensity profiles of nitrocellulose membranes in which anti-aflatoxin and anti-fumonisin antibodies separately ran in the absence of analytes. | ||
Specificity of the immunoreagents
The specificity of the immunoassays was determined towards structurally related and unrelated mycotoxins by measuring the IC50 value for each compound of interest, i.e., the concentration of the tested compound providing a response at the 50% bound (midrange of the curve). The CR values were calculated as the ratio of the IC50 value for the analyte over the IC50 value of the tested interfering compound. The anti-aflatoxin antibody showed low CR with AfG2 and AfB2 (below 2%) and higher for AfG1 (38%). The anti-fumonisin antibody showed about 100% CR with FmB2, thus showing its ability to detect type-B fumonisins present in the sample, as the sum of FmB1 and FmB2.Both antibodies showed very low CR towards zearalenone, deoxynilvalenol, and ochratoxin A, as shown in Table 1.
| Anti-fumonisin antibody | Anti-aflatoxin antibody | |
|---|---|---|
| Fumonisin B1 | 100% | <0.02% |
| Fumonisin B2 | 97% | <0.02% |
| Aflatoxin B1 | <0.02% | 100% |
| Aflatoxin B2 | <0.02% | 2% |
| Aflatoxin G1 | <0.02% | 2% |
| Aflatoxin G2 | <0.02% | 38% |
| Zearalenone | <0.02% | 0.2% |
| Deoxynilvalenol | <0.02% | 0.8% |
| Ochratoxin A | <0.02% | 2% |
The characteristics of the employed antibodies make the multiplex assay particular relevant for regulatory purposes. Indeed, EU regulations define limit values for fumonisin as the sum of FmB1 and FmB2.6 In addition, while limit values for aflatoxins are reported as the sum of AfB1, AfB2, AfG1, and AfG2, it is important to note that the ability to singularly detect the concentration of AfB1 is particularly relevant, being this mycotoxin listed as a group 1 carcinogen by the International Agency for Research on Cancer.4 Finally, negligible CR of the antibodies towards structurally unrelated mycotoxins considerably reduces the risk for false positive results.
Calibration curves
Calibration curves were generated by using standard solutions produced in blank maize flour sample extracts in the range between 0.2 and 1500 μg L−1 and 0.06 and 50 μg L−1 of FmB1 and AfB1, respectively. Calibration curves were produced first by working in a single assay; in particular both primary antibodies were added in all the strips, while the two analytes were assayed separately. As shown in Fig. 3, being a competitive type format, the decrease of T-line/C-line ratio was directly proportional to the amount of the analyte in the sample (the T-lines completely disappeared at the highest FmB1 and AfB1 concentration).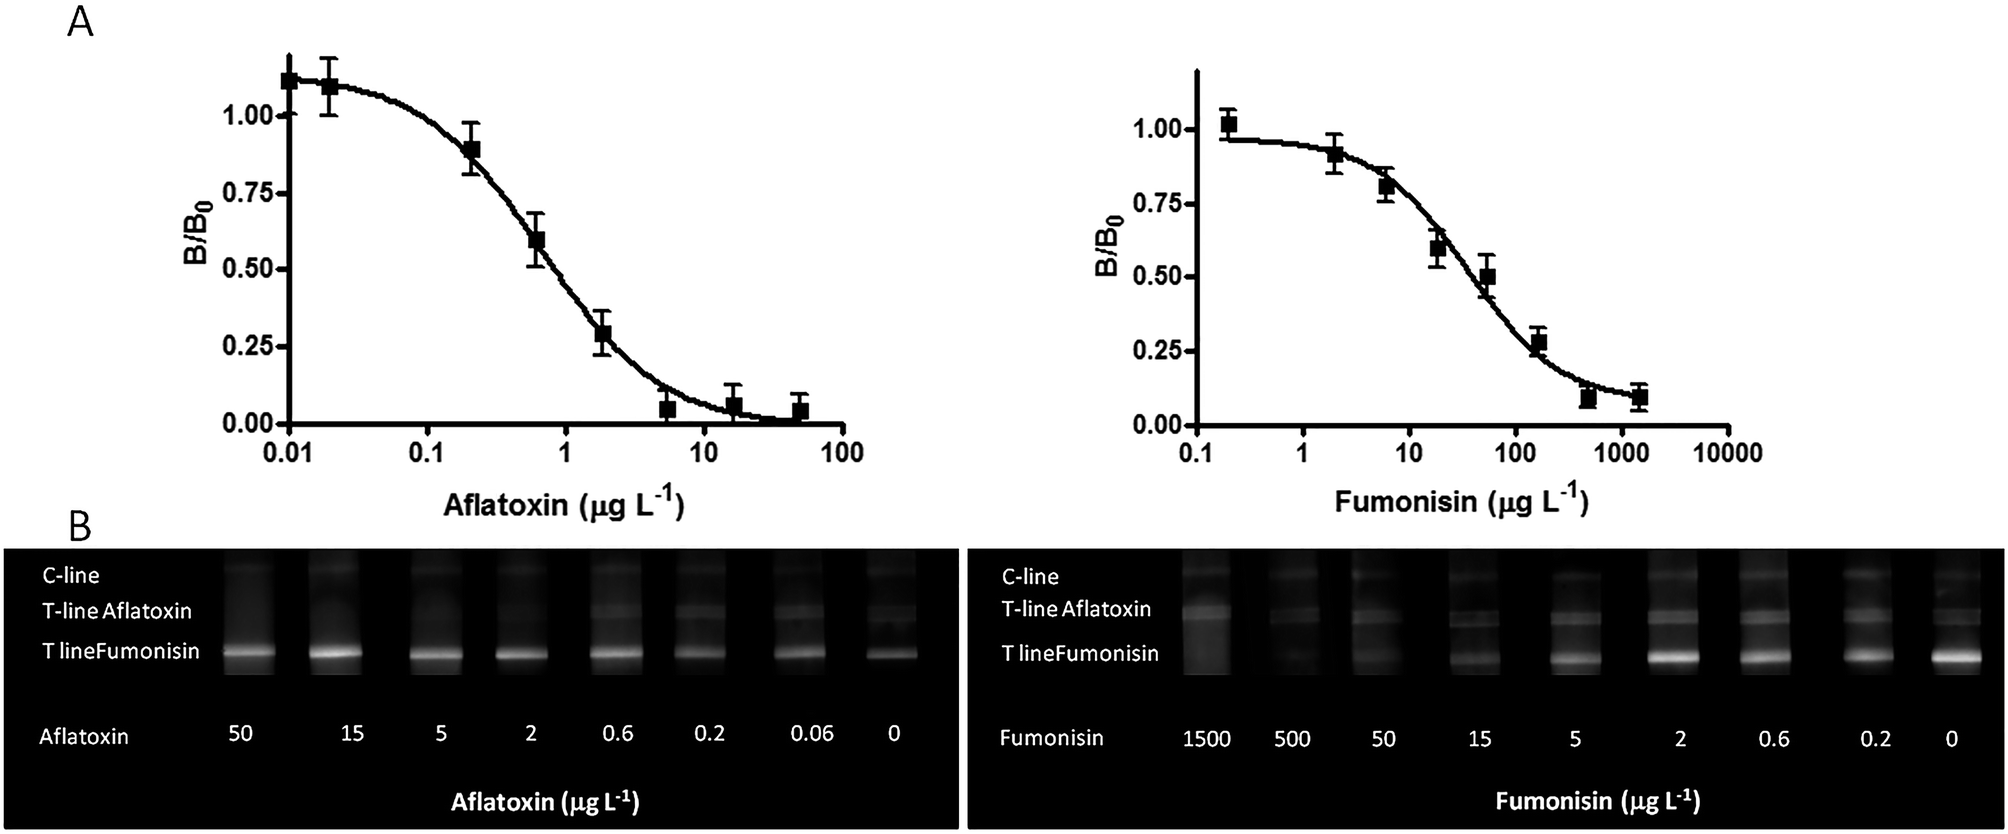 | ||
| Fig. 3 (A) Calibration curve obtained for AfB1 and FmB1 employing the contact imaging detection device. The curve fitting was performed employing a four-parameter logistic equation. Error bars = ±SD, n = 3. (B) Chemiluminescence images of LFIA membranes acquired with the contact imaging detection device. | ||
The limit of detection (LOD) was calculated as the concentration corresponding to the blank T-line/C-line value minus three times the blank standard deviation. The obtained values were 0.6 μg L−1 FmB1 and 0.15 μg L−1 AfB1, corresponding respectively to 6 μg kg−1 and 1.5 μg kg−1 in maize flour samples (according to the extraction procedure employed in this work). The dynamic range of the method extended from 0.6 to 1500 μg L−1 for FmB1 and from 0.15 to 50 μg L−1 for AfB1, with a midpoint value at 40 μg L−1 and 0.9 μg L−1, respectively.
The LOD values obtained for FmB1 and AfB1 are comparable or lower than those reported in the literature employing a CL-LFIA10 or colloidal gold based LFIA assays,25−28 as well as when compared with commercial assays (Table 2). The obtained results are comparable with those of recently published articles which describe the use of indirect competitive LFIA based on colorimetric detection for a multiple semi-quantitative determination of Fusarium mycotoxins in cereals19 and for the simultaneous quantification of ZEA and FmB1 in corn and wheat.18 The results of repeated calibration curves demonstrated a good reproducibility, the relative standard deviation associated with each point of the calibration curve being 0.5–12 % for FmB1 and 0.5–7% for AfB1, respectively (3 calibration curves produced in separate runs for each analyte). Finally, calibration curves obtained separately for each analyte (although in the presence of both primary antibodies) were compared with those obtained by working in the multiplex format, adding in the same sample known amounts of both FmB1 and AfB1. To evaluate the possibility of accurately detecting each analyte, even when one is present at a higher concentration with respect to the other, multiplex calibration curves were generated either by increasing the amount of both analytes simultaneously, or by increasing the concentration of one analyte while decreasing that of the other.
| Fumonisin B1 | Aflatoxin B1 | |
|---|---|---|
| a As the sum of fumonisin B1 and B2. b Monoplex assay format, offered for a variety of mycotoxins. Limits of detection are referred to total fumonisins or total aflatoxins concentration. | ||
| This work | 0.6 μg L−1 (6 μg kg−1)a | 0.15 μg L−1 (1.5 μg kg−1) |
| Mirasoli et al. 2012 (ref. 10) | 2.5 μg L−1 (25 μg kg−1) | — |
| Anfossi et al. 2010 (ref. 25) | 12 μg L−1 (120 μg kg−1) | — |
| Anfossi et al. 2011 (ref. 26) | — | 0.1 μg L−1 (1 μg kg−1) |
| Molinelli et al. 2009 (ref. 27) | 199a μg kg−1 | |
| Wang et al. 2006 (ref. 28) | 1 μg L−1 | — |
| Lattanzio et al. 2012 (ref. 19) | 3200a μg kg−1 | — |
| Wang et al. 2013 (ref. 18) | 5.23 μg L−1 | — |
| Reveal® (Neogen Corporation)b | 1 mg kg−1 | 20 μg L−1 |
| Agrastrip (Romer Labs)a | 0.2 mg kg−1 | 4 μg L−1 |
| Quick tox (EnviroLogix)a | 3200 μg kg−1 | 20 μg L−1 |
A representative series of CL images and the obtained calibration curves are shown in Fig. 4.
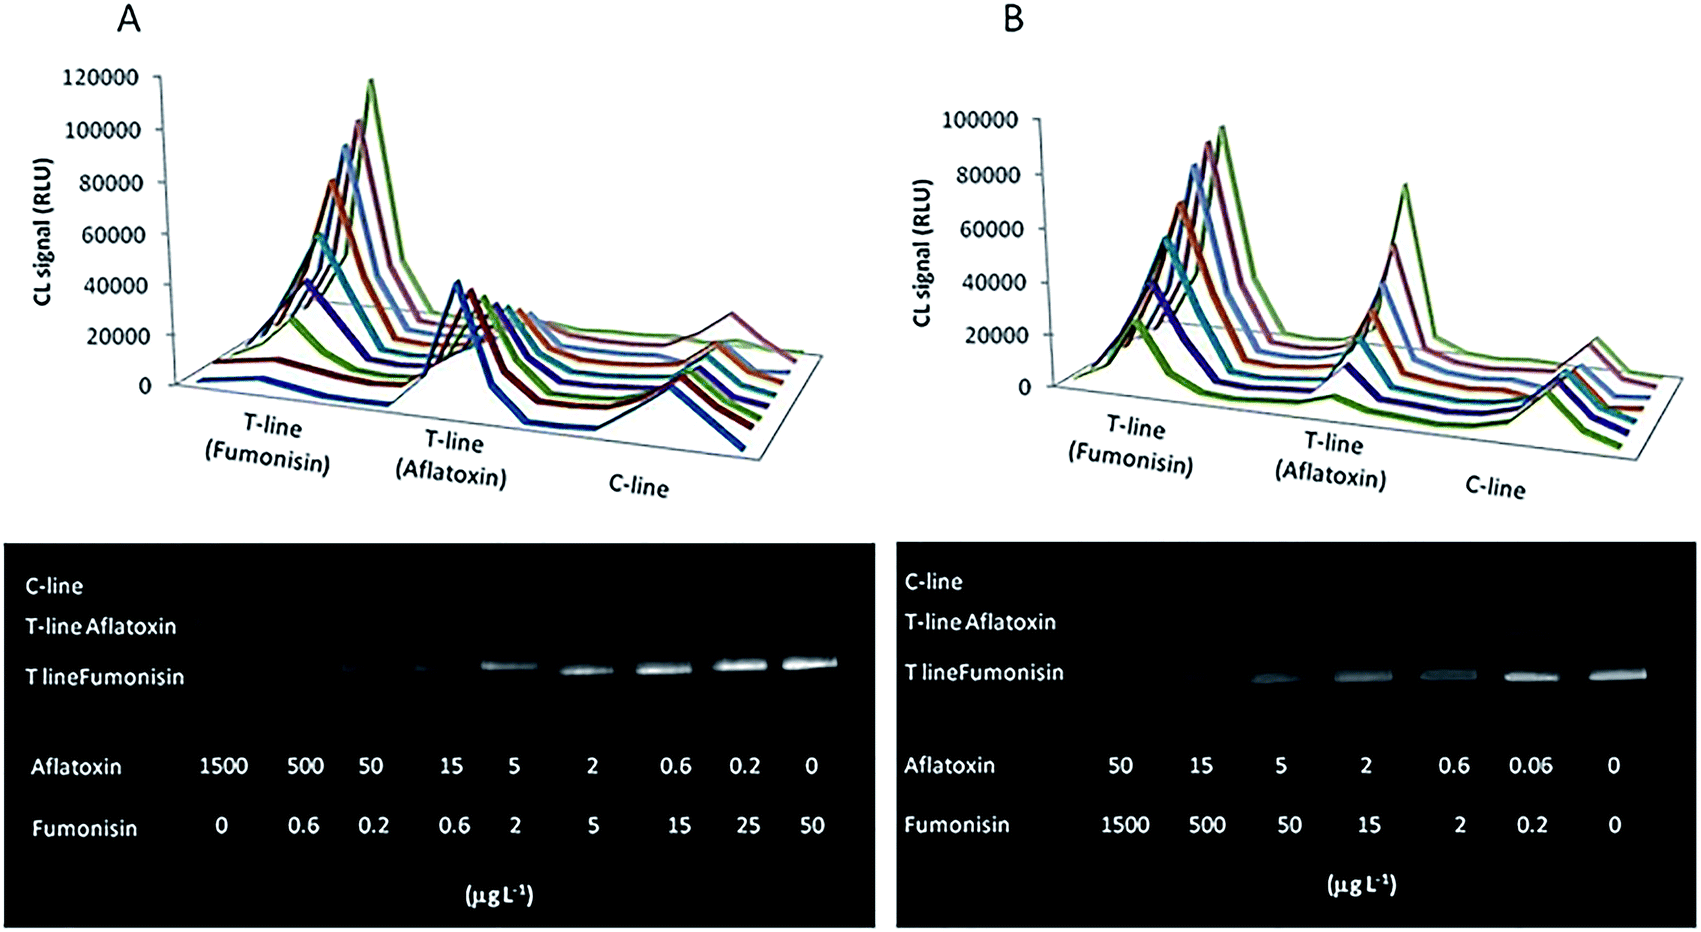 | ||
| Fig. 4 Chemiluminescence images and intensity profiles of LFIA membranes obtained by increasing the concentration of one analyte and decreasing the other (A) and increasing the amount of both analytes simultaneously (B). | ||
Results show that the simultaneous presence of the two analytes in the sample, even in disproportionate amounts, does not affect the light emission intensity of the other test line.
The LOD and the dynamic range obtained in the monoplex format were confirmed also by working in the multiplex assay, making it possible to detect and quantify the two mycotoxins in a unique analysis. This indicates that multiplex competitive assays on a single test strip can produce quantitative assays without loss in assay detectability as compared with single tests.
Maize flour samples
To enable multiplex assays in a point-of-use format, a simple and rapid sample preparation procedure, providing good recovery for all the analytes of interest, must be employed. It has been previously shown that extraction in aqueous media at close to neutral pH values provides good recovery for both aflatoxins26 and fumonisins.25 Furthermore, the absence of organic solvents in the extraction solution makes the procedure more environmental-friendly and avoids problems of disruption of antigen–antibody binding. Thus, maize flour samples were subjected to extraction in PBS buffer, followed by rapid extract heating to inactivate peroxidase enzymes naturally present in maize (which was performed employing a portable system suitable for point-of-use applications). The whole analytical procedure, including sample preparation, lasted approximately for 30 min.The assay analytical performance was evaluated by analyzing pooled extracts from blank maize flour samples (previously analyzed by ELISA) fortified by adding known amounts of both FmB1 (166, 18 and 2 μg L−1) and AfB1 (1.8, 0.6 and 0.21 μg L−1), corresponding approximately to 0.9, 0.6 and 0.3 B/B0 values on the respective calibration curve. The recovery ranged from 80 to 115%, while coefficients of variation below 20% were obtained (Table 3).
| Expected concentration (μg L−1) | CL-LFIA (μg L−1) | Recovery (%) | Expected concentration (μg L−1) | CL-LFIA (μg L−1) | Recovery (%) |
|---|---|---|---|---|---|
| (A) Maize flour extracts fortified with fumonisin B1 and aflatoxin B1 | (B) Maize flour samples | ||||
| Fumonisin | Fumonisin | ||||
| 166 | 148 (CV% = 5) | 89 | 470 | 480 (CV% = 20) | 102 |
| 18 | 15 (CV% = 15) | 83 | 80 | 87 (CV% = 12) | 109 |
| 2.0 | 2.3 (CV% = 13) | 115 | 10 | 12 (CV% = 15) | 120 |
| Aflatoxin | Aflatoxin | ||||
| 1.8 | 1.7 (CV% = 19) | 94 | 0.45 | 0.43 (CV% = 10) | 96 |
| 0.60 | 0.69 (CV% = 12) | 116 | 0.57 | 0.58 (CV% = 10) | 102 |
| 0.21 | 0.20 (CV% = 14) | 95 | 0.50 | 0.44 (CV% = 15) | 88 |
The performance of the multiplex LFIA method was also evaluated on real samples and results were compared with those obtained by confirmatory analyses, performed by HPLC-UV (FmB1 + FmB2 content) and a commercial ELISA kit (AfB1). Results, reported in Table 3 show a good agreement between CL-LFIA and reference methods for both mycotoxins in all samples, with recovery values ranging from 88 to 120% and the coefficient of variation below 20%. A picture of the membranes used for the analyses of the maize samples is reported in Fig. 5.
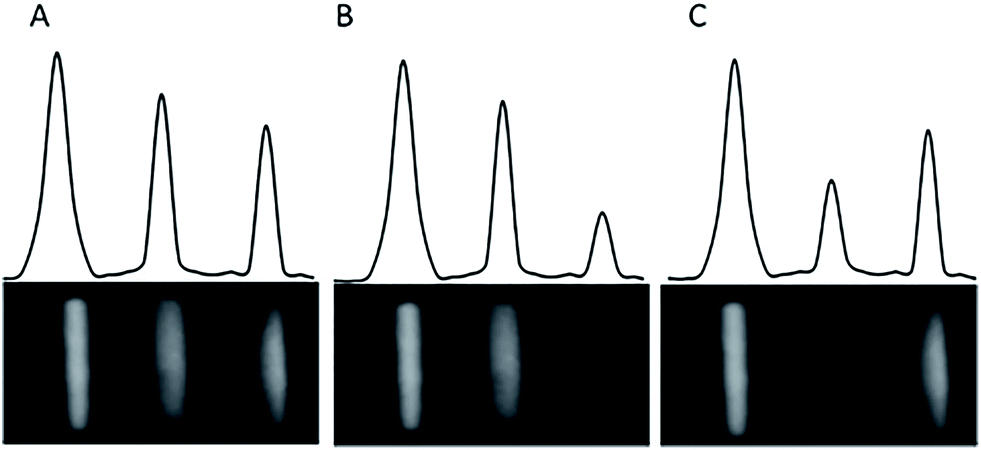 | ||
| Fig. 5 Chemiluminescence images of LFIA membranes used for analyses of maize samples. The membrane A is negative for all toxins, B is positive for AfB1 and C is positive for type B-Fm. | ||
Conclusions
The results show that the multiplex biosensor provides reliable results, with performances comparable with those obtained employing reference methods. The extraction procedure fulfils the requirements for the development of a method that can be applied on site. The co-extraction of the two mycotoxins, although based on a simple manual extraction with aqueous buffer and rapid heating system employing a portable manifold, shows satisfactory recoveries. The method is rapid (total analysis time: 30 min), simple, cost effective and can be performed in a non-laboratory environment by non-specialists.The possibility to detect simultaneously two analytes, providing quantitative results within current regulatory limits, reduces the number of analysis and allows to screen on site a large number of samples, thus reducing the costs for transporting and analyzing samples in the laboratory. This allows performing frequent analyses monitoring the entire production chain (e.g., on field, at harvest, during storage and transportation) according to the HACCP procedures. In the future, it will be possible to further increase the number of analytes by adding other test lines, provided the compatibility with the antibody employed in the immunoassay.
Ongoing work is devoted to the development of a ready-to-use cartridge containing the LFIA strip and all the reagents necessary per a complete analysis, in order to facilitate point-of-use applications.
Notes and references
- B. B. Dzantiev, N. A. Byzova, A. E. Urusov and A. V. Zherdev, Trends Anal. Chem., 2014, 55, 81–93 CrossRef CAS PubMed.
- R. Krska, P. Schubert-Ullrich, A. Molinelli, M. Sulyok, S. MacDonald and C. Crews, Food Addit. Contam., 2008, 25, 152–163 CrossRef CAS PubMed.
- Codex Alimentarius, Codex standard for durum wheat semolina and durum wheat flour 178-1991 (Rev. 1-1995), FAO/WHO, Rome, 1991 Search PubMed.
- International Agency for Research on Cancer, IARC, 1993, pp. 301–366, IARC (1993) International Agency for Research in Cancer, Lyon, France, IARC 57:427–794.
- M. Edite Bezerra da Rocha, F. d. O. Freire, F. Erlan Feitosa Maia, M. Izabel Florindo Guedes and D. Rondina, Food Control, 2014, 36, 159–165 CrossRef PubMed.
- Commission Regulation EC No 1881/2006, Off J Eur Union 364:5–24, 2006; Commission regulation (EC) No 1126/2007, Off J Eur Union 255:14–17, 2007.
- I. Y. Goryacheva, S. De Saeger, S. A. Eremin and C. Van Peteghem, Food Addit. Contam., 2007, 24, 1169–1183 CrossRef CAS PubMed.
- L. Anfossi, C. Baggiani, C. Giovannoli, G. D'Arco and G. Giraudi, Anal. Bioanal. Chem., 2013, 405, 467–480 CrossRef CAS PubMed.
- R. Krska and A. Molinelli, Anal. Bioanal. Chem., 2009, 393, 67–71 CrossRef CAS PubMed.
- M. Mirasoli, A. Buragina, L. S. Dolci, P. Simoni, L. Anfossi, G. Giraudi and A. Roda, Biosens. Bioelectron., 2012, 32, 283–287 CrossRef CAS PubMed.
- A. Roda, M. Mirasoli, M. Guardigli, E. Michelini, P. Simoni and M. Magliulo, Anal. Bioanal. Chem., 2006, 384, 1269–1275 CrossRef CAS PubMed.
- M. Magliulo, M. Mirasoli, P. Simoni, R. Lelli, O. Portanti and A. Roda, J. Agric. Food Chem., 2005, 53, 3300–3305 CrossRef CAS PubMed.
- M. Mirasoli, M. Guardigli, E. Michelini and A. Roda, J. Pharm. Biomed. Anal., 2014, 87, 36–52 CrossRef CAS PubMed.
- I. H. Cho, E. H. Paek, Y. K. Kim, J. H. Kim and S. H. Paek, Anal. Chim. Acta, 2009, 632, 247–255 CrossRef CAS PubMed.
- M. Mirasoli, A. Buragina, L. S. Dolci, M. Guardigli, P. Simoni, A. Montoya, E. Maiolini, S. Girotti and A. Roda, Anal. Chim. Acta, 2012, 721, 167–172 CrossRef CAS PubMed.
- H.-A. Joung, Y. K. Oh and M.-G. Kim, Biosens. Bioelectron., 2014, 53, 330–335 CrossRef CAS PubMed.
- B. Ngom, Y. Guo, X. Wang and D. Bi, Anal. Bioanal. Chem., 2010, 397, 1113–1135 CrossRef CAS PubMed.
- Y. Wang, Y. Yan, W. Ji, H. Wang, S. Li, Q. Zou and J. Sun, J. Agric. Food Chem., 2013, 61, 5031–5036 CrossRef CAS PubMed.
- V. M. T. Lattanzio, N. Nivarlet, V. Lippolis, S. Della Gatta, A. C. Huet, P. Delahaut, B. Granier and A. Visconti, Anal. Chim. Acta, 2012, 718, 99–108 CrossRef CAS PubMed.
- P. Li, Z. Zhang, Q. Zhang, N. Zhang, W. Zhang, X. Ding and R. Li, Electrophoresis, 2012, 33, 2253–2265 CrossRef CAS PubMed.
- E. Njumbe Ediage, J. D. Di Mavungu, I. Y. Goryacheva, C. Van Peteghem and S. De Saeger, Anal. Bioanal. Chem., 2012, 403, 265–278 CrossRef CAS PubMed.
- H. R. Christensen, F. Y. Yu and F. S. Chu, J. Agric. Food Chem., 2000, 48, 1977–1984 CrossRef CAS PubMed.
- A. Y. Kolosova, W. B. Shim, Z. Y. Yang, S. A. Eremin and D. H. Chung, Anal. Bioanal. Chem., 2006, 384, 286–294 CrossRef CAS PubMed.
- A. Roda, M. Mirasoli, L. S. Dolci, A. Buragina, F. Bonvicini, P. Simoni and M. Guardigli, Anal. Chem., 2011, 83, 3178–3185 CrossRef CAS PubMed.
- L. Anfossi, M. Calderara, C. Baggiani, C. Giovannoli, E. Arletti and G. Giraudi, Anal. Chim. Acta, 2010, 682, 104–109 CrossRef CAS PubMed.
- L. Anfossi, G. D'Arco, M. Calderara, C. Baggiani, C. Giovannoli and G. Giraudi, Food Addit. Contam., Part A, 2011, 28, 226–234 CrossRef CAS PubMed.
- A. Molinelli, K. Grossalber and R. Krska, Anal. Bioanal. Chem., 2009, 395, 1309–1316 CrossRef CAS PubMed.
- S. Wang, Y. Quan, N. Lee and I. R. Kennedy, J. Agric. Food Chem., 2006, 54, 2491–2495 CrossRef CAS PubMed.
Footnote |
| † Electronic supplementary information (ESI) available. See DOI: 10.1039/c4an01613k |
| This journal is © The Royal Society of Chemistry 2015 |