Vapor-induced chiroptical switching in chiral cyclometalated platinum(II) complexes with pinene functionalized C^N^N ligands†
Xiao-Peng
Zhang
,
Tao
Wu
,
Jian
Liu
,
Jing-Xuan
Zhang
,
Cheng-Hui
Li
* and
Xiao-Zeng
You
*
State Key Laboratory of Coordination Chemistry, School of Chemistry and Chemical Engineering, Nanjing National Laboratory of Microstructures, Nanjing University, Nanjing 210093, P.R. China. E-mail: chli@nju.edu.cn; youxz@nju.edu.cn; Fax: +86-25-83314502; Tel: +86-25-83592969
First published on 28th October 2013
Abstract
A new couple of enantiomeric chiral cyclometalated platinum(II) complexes Pt(La)(C![[triple bond, length as m-dash]](https://www.rsc.org/images/entities/char_e002.gif) C–Ph) (1a) and Pt(Lb)(C
C–Ph) (1a) and Pt(Lb)(C![[triple bond, length as m-dash]](https://www.rsc.org/images/entities/char_e002.gif) C–Ph) (1b) (La = (−)-4,5-pinene-6′-phenyl-2,2′-bipyridine, Lb = (+)-4,5-pinene-6′-phenyl-2,2′-bipyridine) have been designed and synthesized. These complexes were found to undergo crystal transformation upon exposure to dichloromethane vapor, resulting in slight changes of vapochromism/vapoluminescence but very distinct chiroptical switching behaviour. Single crystal X-ray diffraction studies revealed that the two polymorphs (Form-Y and Form-O) of complexes 1a/1b display dissimilar molecular arrangements as well as inter-molecular interactions, which are responsible for the switching behaviour in electronic circular dichroism (ECD) and vibrational circular dichroism (VCD) spectra. The vapor-induced chiroptical switching behaviour in these platinum(II) complexes is unique and may lead to novel chiroptical sensing applications.
C–Ph) (1b) (La = (−)-4,5-pinene-6′-phenyl-2,2′-bipyridine, Lb = (+)-4,5-pinene-6′-phenyl-2,2′-bipyridine) have been designed and synthesized. These complexes were found to undergo crystal transformation upon exposure to dichloromethane vapor, resulting in slight changes of vapochromism/vapoluminescence but very distinct chiroptical switching behaviour. Single crystal X-ray diffraction studies revealed that the two polymorphs (Form-Y and Form-O) of complexes 1a/1b display dissimilar molecular arrangements as well as inter-molecular interactions, which are responsible for the switching behaviour in electronic circular dichroism (ECD) and vibrational circular dichroism (VCD) spectra. The vapor-induced chiroptical switching behaviour in these platinum(II) complexes is unique and may lead to novel chiroptical sensing applications.
Introduction
The manipulation of molecular chirality in chiral materials is of vital importance as it can lead to promising applications in various high-technology fields, such as chiroptical sensing, optical displays, and information storage.1 So far, chirality manipulation has been commonly achieved by applying external stimuli such as heat, light, pressure, solvent, reducing/oxidizing agents, and so on.2 The mechanism for the tuning in chirality is mainly due to the change in molecular structure. In some cases, a change in molecular packing due to crystal-to-crystal transformation also causes a significant change in chiroptical properties, and therefore providing a novel way to control the material chirality in solid states.3Circular dichroism (CD) spectroscopy, including electronic CD (ECD) and vibrational CD (VCD), is the most convenient and effective technique for characterizing the structures of chiral compounds and monitoring the chirality manipulation processes.4,5 As compared to the numerous reports on solution CD spectra, the investigations of solid-state CD spectra are relatively sparse in the literature, mainly due to the inevitable artefacts in the measurement6 as well as the difficulty in interpretation of solid-state CD (large demand for computational resources when performing theoretical calculations). However, solid-state CD spectra contain much more structural information about intra- and inter-molecular interactions.3,7 They are particularly useful for monitoring the chirality manipulation processes in the solid state. Therefore, solid-state CD spectroscopy is receiving increasing attention in recent years and has led to interesting findings.7
Platinum(II) complexes have been frequently found to show stimuli-responsive properties (vapochromism/vapoluminescence, mechanochromism, and thermochromism),8 which can have potential applications in vapochromic light-emitting diodes (LEDs), vapochromic photo-diodes and electronic nose devices.9 Generally, these interesting stimuli-responsive behaviours mostly originate from the change of Pt(II)–Pt(II) contacts, π–π stacking, hydrogen bonding and/or C–H–π interactions.10 In some cases, the direct complexation between the analyte and the metal ion, conformational conversion or other inducing mechanisms are also responsible for the change in properties.11 To date, most of the platinum(II) complexes only change their absorption and/or emission properties, an alternation of chiroptical properties upon external stimuli (i.e. chiroptical sensors) is limited.12
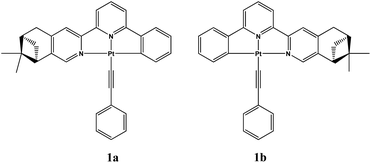
We have previously studied crystalline-to-amorphous transformation of chiral platinum(II) complexes in solid states by CD spectroscopy.12c Herein, we synthesized a new couple of enantiomeric cyclometalated platinum(II) complexes containing pinene functionalized chiral C^N^N ligands: Pt(La)(C![[triple bond, length as m-dash]](https://www.rsc.org/images/entities/char_e002.gif) C–Ph) (1a) and Pt(Lb)(C
C–Ph) (1a) and Pt(Lb)(C![[triple bond, length as m-dash]](https://www.rsc.org/images/entities/char_e002.gif) C–Ph) (1b) (La = (−)-4,5-pinene-6′-phenyl-2,2′-bipyridine, Lb = (+)-4,5-pinene-6′-phenyl-2,2′-bipyridine) (Fig. 1). Interestingly, these complexes were found to undergo crystal transformation upon exposure to dichloromethane vapor. The ECD and VCD spectra are almost inverted after crystal transformation. The vapor-induced chiroptical switching behaviour in these platinum(II) complexes is unique and may lead to novel chiroptical sensing applications. Moreover, this work represents a rare example where the chirality can be switched by exposure to volatile organic vapor.13
C–Ph) (1b) (La = (−)-4,5-pinene-6′-phenyl-2,2′-bipyridine, Lb = (+)-4,5-pinene-6′-phenyl-2,2′-bipyridine) (Fig. 1). Interestingly, these complexes were found to undergo crystal transformation upon exposure to dichloromethane vapor. The ECD and VCD spectra are almost inverted after crystal transformation. The vapor-induced chiroptical switching behaviour in these platinum(II) complexes is unique and may lead to novel chiroptical sensing applications. Moreover, this work represents a rare example where the chirality can be switched by exposure to volatile organic vapor.13
Experimental
General methods
All reagents were purchased from commercial suppliers and used as received. Mass spectra were acquired on a time of flight mass spectrometer. 1H-NMR spectra were obtained on a DRX 500 NMR spectrometer. Chemical shifts are referenced to TMS. Coupling constants are given in Hertz. UV-Vis spectra were measured on a UV-3600 spectrophotometer. The powder XRD patterns were recorded on a Shimadzu XD-3A X-ray diffractometer. Photoluminescence (PL) spectra were measured using a Hitachi F-4600 PL spectrophotometer. The decay lifetimes were measured with an Edinburgh Instruments FLS920P fluorescence spectrometer in the solution and solid states at room temperature (RT).Synthesis
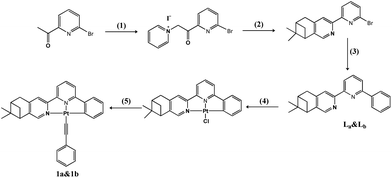
The synthesis of complexes 1a and 1b is outlined in Scheme 1. The ligands La and Lb were firstly prepared according to similar literature methods14 and a subsequent Suzuki coupling reaction. Chiral cyclometalated Pt(C^N^N)Cl complexes can be conveniently synthesized through a coordinated reaction between La/Lb and K2PtCl4 in refluxed acetic acid solution for 24 h.15 Complexes 1a and 1b were synthesized according to the Sonogashira method in the absence of light at room temperature.16 The detailed experiments are presented below.![[thin space (1/6-em)]](https://www.rsc.org/images/entities/char_2009.gif) :
:![[thin space (1/6-em)]](https://www.rsc.org/images/entities/char_2009.gif) 1. Yield: 82%. MS (EI) (m/z): [M]+ calcd for C17H17BrN2, 328.1; found, 328.0. 1H NMR (500 MHz, DMSO-d6): δ 8.35 (d, J = 7.5 Hz, 1H), 8.26 (s, 1H), 8.09 (s, 1H), 7.88 (t, J = 8.0 Hz, 1H), 7.66 (d, J = 8.0 Hz, 1H), 3.06 (m, 2H), 2.90 (t, J = 5.5 Hz, 1H), 2.69–2.73 (m, 1H), 2.30 (m, 1H), 1.40 (s, 3H), 1.14 (d, J = 9.5 Hz, 1H), 0.60 (s, 3H) (see Fig. S1, ESI†).
1. Yield: 82%. MS (EI) (m/z): [M]+ calcd for C17H17BrN2, 328.1; found, 328.0. 1H NMR (500 MHz, DMSO-d6): δ 8.35 (d, J = 7.5 Hz, 1H), 8.26 (s, 1H), 8.09 (s, 1H), 7.88 (t, J = 8.0 Hz, 1H), 7.66 (d, J = 8.0 Hz, 1H), 3.06 (m, 2H), 2.90 (t, J = 5.5 Hz, 1H), 2.69–2.73 (m, 1H), 2.30 (m, 1H), 1.40 (s, 3H), 1.14 (d, J = 9.5 Hz, 1H), 0.60 (s, 3H) (see Fig. S1, ESI†).
![[triple bond, length as m-dash]](https://www.rsc.org/images/entities/b_char_e002.gif) C–Ph) (1a).
In the absence of light, phenylacetylene (1.05 mmol) was added to an anhydrous dichloromethane solution of Pt(La)Cl (1 mmol), Et3N (1.5 mmol) and CuI (10 mg) under an argon atmosphere. After stirring at room temperature for 24 hours, the solvent was evaporated in vacuo, and the product was purified by chromatography on a silica gel column using hexane–EtOAc = 1
C–Ph) (1a).
In the absence of light, phenylacetylene (1.05 mmol) was added to an anhydrous dichloromethane solution of Pt(La)Cl (1 mmol), Et3N (1.5 mmol) and CuI (10 mg) under an argon atmosphere. After stirring at room temperature for 24 hours, the solvent was evaporated in vacuo, and the product was purified by chromatography on a silica gel column using hexane–EtOAc = 1![[thin space (1/6-em)]](https://www.rsc.org/images/entities/char_2009.gif) :
:![[thin space (1/6-em)]](https://www.rsc.org/images/entities/char_2009.gif) 1. Yield: 85%. MS (EI) (m/z): [M]+ calcd for C31H26N2Pt, 621.2; found, 621.1. 1H NMR (500 MHz, DMSO-d6): δ 8.58 (s, 1H), δ 8.36 (s, 1H), 8.15 (d, J = 8.0 Hz, 1H), 8.09 (t, J = 8.0 Hz, 1H), 7.96 (d, J = 7.5 Hz, 1H), 7.77 (d, J = 7.5 Hz, 1H), 7.63 (d, J = 8.0 Hz, 1H), 7.38 (d, J = 6.5 Hz, 2H), 7.29 (t, J = 7.5 Hz, 2H), 7.17 (t, J = 7.5 Hz, 1H), 7.13 (t, J = 7.5 Hz, 1H), 7.07 (t, J = 7.0 Hz, 1H), 3.14 (m, 2H), 3.06 (t, J = 5.5 Hz, 1H), 2.74–2.79 (m, 1H), 2.35 (m, 1H), 1.43 (s, 3H), 1.25 (d, J = 10.5 Hz, 1H), 0.68 (s, 3H) (see Fig. S4, ESI†).
1. Yield: 85%. MS (EI) (m/z): [M]+ calcd for C31H26N2Pt, 621.2; found, 621.1. 1H NMR (500 MHz, DMSO-d6): δ 8.58 (s, 1H), δ 8.36 (s, 1H), 8.15 (d, J = 8.0 Hz, 1H), 8.09 (t, J = 8.0 Hz, 1H), 7.96 (d, J = 7.5 Hz, 1H), 7.77 (d, J = 7.5 Hz, 1H), 7.63 (d, J = 8.0 Hz, 1H), 7.38 (d, J = 6.5 Hz, 2H), 7.29 (t, J = 7.5 Hz, 2H), 7.17 (t, J = 7.5 Hz, 1H), 7.13 (t, J = 7.5 Hz, 1H), 7.07 (t, J = 7.0 Hz, 1H), 3.14 (m, 2H), 3.06 (t, J = 5.5 Hz, 1H), 2.74–2.79 (m, 1H), 2.35 (m, 1H), 1.43 (s, 3H), 1.25 (d, J = 10.5 Hz, 1H), 0.68 (s, 3H) (see Fig. S4, ESI†).
![[triple bond, length as m-dash]](https://www.rsc.org/images/entities/b_char_e002.gif) C–Ph) (1b).
Coordination compound 1b was prepared using the same procedure as that used for 1a. MS (EI) (m/z): [M]+ calcd for C31H26N2Pt, 621.2; found, 621.1. 1H NMR (500 MHz, DMSO-d6): δ 8.58 (s, 1H), δ 8.36 (s, 1H), 8.15 (d, J = 8.0 Hz, 1H), 8.09 (t, J = 8.0 Hz, 1H), 7.96 (d, J = 7.5 Hz, 1H), 7.77 (d, J = 7.5 Hz, 1H), 7.63 (d, J = 8.0 Hz, 1H), 7.38 (d, J = 6.5 Hz, 2H), 7.29 (t, J = 7.5 Hz, 2H), 7.17 (t, J = 7.5 Hz, 1H), 7.13 (t, J = 7.5 Hz, 1H), 7.07 (t, J = 7.0 Hz, 1H), 3.14 (m, 2H), 3.06 (t, J = 5.5 Hz, 1H), 2.74–2.79 (m, 1H), 2.35 (m, 1H), 1.43 (s, 3H), 1.25 (d, J = 10.5 Hz, 1H), 0.68 (s, 3H).
C–Ph) (1b).
Coordination compound 1b was prepared using the same procedure as that used for 1a. MS (EI) (m/z): [M]+ calcd for C31H26N2Pt, 621.2; found, 621.1. 1H NMR (500 MHz, DMSO-d6): δ 8.58 (s, 1H), δ 8.36 (s, 1H), 8.15 (d, J = 8.0 Hz, 1H), 8.09 (t, J = 8.0 Hz, 1H), 7.96 (d, J = 7.5 Hz, 1H), 7.77 (d, J = 7.5 Hz, 1H), 7.63 (d, J = 8.0 Hz, 1H), 7.38 (d, J = 6.5 Hz, 2H), 7.29 (t, J = 7.5 Hz, 2H), 7.17 (t, J = 7.5 Hz, 1H), 7.13 (t, J = 7.5 Hz, 1H), 7.07 (t, J = 7.0 Hz, 1H), 3.14 (m, 2H), 3.06 (t, J = 5.5 Hz, 1H), 2.74–2.79 (m, 1H), 2.35 (m, 1H), 1.43 (s, 3H), 1.25 (d, J = 10.5 Hz, 1H), 0.68 (s, 3H).
CD spectra measurements
The solution UV-Vis and ECD spectra were recorded with a concentration of 3.75 × 10⁻⁵ mol L−1 (1a and 1b) in acetonitrile. The solution ECD spectra were recorded on a Jasco J-810 spectropolarimeter by using a 1 cm quartz cell. Conditions of measurements included a scanning speed of 100 nm min−1, a step size of 0.5 nm, a bandwidth of 2 nm, a response time of 1 s, standard sensitivity setting, and an accumulation of 5 scans at room temperature. The baseline was corrected by subtracting the signal of blank solution (acetonitrile) under the same conditions.Solid-state ECD spectra were recorded on a Jasco J-810 spectropolarimeter. Conditions of measurements included a scanning speed of 100 nm min−1, a step size of 0.5 nm, a bandwidth of 4 nm, a response time of 1 s, standard sensitivity setting, and an accumulation of 5 scans at room temperature. The baseline was corrected by subtracting the signal of the blank sample (nujol) under the same conditions. The solid-state samples were prepared by mixing the solid samples with nujol (4 mg samples mixed with 100 mg nujol) in a highly dispersed state.6,12c,17 Five samples were prepared and measured under the same conditions to avoid artefacts. The solid-state UV-Vis spectra were recorded with the same samples immediately after the corresponding ECD measurements.
The solution IR and VCD spectra were recorded on a VERTEX 80v Fourier transform infrared spectrometer equipped with a PMA 50 VCD/IRRAS module (Bruker, Germany) in the region of 1800–800 cm−1.18 The photoelastic modulator (PEM) was set to 1500 cm−1, the spectral resolution was 4 cm−1, and the zero filling factor was 4. For each set of measurements, a multiple-wave plate (CdS) combined with the second wire grid linear polarizer was employed to calibrate the phase of the lock-in amplifier. A demountable cuvette A145 with CaF2 with a 0.10 mm Teflon spacer was used. All sample solutions were dissolved in deuterated chloroform (CDCl3). The concentration of compounds 1a and 1b was 0.25 mol L−1. All VCD spectra were collected for 4 h composed of 12 blocks, each consisting of 1420 scans accumulated for 20 min. Baseline correction was performed with the spectra of a deuterated solvent using the same measurement setup as for VCD.
Solid-state IR and VCD spectra in the region of 1800–800 cm−1 were recorded on a VERTEX 80v Fourier transform infrared spectrometer equipped with a PMA 50 VCD/IRRAS module (Bruker, Germany). The setup and method of VCD measurements were the same as those of the solution conditions. A demountable cuvette A145 with CaF2 with a 0.10 mm Teflon spacer was used. All VCD spectra were collected for 4 h composed of 12 blocks, each consisting of 1420 scans accumulated for 20 min. Baseline correction was conducted with the spectra of the blank sample (fluorolube) using the same measurement setup as for VCD. The solid-state samples were prepared by mixing the solid samples with fluorolube (10 mg samples mixed with 340 mg fluorolube) in a highly dispersed state.7c,12c,19 Five samples were prepared and measured under the same conditions to avoid artefacts. The solid-state IR spectra were recorded with the same samples immediately after the corresponding VCD measurements.
X-ray structure determination
Single-crystal X-ray diffraction measurements were carried out on a Bruker SMART APEX CCD based on a diffractometer operating at room temperature. Intensities were collected with graphite monochromatized Mo Kα radiation (λ = 0.71073 Å) operating at 50 kV and 30 mA, in ω/2θ scan mode. The data reduction was made with the Bruker SAINT package.20 Absorption corrections were performed using the SADABS program.21 The structures were solved by direct methods and refined on F2 by full-matrix least-squares using SHELXL-97 with anisotropic displacement parameters for all non-hydrogen atoms in all two structures. Hydrogen atoms bonded to the carbon atoms were placed in calculated positions and refined as riding mode, with C–H = 0.93 Å (methane) or 0.96 Å (methyl) and Uiso(H) = 1.2Ueq. (Cmethane) or Uiso(H) = 1.5Ueq. (Cmethyl). The water hydrogen atoms were located in the difference Fourier maps and refined with an O–H distance restraint [0.85(1) Å] and Uiso(H) = 1.5 Ueq.(O). All computations were carried out using the SHELXTL-97 program package.22Computational details
For the solution VCD spectrum calculation, the crystal structure of 1a-Form-Y was used as the starting geometry. The geometry was fully optimized without any symmetry constraints. The effect of the solvent was modelled by the CPCM dielectric model with chloroform solution. For the calculation of solid state ECD and VCD spectra, the crystal structures of 1a-Form-Y and 1a-Form-O were used as the starting geometries. The geometries were used without optimization except for hydrogen atoms. The B3LYP functional was adopted, and the 18-valence electron Stuttgart small core relativistic pseudo-potentials with their corresponding optimized set of basis functions were employed for the Pt atom,23 while the standard split-valence 6-31G* basis set was used for all other atoms. All the calculations were carried out using the Gaussian03 program.24Results and discussion
Photophysical properties
The absorption and emission spectra of 1a and 1b in acetonitrile solution are typical for similar cyclometalated platinum(II) complexes (Table 1, Fig. 2, S5 and S6, ESI†).25 The UV-Vis spectra of 1a and 1b in acetonitrile solution exhibit characteristic transitions of aromatic chromophores in the band of 200–370 nm (ε > 104 L mol−1 cm−1) assignable to intra-ligand (IL) charge-transfer transitions, and a broad peak centering in the region of 370–500 nm (ε > 103 L mol−1 cm−1) which can be attributed to 1MLCT (metal-to-ligand charge transfer) mixed with some 1LLCT (ligand-to-ligand charge transfer) transitions.25 Upon excitation, complex 1a exhibits a structureless emission (λmax = ca. 560 nm) in acetonitrile solution at room temperature. In frozen MeOH–EtOH (v/v = 1![[thin space (1/6-em)]](https://www.rsc.org/images/entities/char_2009.gif) :
:![[thin space (1/6-em)]](https://www.rsc.org/images/entities/char_2009.gif) 4) glass at 77 K, the emission turns into a structured band [λmax = 531 nm (with shoulders at 568 and 625 nm)] with a blue-shift (30 nm) of emission maximum. The vibrational progressional spacings of structured emission at 77 K are ca. 1200 cm−1, which is the skeletal vibrational frequency of the aromatic rings. As compared to Pt(C^N^N)(C
4) glass at 77 K, the emission turns into a structured band [λmax = 531 nm (with shoulders at 568 and 625 nm)] with a blue-shift (30 nm) of emission maximum. The vibrational progressional spacings of structured emission at 77 K are ca. 1200 cm−1, which is the skeletal vibrational frequency of the aromatic rings. As compared to Pt(C^N^N)(C![[triple bond, length as m-dash]](https://www.rsc.org/images/entities/char_e002.gif) C–Ph), the absorption and emission of complexes 1a and 1b are blue-shifted as a result of the donicity of pinene groups which increases the LUMO energy level.25a
C–Ph), the absorption and emission of complexes 1a and 1b are blue-shifted as a result of the donicity of pinene groups which increases the LUMO energy level.25a
| 298 K | 77 K | |
|---|---|---|
a [Ru(bpy)3]Cl2 in degassed acetonitrile at 298 K (Φr = 0.062) as the reference.
b Measured in degassed acetonitrile solution at 298 K (concentration = 10−5 mol L−1), λex = 420 nm.
c Measured in frozen MeOH–EtOH (v/v = 1![[thin space (1/6-em)]](https://www.rsc.org/images/entities/char_2009.gif) : :![[thin space (1/6-em)]](https://www.rsc.org/images/entities/char_2009.gif) 4) glass at 77 K, λex = 420 nm.
d
Form-Y: yellow crystallites, λex = 460 nm.
e
Form-O: orange crystallites, λex = 470 nm. 4) glass at 77 K, λex = 420 nm.
d
Form-Y: yellow crystallites, λex = 460 nm.
e
Form-O: orange crystallites, λex = 470 nm.
|
||
| λ max (nm) (τ/ns; Φa) in fluid solutionb or alcoholic glassc | 560 (87; 0.061) | 531, 569 (sh), 625 (sh) |
| λ max (nm) (τ/ns) in solid-state of Form-Yd | 571 (264), 542 (sh) | 544, 585 (sh), 636 (sh) |
| λ max (nm) (τ/ns) in solid-state of Form-Oe | 579 (285) | 562, 606 (sh) |
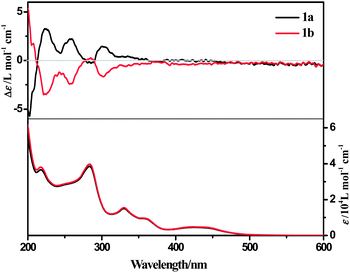 | ||
| Fig. 2 UV-Vis and ECD spectra of enantiomers of 1a and 1b (3.75 × 10⁻⁵ mol L−1) in acetonitrile solutions. | ||
Vapochromism/vapoluminescence
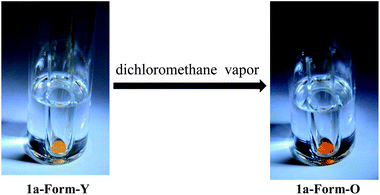
Complexes 1a/1b were firstly obtained as yellow powders after silica gel column chromatography purification (Form-Y). When exposed to dichloromethane vapor for several minutes, the Form-Y of complexes 1a and 1b were transformed into Form-O with orange color (Fig. 3). The emission and XRD patterns also changed accordingly (Fig. S5–S7, ESI†). The vapochromic properties were also investigated for other common volatile organic vapors, none of which can induce the color or luminescence changes within one hour. Such a high selectivity in vapochromism is rarely reported for platinum(II) complexes and can be useful in vapor detection.8 The high selectivity for CH2Cl2 vapor may be due to the abundant attractive and exoergic non-convalent interactions between CH2Cl2 and 1a or 1b molecules, which will affect the molecular structure and packing modes during crystal growth.26Crystal structure and absolute configuration
X-ray single crystal diffraction studies were performed in order to get insight into the vapochromic/vapoluminescent properties. Yellow rods of 1a/1b (Form-Y) were obtained by slowly evaporating the acetonitrile–acetone (v/v = 1![[thin space (1/6-em)]](https://www.rsc.org/images/entities/char_2009.gif) :
:![[thin space (1/6-em)]](https://www.rsc.org/images/entities/char_2009.gif) 4) solution at 0 °C, while orange blocks (Form-O) were grown in dichloromethane–acetone (v/v = 1
4) solution at 0 °C, while orange blocks (Form-O) were grown in dichloromethane–acetone (v/v = 1![[thin space (1/6-em)]](https://www.rsc.org/images/entities/char_2009.gif) :
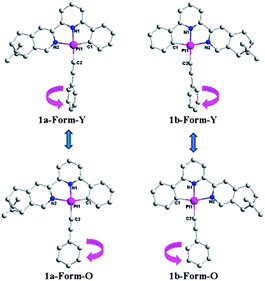
:![[thin space (1/6-em)]](https://www.rsc.org/images/entities/char_2009.gif) 3) at room temperature. As shown in Fig. 4, the molecules of 1a are mirror images of its enantiomer 1b in both forms, and therefore only crystal structures of complex 1a are described here. Both forms crystallize in the same chiral space group, P212121 of the orthorhombic system (Table 2) although they have different crystal morphologies (rod for Form-Y and block shape for Form-O, Fig. S8, ESI†). Only one molecule is included in the asymmetrical unit. The simulated XRD patterns from single crystal structures are in good agreement with the experimental ones, indicating the phase purity (Fig. S7, ESI†). Their absolute configurations are assigned as Λ according to the “skew line system” (Fig. S9, ESI†).27
3) at room temperature. As shown in Fig. 4, the molecules of 1a are mirror images of its enantiomer 1b in both forms, and therefore only crystal structures of complex 1a are described here. Both forms crystallize in the same chiral space group, P212121 of the orthorhombic system (Table 2) although they have different crystal morphologies (rod for Form-Y and block shape for Form-O, Fig. S8, ESI†). Only one molecule is included in the asymmetrical unit. The simulated XRD patterns from single crystal structures are in good agreement with the experimental ones, indicating the phase purity (Fig. S7, ESI†). Their absolute configurations are assigned as Λ according to the “skew line system” (Fig. S9, ESI†).27
| 1a-Form-Y | 1a-Form-O | 1b-Form-Y | 1b-Form-O | |
|---|---|---|---|---|
| Formula | C31H26N2Pt | C31H26N2Pt | C31H26N2Pt | C31H26N2Pt |
| M r/g mol−1 | 621.63 | 621.63 | 621.63 | 621.63 |
| Crystal system | Orthorhombic | Orthorhombic | Orthorhombic | Orthorhombic |
| Space group | P212121 | P212121 | P212121 | P212121 |
| a/Å | 6.2934(4) | 6.0349(4) | 6.2882(15) | 6.018(3) |
| b/Å | 11.9839(8) | 15.7571(11) | 11.994(3) | 15.716(8) |
| c/Å | 32.646(2) | 25.3332(18) | 32.734(8) | 25.260(12) |
| α/° = β/° = γ/° | 90.00 | 90.00 | 90.00 | 90.00 |
| V/Å3 | 2462.2(3) | 2409.0(3) | 2468.7(10) | 2389(2) |
| Z | 4 | 4 | 4 | 4 |
| T/K | 296(2) | 296(2) | 296(2) | 296(2) |
| Radiation, λ/Å | 0.71073 | 0.71073 | 0.71073 | 0.71073 |
| D calcd, g cm−3 | 1.677 | 1.714 | 1.673 | 1.728 |
| μ/mm−1 | 5.720 | 5.847 | 5.705 | 5.895 |
| F(000) | 1216 | 1216 | 1216 | 1216 |
| Crystal size/mm3 | 0.25 × 0.19 × 0.16 | 0.31 × 0.25 × 0.16 | 0.30 × 0.20 × 0.15 | 0.27 × 0.23 × 0.16 |
| θ range/° | 1.25 to 27.50 | 1.52 to 27.49 | 1.81 to 26.00 | 1.53 to 25.00 |
| Reflections measured | 16![[thin space (1/6-em)]](https://www.rsc.org/images/entities/char_2009.gif) 877 877 |
16![[thin space (1/6-em)]](https://www.rsc.org/images/entities/char_2009.gif) 468 468 |
17![[thin space (1/6-em)]](https://www.rsc.org/images/entities/char_2009.gif) 028 028 |
16![[thin space (1/6-em)]](https://www.rsc.org/images/entities/char_2009.gif) 636 636 |
| Unique reflections | 5646 | 5513 | 4803 | 4191 |
| R int | 0.0350 | 0.0295 | 0.1742 | 0.1698 |
| Reflections with F2 > 2σ(F2) | 5065 | 5102 | 3569 | 3240 |
| Number of parameters | 303 | 309 | 279 | 309 |
| Goodness-of-fit on F2 | 1.008 | 0.990 | 1.068 | 1.004 |
| R 1 [F2 > 2σ(F2)] | 0.0285 | 0.0213 | 0.0731 | 0.0575 |
| wR2 (all data) | 0.0558 | 0.0435 | 0.1629 | 0.1203 |
| Δρmax, Δρmin/e Å−3 | 0.792, −0.659 | 0.704, −0.502 | 2.061, −2.309 | 2.661, −1.280 |
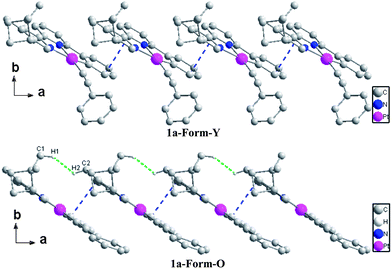
The bond distances and bond angles in the different forms of 1a are almost the same (Table S1, ESI†) and comparable with similar Pt(C^N^N)(C![[triple bond, length as m-dash]](https://www.rsc.org/images/entities/char_e002.gif) C–Ph) derivatives reported previously.25 The most significant difference in the molecular structures lies in the torsion angle between the ring of phenylacetylene and the Pt(C^N^N) plane, which is 64.87° in Form-Y and 12.73° in Form-O. The molecular arrangements are similar along the a-axis where both forms of complex 1a adopt a slip-stacked (head-to-head) mode with effective π–π contacts (Fig. 5).28 No significant Pt–Pt interactions are presented in either form. The molecules of the Form-O are more close to each other with respect to the Form-Y in the a-axis. Therefore, the π–π interactions in the Form-O (3.353 Å) are stronger than the Form-Y (3.396 Å), while the nearest Pt–Pt distance of Form-O (6.035 Å) is shorter than that of Form-Y (6.293 Å). As shown in Fig. 5, besides distinct π–π contacts, the neighbouring molecules along the a-axis in the Form-O are connected with effective C–H⋯H–C interactions of pinene groups.29 The two C–H bonds are in close vicinity (2.34 Å), and the dihedral angle (C1–H1–H2–C2) is 163°. However, no distinct C–H⋯H–C interactions are exhibited in the Form-Y along the a-axis.
C–Ph) derivatives reported previously.25 The most significant difference in the molecular structures lies in the torsion angle between the ring of phenylacetylene and the Pt(C^N^N) plane, which is 64.87° in Form-Y and 12.73° in Form-O. The molecular arrangements are similar along the a-axis where both forms of complex 1a adopt a slip-stacked (head-to-head) mode with effective π–π contacts (Fig. 5).28 No significant Pt–Pt interactions are presented in either form. The molecules of the Form-O are more close to each other with respect to the Form-Y in the a-axis. Therefore, the π–π interactions in the Form-O (3.353 Å) are stronger than the Form-Y (3.396 Å), while the nearest Pt–Pt distance of Form-O (6.035 Å) is shorter than that of Form-Y (6.293 Å). As shown in Fig. 5, besides distinct π–π contacts, the neighbouring molecules along the a-axis in the Form-O are connected with effective C–H⋯H–C interactions of pinene groups.29 The two C–H bonds are in close vicinity (2.34 Å), and the dihedral angle (C1–H1–H2–C2) is 163°. However, no distinct C–H⋯H–C interactions are exhibited in the Form-Y along the a-axis.
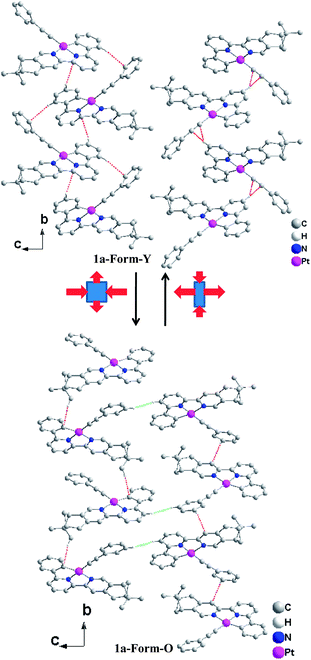
In the bc plane, the molecules are aligned in a zigzag fashion. The transformation from Form-Y to Form-O can be viewed as elongation along the b-axis but suppression along the c-axis (Fig. 6). Therefore, the molecules are more compact in the b-axis and loose in the c-axis for Form-Y, while the molecules in Form-O are distributed averagely, which can also be reflected from the difference of their cell length. Consequently, only C–H⋯π interactions are presented in the b-axis for Form-Y. However, for Form-O, besides the C–H⋯π in the b-axis, there are also C–H⋯H–C interactions in the c-axis.29,30 Moreover, both C–H⋯π(C![[triple bond, length as m-dash]](https://www.rsc.org/images/entities/char_e002.gif) C) and C–H⋯π (aromatic rings) interactions, where only H atoms of aromatic rings are involved in the C–H bond, are presented in the b-axis of Form-Y as a result of the compact packing. These C–H⋯π interactions appear alternately in the adjacent zigzag chains. In contrast, for Form-O, only C–H⋯π (aromatic rings) contacts were observed in the b-axis, with not only H atoms of aromatic rings but also H atoms of pinene groups involved in the C–H bond.
C) and C–H⋯π (aromatic rings) interactions, where only H atoms of aromatic rings are involved in the C–H bond, are presented in the b-axis of Form-Y as a result of the compact packing. These C–H⋯π interactions appear alternately in the adjacent zigzag chains. In contrast, for Form-O, only C–H⋯π (aromatic rings) contacts were observed in the b-axis, with not only H atoms of aromatic rings but also H atoms of pinene groups involved in the C–H bond.
The molecular surrounding environments are also distinct between Form-Y and Form-O. As shown in Fig. 7, a “probe” molecule (shown as black) is surrounded by six neighbouring molecules in the crystal lattice for both forms, with the molecular separations less than 10 Å. The surrounding molecules can be divided into two groups. One group of molecules (shown as blue) are aligned parallel to the central “probe” molecule in head to head mode. In contrast, the other group of molecules (shown as green) are tilted to the “probe” molecule. The dihedral angle of the neighbouring C^N^N planes is 73.1° for Form-Y and 66.1° for Form-O (Fig. 7).
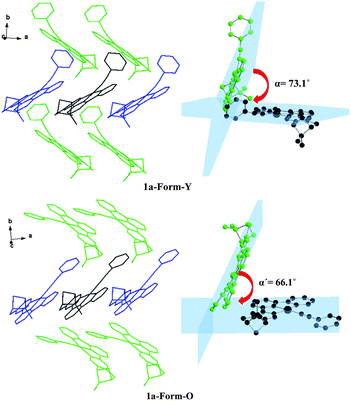 | ||
| Fig. 7 Orientation of the neighbouring molecules and the dihedral angle of the neighbouring C^N^N planes of 1a-Form-Y (upper) and 1a-Form-O (lower) in the crystal lattice. | ||
Solution ECD and VCD spectra
The ECD spectrum of complex 1a in acetonitrile solution shows positive Cotton effects at 224 nm, 258 nm and 302 nm, and weak negative Cotton effects at 285 nm. These signals are corresponding to the intra-ligand (IL) charge-transfer transitions. A broad positive Cotton effect is also observable in the MLCT/LLCT region (370–480 nm) (Fig. 2). The VCD spectrum of 1a shows distinct peaks assignable to C–H, C![[double bond, length as m-dash]](https://www.rsc.org/images/entities/char_e001.gif) N and C
N and C![[double bond, length as m-dash]](https://www.rsc.org/images/entities/char_e001.gif) C stretching (Fig. 8, assignments based on DFT calculations are summarized in Table 3) in the chloroform solution. Complex 1b exhibits the same absorption spectra, but mirror images of ECD and VCD spectra as compared to 1a, in agreement with their enantiomeric feature (Fig. 2 and S10, ESI†).
C stretching (Fig. 8, assignments based on DFT calculations are summarized in Table 3) in the chloroform solution. Complex 1b exhibits the same absorption spectra, but mirror images of ECD and VCD spectra as compared to 1a, in agreement with their enantiomeric feature (Fig. 2 and S10, ESI†).
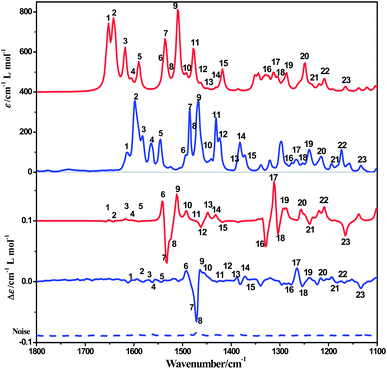 | ||
| Fig. 8 Computed IR and VCD spectra of complex 1a in CDCl3 solution (red) compared to experiment (blue). | ||
| Number of bands | Exp. | Calc. | Assignment |
|---|---|---|---|
| 1 | 1652 | 1615 | C![[double bond, length as m-dash]](https://www.rsc.org/images/entities/char_e001.gif) C stretching of the benzene ring of the phenylacetylene C stretching of the benzene ring of the phenylacetylene |
| 2 | 1643 | 1598 | C![[double bond, length as m-dash]](https://www.rsc.org/images/entities/char_e001.gif) N and C N and C![[double bond, length as m-dash]](https://www.rsc.org/images/entities/char_e001.gif) C stretching of the central pyridine ring of La C stretching of the central pyridine ring of La |
| 3 | 1618 | 1581 | C![[double bond, length as m-dash]](https://www.rsc.org/images/entities/char_e001.gif) N and C N and C![[double bond, length as m-dash]](https://www.rsc.org/images/entities/char_e001.gif) C stretching of central pyridine and lateral benzene rings of La, C C stretching of central pyridine and lateral benzene rings of La, C![[double bond, length as m-dash]](https://www.rsc.org/images/entities/char_e001.gif) C stretching of the benzene ring of the phenylacetylene C stretching of the benzene ring of the phenylacetylene |
| 4 | 1605 | 1563 | C![[double bond, length as m-dash]](https://www.rsc.org/images/entities/char_e001.gif) C stretching of the lateral benzene ring of La C stretching of the lateral benzene ring of La |
| 5 | 1590 | 1545 | C![[double bond, length as m-dash]](https://www.rsc.org/images/entities/char_e001.gif) N and C N and C![[double bond, length as m-dash]](https://www.rsc.org/images/entities/char_e001.gif) C stretching of the lateral pyridine ring of La C stretching of the lateral pyridine ring of La |
| 6 | 1541 | 1492 | C–H deformation of La |
| 7 | 1533 | 1486 | C–H deformation of La, C![[double bond, length as m-dash]](https://www.rsc.org/images/entities/char_e001.gif) N and C N and C![[double bond, length as m-dash]](https://www.rsc.org/images/entities/char_e001.gif) C stretching of both pyridine rings of La C stretching of both pyridine rings of La |
| 8 | 1524 | 1471 | C–H deformation of La |
| 9 | 1511 | 1463 | C–H deformation of La |
| 10 | 1492 | 1453 | C–H deformation of La |
| 11 | 1477 | 1430 | C![[double bond, length as m-dash]](https://www.rsc.org/images/entities/char_e001.gif) N and C N and C![[double bond, length as m-dash]](https://www.rsc.org/images/entities/char_e001.gif) C stretching of central pyridine and lateral benzene rings of La C stretching of central pyridine and lateral benzene rings of La |
| 12 | 1462 | 1422 | C![[double bond, length as m-dash]](https://www.rsc.org/images/entities/char_e001.gif) N and C N and C![[double bond, length as m-dash]](https://www.rsc.org/images/entities/char_e001.gif) C stretching of all aromatic rings of La C stretching of all aromatic rings of La |
| 13 | 1448 | 1388 | C–H deformation of La |
| 14 | 1432 | 1372 | C–H deformation of La |
| 15 | 1418 | 1364 | C–H deformation of La |
| 16 | 1329 | 1277 | C![[double bond, length as m-dash]](https://www.rsc.org/images/entities/char_e001.gif) N and C N and C![[double bond, length as m-dash]](https://www.rsc.org/images/entities/char_e001.gif) C stretching of all aromatic rings of La, C–H deformation of La C stretching of all aromatic rings of La, C–H deformation of La |
| 17 | 1311 | 1265 | C–H deformation of La |
| 18 | 1304 | 1254 | C![[double bond, length as m-dash]](https://www.rsc.org/images/entities/char_e001.gif) N and C N and C![[double bond, length as m-dash]](https://www.rsc.org/images/entities/char_e001.gif) C stretching of all aromatic rings of La, C–H deformation of La C stretching of all aromatic rings of La, C–H deformation of La |
| 19 | 1287 | 1239 | C![[double bond, length as m-dash]](https://www.rsc.org/images/entities/char_e001.gif) N and C N and C![[double bond, length as m-dash]](https://www.rsc.org/images/entities/char_e001.gif) C stretching of central pyridine and lateral benzene rings of La C stretching of central pyridine and lateral benzene rings of La |
| 20 | 1249 | 1216 | C–C stretching between C![[double bond, length as m-dash]](https://www.rsc.org/images/entities/char_e001.gif) C and benzene ring of the phenylacetylene, C C and benzene ring of the phenylacetylene, C![[double bond, length as m-dash]](https://www.rsc.org/images/entities/char_e001.gif) C stretching of the benzene ring of the phenylacetylene C stretching of the benzene ring of the phenylacetylene |
| 21 | 1239 | 1187 | C–H deformation of La |
| 22 | 1209 | 1173 | C–H deformation of La |
| 23 | 1165 | 1133 | C–H deformation of La |
Solid-state ECD and VCD spectra
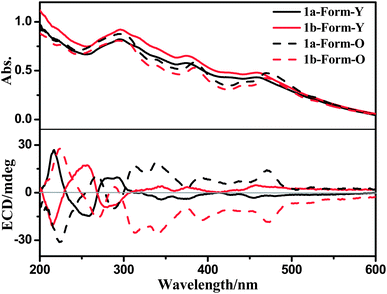
The solid-state UV-Vis spectra of both forms of 1a are similar, except that there are slight red-shifts in the low-energy UV-Vis absorption maxima (ca. 380 nm and 470 nm) from Form-Y to Form-O (Fig. 9). However, their solid state ECD spectra show distinct differences (Fig. 9). In the ECD spectrum of 1a, the two positive Cotton effects (216 nm and 280 nm) of Form-Y turned negative for Form-O, while the negative Cotton effects of Form-Y at around 256 nm and in the range of 300–500 nm appeared positive for Form-O. Moreover, the Cotton effects in the range of 300–500 nm were significantly enhanced from Form-Y to Form-O besides the slight red-shift in peak maxima. The solid state ECD spectra of the two polymorphic phases of 1a are also different from the solution ECD spectrum, in spite of the fact that there is little change in the UV-Vis spectra. To check whether any artefacts were introduced into the spectra, both solid-state forms of 1b were measured under the same conditions. Mirror images of ECD spectra were obtained for 1b (Fig. 9). Additionally, another four samples of every form of 1a and 1b were measured under the same conditions. The spectra have good reproducibility (Fig. S11–S14, ESI†).We calculated the solid-state ECD spectra of 1a-Form-Y and 1a-Form-O by using only one molecule in the TD-DFT calculation (inter-molecular interactions were not considered). The simulated spectrum of 1a-Form-Y is in better agreement with the observed result as compared to the case of 1a-Form-O (Fig. S15, ESI†). Moreover, besides some minor changes on the peak position and intensity, there is almost no change in the simulated ECD spectra between these two conformations. No inversion of the Cotton effect was observed (Fig. S15, ESI†). Consequently, the different torsion angles between the ring of phenylacetylene and the Pt(C^N^N) plane in 1a-Form-Y and 1a-Form-O should contribute little to the distinct difference in the observed solid-state ECD. Instead, the distinct change should be originated from the different intermolecular interactions and molecular arrangements.
It is known that exciton coupling occurs when two or more chromophores are in close proximity. The sign and intensity of exciton coupling are sensitive to the relative alignment (projection angle and distance) of dipole moments of the neighbouring chromophores.31 For aligned arrangement (projection angle ≈ 0° or 180°), the ECCD is negligible. Therefore, as shown in Fig. 7, the intermolecular ECCD between the “probe” molecule and aligned molecules is insignificant. The intermolecular ECCD interaction is only possible between the central “probe” molecule and the neighbours which are tilted to them.32
Three types of electronic transitions (ILCT, MLCT and LLCT) are involved in both forms of 1a, and their orientations are shown in Fig. 10. Although the dihedral angle between the central “probe” molecule and the neighbours which are tilted to them varied little from Form-Y to Form-O (Fig. 7), the projection angle between the transition dipoles of the neighbouring molecules can change much. For example, as depicted in Fig. 10, the projection angle (θ) between long-axis polarized transitions of the central molecule and tilted “green” molecule is +3° for 1a-Form-Y, indicating that the intermolecular exciton coupling of long-axis polarized transitions of the neighbouring C^N^N chromophores in 1a-Form-Y is very weak and can be neglected. However, for 1a-Form-O, the projection angle (θ′) is + 27°, therefore the intermolecular ECCD of the long-axis polarized transitions will be significant as the center-to-center distance of long-axis polarized transitions is less than the threshold distance (10 Å). Careful examination of the ECD spectra as shown in Fig. 9 reveals that there is a positive exciton couplet for 1a-Form-O but only a positive Cotton effect for 1a-Form-Y at about 300 nm. These signals are well distinguished from others and can be mainly assigned to intra-ligand π(C^N^N)–π*(C^N^N) transition.25 Therefore, the exciton coupling derived from the crystal structure is in good agreement with observed ECD spectra.
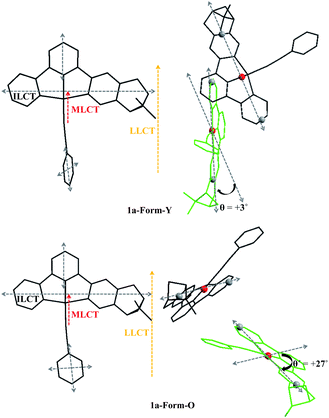 | ||
| Fig. 10 Orientations (left) of electronic transitions and the projection angles (right) of long-axis polarized transitions of 1a-Form-Y (top) and 1a-Form-O (bottom) in the crystal lattice. | ||
For the other electronic transitions (LLCT and MLCT, 370–500 nm) as marked in Fig. 10, it is difficult to give unambiguous assignments due to the overlap and mutual interaction between the adjacent transitions.33 However, different situations for exciton coupling are also possible which may cause the distinct difference in ECD spectra from Form-Y to Form-O.
It is noteworthy that inter-molecular interactions (hydrogen bonding, aromatic π–π packing, C–H![[triple bond, length as m-dash]](https://www.rsc.org/images/entities/char_e002.gif) π contact and hydrophobic effect) may also affect the sign and intensity of Cotton effects.34 Different inter-molecular interactions (C–H
π contact and hydrophobic effect) may also affect the sign and intensity of Cotton effects.34 Different inter-molecular interactions (C–H![[triple bond, length as m-dash]](https://www.rsc.org/images/entities/char_e002.gif) π, π–π, C–H
π, π–π, C–H![[triple bond, length as m-dash]](https://www.rsc.org/images/entities/char_e002.gif) H–C) along a, b and c axes are presented in 1a-Form-Y and 1a-Form-O. These inter-molecular effects could play a significant role in the solid-state ECD. Such kind of surrounding effects have been observed before,3,32,35 and different intermolecular interactions (hydrogen bonds, aromatic π–π packing, C–H
H–C) along a, b and c axes are presented in 1a-Form-Y and 1a-Form-O. These inter-molecular effects could play a significant role in the solid-state ECD. Such kind of surrounding effects have been observed before,3,32,35 and different intermolecular interactions (hydrogen bonds, aromatic π–π packing, C–H![[triple bond, length as m-dash]](https://www.rsc.org/images/entities/char_e002.gif) π contact and C–H
π contact and C–H![[triple bond, length as m-dash]](https://www.rsc.org/images/entities/char_e002.gif) H–C interaction) are reported to have a significant influence on the ECD spectra.
H–C interaction) are reported to have a significant influence on the ECD spectra.
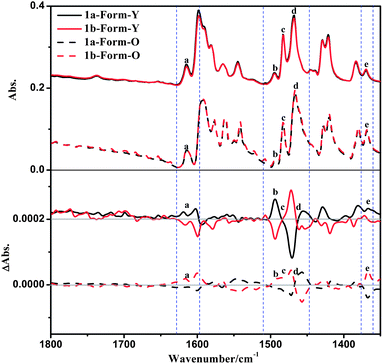
The solid-state VCD spectra of 1a-Form-Y also differ distinctly with that of 1a-Form-O in spite of the fact that their IR spectra are similar (Fig. 11). The positive bands at 1615 cm−1 and 1369 cm−1 (bands a and e) of Form-Y turned negative in Form-O, which can be designated as C![[double bond, length as m-dash]](https://www.rsc.org/images/entities/char_e001.gif) C stretching of the benzene ring of the phenylacetylene and C–H deformation of La, respectively. In the range of 1510 cm−1 to 1470 cm−1, the positive peak (band b: 1493 cm−1) and bisignate signal (band c: 1483 cm−1) for Form-Y are shown as negative peaks for Form-O. Band b can be assigned to C–H deformation of La, while band c originates from C–H deformation of La as well as C
C stretching of the benzene ring of the phenylacetylene and C–H deformation of La, respectively. In the range of 1510 cm−1 to 1470 cm−1, the positive peak (band b: 1493 cm−1) and bisignate signal (band c: 1483 cm−1) for Form-Y are shown as negative peaks for Form-O. Band b can be assigned to C–H deformation of La, while band c originates from C–H deformation of La as well as C![[double bond, length as m-dash]](https://www.rsc.org/images/entities/char_e001.gif) N and C
N and C![[double bond, length as m-dash]](https://www.rsc.org/images/entities/char_e001.gif) C stretching of both pyridine rings of La. The other bisignate band d at 1455 cm−1 remains unchanged from Form-Y to Form-O originating from C–H deformation of La. In contrast to the ECD spectra, no significant change in peak position and intensity was observed in the VCD spectra. To check whether any artefacts were introduced into the spectra, both solid-state forms of 1b as well as other four samples were performed under the same conditions, and the spectra have good reproducibility (Fig. 11 and S16–S19, ESI†).
C stretching of both pyridine rings of La. The other bisignate band d at 1455 cm−1 remains unchanged from Form-Y to Form-O originating from C–H deformation of La. In contrast to the ECD spectra, no significant change in peak position and intensity was observed in the VCD spectra. To check whether any artefacts were introduced into the spectra, both solid-state forms of 1b as well as other four samples were performed under the same conditions, and the spectra have good reproducibility (Fig. 11 and S16–S19, ESI†).
The solid-state VCD calculations using only one isolated molecule of 1a-Form-Y and 1a-Form-O have also been performed (Fig. S20, ESI†). Similar to the ECD spectra, the simulated VCD spectrum of 1a-Form-Y coincides better with the experimental spectra as compared to 1a-Form-O, indicating that the distinct change in VCD spectra should be originated from the different intermolecular interactions instead of the different molecular conformations.
VCD signals, which mainly come from bond stretching or deformation vibrations (Table 3), are generally more sensitive to intermolecular interactions and surrounding effects.3,7c,19a,c,36 As discussed above, most of the intensive solid-state VCD signals (bands b, c, d and e) are assigned to C–H deformations as well as aromatic C![[double bond, length as m-dash]](https://www.rsc.org/images/entities/char_e001.gif) N and C
N and C![[double bond, length as m-dash]](https://www.rsc.org/images/entities/char_e001.gif) C stretchings. The C–H deformations are mainly derived from the chiral pinene group. As displayed in Fig. 5 and 6, the H atoms of the pinene group in the 1a-Form-O participate in the C–H⋯H–C interactions along the a-axis and C–H⋯π contacts along the b-axis. The two C–H bonds in the a-axis are in close vicinity that a through-space interaction is possible, which will affect the VCD signals. However, none of the H atoms of the pinene group are involved in the intermolecular interactions in the Form-Y. Therefore, it is reasonable that bands b, c and e associated with C–H deformations of the pinene group in the Form-O are significantly different from Form-Y. Additionally, π–π interactions in the Form-O are stronger, as shown in Fig. 5, which might have an influence on C
C stretchings. The C–H deformations are mainly derived from the chiral pinene group. As displayed in Fig. 5 and 6, the H atoms of the pinene group in the 1a-Form-O participate in the C–H⋯H–C interactions along the a-axis and C–H⋯π contacts along the b-axis. The two C–H bonds in the a-axis are in close vicinity that a through-space interaction is possible, which will affect the VCD signals. However, none of the H atoms of the pinene group are involved in the intermolecular interactions in the Form-Y. Therefore, it is reasonable that bands b, c and e associated with C–H deformations of the pinene group in the Form-O are significantly different from Form-Y. Additionally, π–π interactions in the Form-O are stronger, as shown in Fig. 5, which might have an influence on C![[double bond, length as m-dash]](https://www.rsc.org/images/entities/char_e001.gif) N/C
N/C![[double bond, length as m-dash]](https://www.rsc.org/images/entities/char_e001.gif) C stretching couplets.37
C stretching couplets.37
Conclusions
A couple of enantiomeric cyclometalated platinum(II) complexes containing pinene functionalized chiral C^N^N ligands have been prepared, and their structures and spectroscopic properties have been studied as well. These complexes exhibit an intriguing vapor-induced crystal transformation process. X-ray crystal structures of two polymorphs display distinct intermolecular packings and interactions, which are further confirmed by the expected CD spectral variances. These shifts testified the high sensitivity of both ECD and VCD spectra to subtle changes in molecular surrounding environments. Moreover, the vapor-induced chiroptical switching behaviour in platinum(II) complexes is unique, therefore providing a novel way to manipulate the chirality of platinum(II) complexes and may lead to useful applications as solid-state chiral sensors.Acknowledgements
This work was supported by the National Natural Science Foundation of China (91022031, 21021062, and 21001063) and Major State Basic Research Development Program (Grant no. 2013CB922102, 2011CB933300, and 2011CB808704).Notes and references
- (a) B. L. Feringa, N. P. M. Huck and A. M. Schoevaars, Adv. Mater., 1996, 8, 681 CrossRef CAS; (b) S. Saha and J. F. Stoddart, Chem. Soc. Rev., 2007, 36, 77 RSC; (c) J. Crassous, Chem. Soc. Rev., 2009, 38, 830 RSC; (d) J. W. Canary, S. Mortezaei and J. Liang, Coord. Chem. Rev., 2010, 254, 2249 CrossRef CAS PubMed.
- (a) T. Yamada, Y. Nagata and M. Suginome, Chem. Commun., 2010, 46, 4914 RSC; (b) J. Gregoliński, P. Starynowicz, K. T. Hua, J. L. Lunkley, G. Muller and J. Lisowski, J. Am. Chem. Soc., 2008, 130, 17761 CrossRef PubMed; (c) H. Miyake, K. Yoshida, H. Sugimoto and H. Tsukube, J. Am. Chem. Soc., 2004, 126, 6524 CrossRef CAS PubMed; (d) S. Zahn and J. W. Canary, Science, 2000, 288, 1404 CrossRef CAS; (e) D. Li, Z. Y. Wang and D. Ma, Chem. Commun., 2009, 1529 RSC; (f) T. Muraoka, K. Kinbara and T. Aida, Nature, 2006, 440, 512 CrossRef CAS PubMed; (g) K. M. Wiggins, T. W. Hudnall, Q. Shen, M. J. Kryger, J. S. Moore and C. W. Bielawski, J. Am. Chem. Soc., 2010, 132, 3256 CrossRef CAS PubMed; (h) E. Anger, M. Rudolph, C. Shen, N. Vanthuyne, L. Toupet, C. Roussel, J. Autschbach, J. Crassous and R. Réau, J. Am. Chem. Soc., 2011, 133, 3800 CrossRef CAS PubMed.
- J. Frelek, M. Górecki, M. Łaszcz, A. Suszczyńska, E. Vass and W. J. Szczepek, Chem. Commun., 2012, 48, 5295 RSC.
- (a) Comprehensive Chiroptical Spectroscopy, ed. N. Berova, R. W. Woody, P. Polavarapu and K. Nakanishi, Wiley, New York, 2012 Search PubMed; (b) N. Berova, L. Di Bari and G. Pescitelli, Chem. Soc. Rev., 2007, 36, 914 RSC; (c) G. Pescitelli, L. Di Bari and N. Berova, Chem. Soc. Rev., 2011, 40, 4603 RSC.
- L. A. Nafie, Vibrational Optical Activity: Principles and Applications, Wiley, Chichester, 2011 Search PubMed.
- (a) R. Kuroda and T. Honma, Chirality, 2000, 12, 269 CrossRef CAS; (b) E. Castiglioni, P. Biscarini and S. Abbate, Chirality, 2009, 21, E28 CrossRef CAS PubMed; (c) R. Kuroda, T. Harada and Y. Shindo, Rev. Sci. Instrum., 2001, 72, 3802 CrossRef CAS.
- (a) R. Kuroda and T. Harada, in Comprehensive Chiroptical Spectroscopy, ed. N. Berova, R. W. Woody, P. Polavarapu and K. Nakanishi, Wiley, New York, 2012, vol. 1, p. 91 Search PubMed; (b) G. Pescitelli, T. Kurtán and K. Krohn, in Comprehensive Chiroptical Spectroscopy, ed. N. Berova, R. W. Woody, P. Polavarapu and K. Nakanishi, Wiley, New York, 2012, vol. 2, p. 217 Search PubMed; (c) S. Graus, R. M. Tejedor, S. Uriel, J. L. Serrano, I. Alkorta and J. Elguero, J. Am. Chem. Soc., 2010, 132, 7862 CrossRef CAS PubMed; (d) S. MacQuarrie, M. P. Thompson, A. Blanc, N. J. Mosey, R. P. Lemieux and C. M. Crudden, J. Am. Chem. Soc., 2008, 130, 14099 CrossRef CAS PubMed.
- (a) O. S. Wenger, Chem. Rev., 2013, 113, 3686 CrossRef CAS PubMed; (b) X. Zhang, B. Li, Z.-H. Chen and Z.-N. Chen, J. Mater. Chem., 2012, 22, 11427 RSC.
- (a) Y. Kunugi, K. R. Mann, L. L. Miller and C. L. Exstrom, J. Am. Chem. Soc., 1998, 120, 589 CrossRef CAS; (b) S. M. Drew, D. E. Janzen, C. E. Buss, D. I. MacEwan, K. M. Dublin and K. R. Mann, J. Am. Chem. Soc., 2001, 123, 8414 CrossRef CAS.
- (a) T. J. Wadas, Q.-M. Wang, Y.-J. Kim, C. Flaschenreim, T. N. Blanton and R. Eisenberg, J. Am. Chem. Soc., 2004, 126, 16841 CrossRef CAS PubMed; (b) L. J. Grove, J. M. Rennekamp, H. Jude and W. B. Connick, J. Am. Chem. Soc., 2004, 126, 1594 CrossRef CAS PubMed; (c) J. Ni, L.-Y. Zhang, H.-M. Wen and Z.-N. Chen, Chem. Commun., 2009, 3801 RSC; (d) S. C. F. Kui, S. S.-Y. Chui, C.-M. Che and N. Zhu, J. Am. Chem. Soc., 2006, 128, 8297 CrossRef CAS PubMed; (e) J. R. Kumpfer, S. D. Taylor, W. B. Connick and S. J. Rowan, J. Mater. Chem., 2012, 22, 14196 RSC.
- (a) M. Albrecht, M. Lutz, A. L. Spek and G. van Koten, Nature, 2000, 406, 970 CrossRef CAS PubMed; (b) K. Naka, T. Kato, S. Watase and K. Matsukawa, Inorg. Chem., 2012, 51, 4420 CrossRef CAS PubMed; (c) J. R. Berenguer, E. Lalinde, A. Martín, M. T. Moreno, S. Ruiz, S. Sánchez and H. R. Shahsavari, Chem. Commun., 2013, 49, 5067 RSC; (d) E. J. Rivera, C. Barbosa, R. Torres, L. Grove, S. Taylor, W. B. Connick, A. Clearfield and J. L. Colón, J. Mater. Chem., 2011, 21, 15899 RSC.
- (a) N. Komiya, T. Muraoka, M. Iida, M. Miyanaga, K. Takahashi and T. Naota, J. Am. Chem. Soc., 2011, 133, 16054 CrossRef CAS PubMed; (b) K. M.-C. Wong and V. W.-W. Yam, Acc. Chem. Res., 2011, 44, 424 CrossRef CAS PubMed; (c) X.-P. Zhang, T. Wu, J. Liu, J.-C. Zhao, C.-H. Li and X.-Z. You, chirality, 2013, 25, 384 CrossRef CAS PubMed; (d) K. Liu, L. Meng, S. Mo, M. Zhang, Y. Mao, X. Cao, C. Huang and T. Yi, J. Mater. Chem. C, 2013, 1, 1753 RSC.
- T. Fukushima and K. Tsuchihara, Macromol. Rapid Commun., 2009, 30, 1334 CrossRef CAS PubMed.
- (a) O. Mamula and A. von Zelewsky, Coord. Chem. Rev., 2003, 242, 87 CrossRef CAS; (b) D.-P. Li, C.-H. Li, J. Wang, L.-C. Kang, T. Wu, Y.-Z. Li and X.-Z. You, Eur. J. Inorg. Chem., 2009, 4844 CrossRef CAS.
- M.-Y. Yuen, S. C. F. Kui, K.-H. Low, C.-C. Kwok, S. S.-Y. Chui, C.-W. Ma, N. Zhu and C.-M. Che, Chem.–Eur. J., 2010, 16, 14131 CrossRef CAS PubMed.
- K. Sonogashira, Y. Fujikura, T. Yatake, N. Toyoshima, S. Takahashi and N. Hagihara, J. Organomet. Chem., 1978, 145, 101 CrossRef CAS.
- (a) T. Kawasaki, K. Suzuki, K. Hatase, M. Otsuka, H. Koshima and K. Soai, Chem. Commun., 2006, 1869 RSC; (b) K. Tanaka, M. Kato and F. Toda, Chirality, 2001, 13, 347 CrossRef CAS PubMed.
- (a) T. Wu, C.-H. Li, Y.-Z. Li, Z.-G. Zhang and X.-Z. You, Dalton Trans., 2010, 39, 3227 RSC; (b) T. Wu, X.-P. Zhang, C.-H. Li, P. Bouř, Y.-Z. Li and X.-Z. You, Chirality, 2012, 24, 451 CrossRef CAS PubMed.
- (a) J. J. L. González, F. P. Ureña, J. R. A. Moreno, I. Mata, E. Molins, R. M. Claramunt, C. López, I. Alkorta and J. Elguero, New J. Chem., 2012, 36, 749 RSC; (b) C. Johannessen and P. W. Thulstrup, Dalton Trans., 2007, 1028 RSC; (c) R. M. Tejedor, S. Uriel, S. Graus, T. Sierra, J. L. Serrano, R. M. Claramunt, C. López, M. Pérez-Torralba, I. Alkorta and J. Elguero, Chem.–Eur. J., 2013, 19, 6044 CrossRef CAS PubMed.
- SAINT-Plus, version 6.02, Bruker Analytical X-ray System, Madison, WI, 1999 Search PubMed.
- G. M. Sheldrick, SADABS, an empirical absorption correction program, Bruker Analytical X-ray Systems, Madison, WI, 1996 Search PubMed.
- G. M. Sheldrick, Acta Crystallogr., Sect. A: Fundam. Crystallogr., 2008, 64, 112 CrossRef CAS PubMed.
- D. Andrae, U. Haeussermann, M. Dolg, H. Stoll and H. Preuss, Theor. Chim. Acta, 1990, 77, 123 CrossRef CAS.
- M. J. Frisch, G. W. Trucks, H. B. Schlegel, G. E. Scuseria, M. A. Robb, J. R. Cheeseman, J. A. Montgomery, Jr, T. Vreven, K. N. Kudin, J. C. Burant, J. M. Millam, S. S. Iyengar, J. Tomasi, V. Barone, B. Mennucci, M. Cossi, G. Scalmani, N. Rega, G. A. Petersson, H. Nakatsuji, M. Hada, M. Ehara, K. Toyota, R. Fukuda, J. Hasegawa, M. Ishida, T. Nakajima, Y. Honda, O. Kitao, H. Nakai, M. Klene, X. Li, J. E. Knox, H. P. Hratchian, J. B. Cross, V. Bakken, C. Adamo, J. Jaramillo, R. Gomperts, R. E. Stratmann, O. Yazyev, A. J. Austin, R. Cammi, C. Pomelli, J. W. Ochterski, P. Y. Ayala, K. Morokuma, G. A. Voth, P. Salvador, J. J. Dannenberg, V. G. Zakrzewski, S. Dapprich, A. D. Daniels, M. C. Strain, O. Farkas, D. K. Malick, A. D. Rabuck, K. Raghavachari, J. B. Foresman, J. V. Ortiz, Q. Cui, A. G. Baboul, S. Clifford, J. Cioslowski, B. B. Stefanov, G. Liu, A. Liashenko, P. Piskorz, I. Komaromi, R. L. Martin, D. J. Fox, T. Keith, M. A. Al-Laham, C. Y. Peng, A. Nanayakkara, M. Challacombe, P. M. W. Gill, B. Johnson, W. Chen, M. W. Wong, C. Gonzalez and J. A. Pople, Gaussian 03, Revision E.01, Gaussian, Inc., Wallingford CT, 2004 Search PubMed.
- (a) W. Lu, B.-X. Mi, M. C. W. Chan, Z. Hui, C.-M. Che, N. Zhu and S.-T. Lee, J. Am. Chem. Soc., 2004, 126, 4958 CrossRef CAS PubMed; (b) M. L. Clark, S. Diring, P. Retailleau, D. R. McMillin and R. Ziessel, Chem.–Eur. J., 2008, 14, 7168 CrossRef CAS PubMed; (c) J. Schneider, P. Du, P. Jarosz, T. Lazarides, X. Wang, W. W. Brennessel and R. Eisenberg, Inorg. Chem., 2009, 48, 4306 CrossRef CAS PubMed; (d) X. Zhou, Q.-J. Pan, B.-H. Xia, M.-X. Li, H.-X. Zhang and A.-C. Tung, J. Phys. Chem. A, 2007, 111, 5465 CrossRef CAS PubMed.
- W. Lu, M. C. W. Chan, N. Zhu, C.-M. Che, Z. He and K.-Y. Wong, Chem.–Eur. J., 2003, 9, 6155 CrossRef CAS PubMed.
- A. von Zelewsky, Stereochemistry of Coordination Compounds, Wiley, Chichester, 1996 Search PubMed.
- C. Janiak, J. Chem. Soc., Dalton Trans., 2000, 3885 RSC.
- D. Danovich, S. Shaik, F. Neese, J. Echeverría, G. Aullón and S. Alvarez, J. Chem. Theory Comput., 2013, 9, 1977 CrossRef CAS.
- H. Suezawa, T. Yoshida, Y. Umezawa, S. Tsuboyama and M. Nishio, Eur. J. Inorg. Chem., 2002, 3158 Search PubMed.
- (a) N. Harada and K. Nakanishi, Circular Dichroic Spectroscopy – Exciton Coupling in Organic Stereochemistry, University Science Books, Mill Valley, CA, 1983 Search PubMed; (b) S. G. Telfer, T. M. McLean and M. R. Waterland, Dalton Trans., 2011, 40, 3097 RSC.
- (a) G. Pescitelli, D. Padula and F. Santoro, Phys. Chem. Chem. Phys., 2013, 15, 795 RSC; (b) G. Kerti, T. Kurtán, A. Borbás, Z. B. Szabó, A. Lipták, L. Szilágyi, Z. Illyés-Tünde, A. Bényei, S. Antus, M. Watanabe, E. Castiglioni, G. Pescitelli and P. Salvadori, Tetrahedron, 2008, 64, 1676 CrossRef CAS PubMed; (c) H. Hussain, I. Ahmed, B. Schulz, S. Draeger, U. Flörke, G. Pescitelli and K. Krohn, Chirality, 2011, 23, 617 CrossRef CAS PubMed.
- M. Ziegler and A. von Zelewsky, Coord. Chem. Rev., 1998, 177, 257 CrossRef CAS.
- (a) G. A. Hemburya, V. V. Borovkov and Y. Inoue, Chem. Rev., 2008, 108, 1 CrossRef PubMed; (b) S.-Y. Xu, B. Hu, S. E. Flower, Y.-B. Jiang, J. S. Fossey, W.-P. Deng and T. D. James, Chem. Commun., 2013, 49, 8314 RSC; (c) F. Marinelli, A. Sorrenti, V. Corvaglia, V. Leone and G. Mancini, Chem.–Eur. J., 2012, 18, 14680 CrossRef CAS PubMed.
- (a) N. Nishiguchi, T. Kinuta, T. Sato, Y. Nakano, H. Tokutome, N. Tajima, M. Fujiki, R. Kuroda, Y. Matsubara and Y. Imai, Chem.–Asian J., 2012, 7, 360 CrossRef CAS PubMed; (b) G. Pescitelli, S. D. Pietro, C. Cardellicchio, M. A. M. Capozzi and L. D. Bari, J. Org. Chem., 2010, 75, 1143 CrossRef CAS PubMed; (c) G. Bringmann, K. Maksimenka, T. Bruhn, M. Reichert, T. Harada and R. Kuroda, Tetrahedron, 2009, 65, 5720 CrossRef CAS PubMed; (d) N. Nishiguchi, T. Kinuta, T. Sato, Y. Nakano, T. Harada, N. Tajima, M. Fujiki, R. Kuroda, Y. Matsubara and Y. Imai, Cryst. Growth Des., 2012, 12, 1859 CrossRef CAS.
- (a) J. Sadlej, J. Cz. Dobrowolski and J. E. Rode, Chem. Soc. Rev., 2010, 39, 1478 RSC; (b) N. Jiang, R. X. Tan and J. Ma, J. Phys. Chem. B, 2011, 115, 2801 CrossRef CAS PubMed; (c) A. Zehnacker and M. A. Suhm, Angew. Chem., Int. Ed., 2008, 47, 6970 CrossRef CAS PubMed.
- (a) T. Taniguchi and K. Monde, J. Am. Chem. Soc., 2012, 134, 3695 CrossRef CAS PubMed; (b) T. Wu and X. You, J. Phys. Chem. A, 2012, 116, 8959 CrossRef CAS PubMed.
Footnote |
| † Electronic supplementary information (ESI) available: Additional characterization data. CCDC 952002–952005. For ESI and crystallographic data in CIF or other electronic format see DOI: 10.1039/c3tc31997k |
| This journal is © The Royal Society of Chemistry 2014 |

