The role of SnO2 quantum dots in improved CH4 sensing at low temperature
Received
3rd September 2013
, Accepted 9th October 2013
First published on 10th October 2013
Abstract
The role of quantum dots (QDs) of SnO2 in detecting low concentrations of methane (CH4) at a relatively low temperature of ∼150 °C with high response (S ∼ 3.5%) and response time below 1 min is reported. A simple room temperature single step chemical process was adopted for the growth of SnO2 nanoparticles of a size around 2.4 nm. These nanoparticles were subsequently annealed at 800 °C to increase the grain size to 25 nm. The as-prepared SnO2 nanoparticles, being smaller than the corresponding Bohr radius (2.7 nm), showed a strong quantum confinement effect with a blue shift in the band gap energy from 3.6 eV for the bulk SnO2 to 4.37 eV for the QDs. These QDs exhibited a strong sensing response to CH4 in comparison to the annealed sample. A low activation energy of 90 meV, as estimated from the temperature dependent S plot for SnO2 QDs, was found to be the driving force for such unusual high sensitivity at a low operating temperature. X-ray diffraction, transmission electron microscopy, along with Raman spectroscopy measurements are used for the detailed structural studies. The critical role of the chemisorbed oxygen species present at different operating temperatures on the surface of the off-stoichiometric quantum sized SnO2 and bulk-like annealed samples are discussed in light of the adsorption kinetics.
Introduction
Methane (CH4), the second largest contributor to global warming after CO2 has a global warming potential (GWP) of 23, compared to 1 for CO2. Methane, emitted from a variety of both human-related (anthropogenic) and natural sources, participates in total greenhouse gas emissions by 19%.1,2 Moreover, serious apprehension remains about the CH4 emission from coal mines, farmland ventilation or natural gas-fuelled (NGV) vehicles, since it can form an explosive mixture in air. The identification of CH4 at temperatures lower than 350 °C is relatively difficult due to its high thermodynamic stability as compared to other hydrocarbons.3 Hence the detection of a low concentration of CH4 at temperatures well below 300 °C is of considerable interest. Catalytic materials were used for CH4 detection in the concentration range of a few hundreds of ppm, while flame ionization and infrared detectors were suitably utilized for the instrumental analysis of sub ppm and ppb level hydrocarbons, including CH4.4,5 Present state of the art CH4 sensing is mainly dominated by the use of catalytic beads containing expensive noble metals like Pd and Pt in metal oxides, acting for CH4 decomposition at a relatively low temperature of 300 °C.6–8 Stable metal oxides, mainly SnO2 sensors are widely used for CH4 detection in the temperature range of 500–600 °C. After loading with Pt or Pd, a drastic decrease in oxidizing temperature from 450 °C to 300 °C for CH4 was also reported.9–12 The low temperature of detection enables a low power consumption. Catalytic metals in a dispersed phase or as electrodes with the SnO2 semiconductors drive the reaction by lowering the activation energy of the system.13 However, the loading of noble metals affects the cost effectiveness and introduces additional process steps.14 Attempts were made to detect CH4 using materials other than SnO2. Screen printed Sb doped ZnO showed a relatively high response to 1000 ppm CH4 at ∼300 °C,15 whereas multi-walled CNT (MWCNT), loaded with Pd only (Pd:MWCNT), exhibited a good response at RT.16 For both cases the loading of noble metal was found to be responsible for the CH4 detection. Moreover, the Pd:MWCNT sensor was found to respond due to a charge transfer process between Pd and CNT, which was strongly influenced by temperature variation.
SnO2 is an important n-type semiconductor with a band gap of 3.6 eV at 300 K and has a Debye length of 3 nm (ref. 6, 17 and 18) Nanostructured materials offer a new horizon for low temperature detection as the size of active sensing materials approaches the Debye length13,19 with the formation of a large depletion region of electronic charge forming after O2 adsorption.1 In subsequent interactions with the target gas, chemisorbed oxygen species exchange charge carriers causing a substantial change in the electrical resistance involving the whole grain, not just the surface alone. In addition, surface defects as well as an enhanced surface to volume ratio with extra surface energy favour the detection of a trace toxic gas.20 Thus, there is a large amount of interest in controlled ultra small nanoparticles (NPs) closely matching to the Debye length of 3 nm of SnO2.21,22 The synthesis of SnO2 quantum dots (QDs) was reported by the hydrolysis process23 and a sol–gel method.24 A hydrothermal route was also used for the synthesis of uniform, mono-dispersed SnO2 QDs25 using hydrazine (N2H4) as a reducing agent. In fact, high quality SnO2 NPs of 5 nm were synthesized in two steps, a sonochemical method followed by annealing at 400 °C for achieving high sensitivity towards CO.7 This material, however, remained insensitive towards CH4 at and below 300 °C. Recently, porous nanostructured SnO2, synthesized through a template route, was found to be an excellent CH4 sensor at RT for a concentration of 2500 ppm.26 The recovery and response were very slow at RT (>5 minutes), whereas the sensor responded at a relatively quick pace (∼1 minute) at a high temperature of 300 °C for concentrations of 125 ppm and above. The detection of potent CH4 below 100 ppm at low temperature is still considered to be a challenge with pure SnO2. In effect, the control over the process steps for the preparation of NPs, as well as making small QDs less than the Debye length size for gaining large sensor response remains to be explored for CH4.
Here we report a single step SnO2 QDs preparation following a soft chemical route with no additional processes like annealing, promoter or template structures and demonstrate a detection of 30 ppm CH4 at the significantly low temperature of 150 °C. SnO2 QDs of 2.4 nm showed a characteristic strong quantum confinement, in comparison to the 25 nm SnO2 NPs. The mechanism of CH4 sensing is highlighted with due consideration to the role of chemisorbed oxygen species and the surface energy of the NPs.
Results and discussion
Structural studies of the nanomaterials
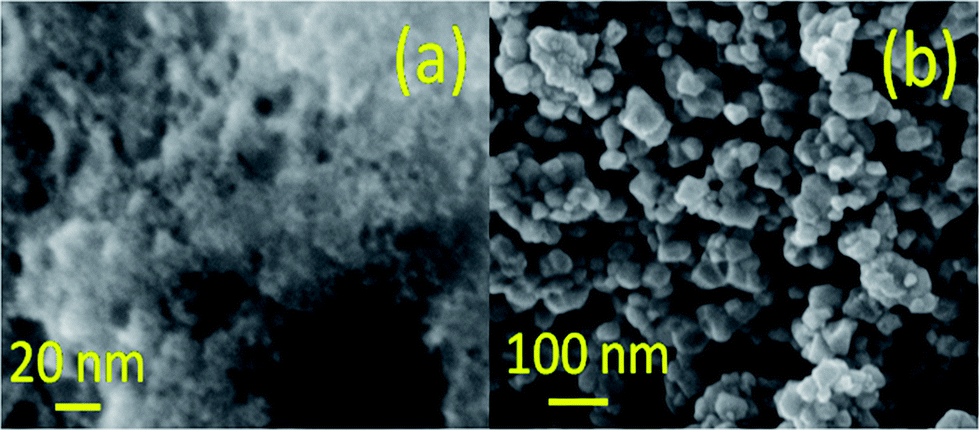
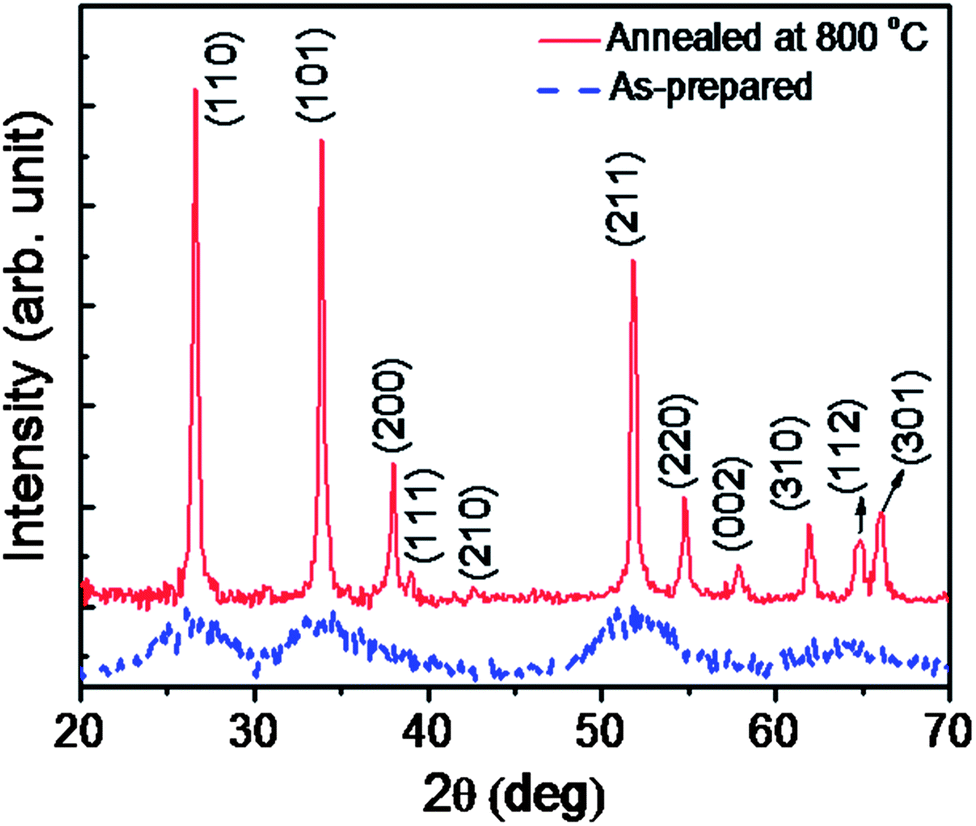
Fig. 1 shows the morphologies of the samples obtained using field emission scanning electron microscopy indicating the presence of ultra-small NPs for the as-prepared sample. The anealed sample, on the other hand exhibits particles of an average diameter of 25 nm. Powder X-ray diffraction patterns of the as-prepared and the annealed SnO2 NPs are shown in Fig. 2. All the sharp diffraction peaks of the annealed sample can be indexed following the tetragonal rutile phase of SnO2 (JCPDS #41-1445). On the other hand, broad peaks are observed for the as-prepared sample appearing at the 2θ values of 26.5°, 33.8°, 51.7°, 64.7°, which closely match to the (110), (101), (211) and (112) planes of rutile SnO2, respectively. The average crystallite sizes, deduced using the Debye–Scherrer equation, are 1.8 ± 0.2 nm for the as-prepared and 22.0 ± 1.0 nm for the annealed samples. The observed broadening in the Powder X-ray diffraction (XRD) peaks can also be associated with non-uniform strain, which is further elaborated in the high resolution transmission electron microscopy (HRTEM) studies.
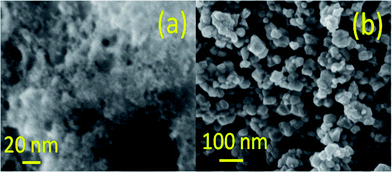 |
| | Fig. 1 FESEM images of the (a) as-prepared and (b) annealed sample. | |
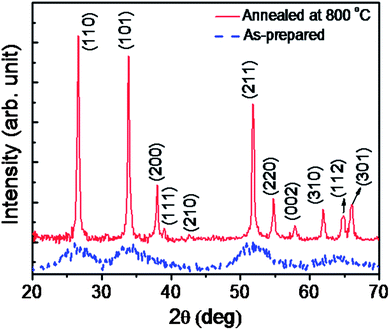 |
| | Fig. 2 Powder XRD patterns of the as-prepared and the annealed SnO2 nanoparticles displaying the rutile phase of SnO2. | |
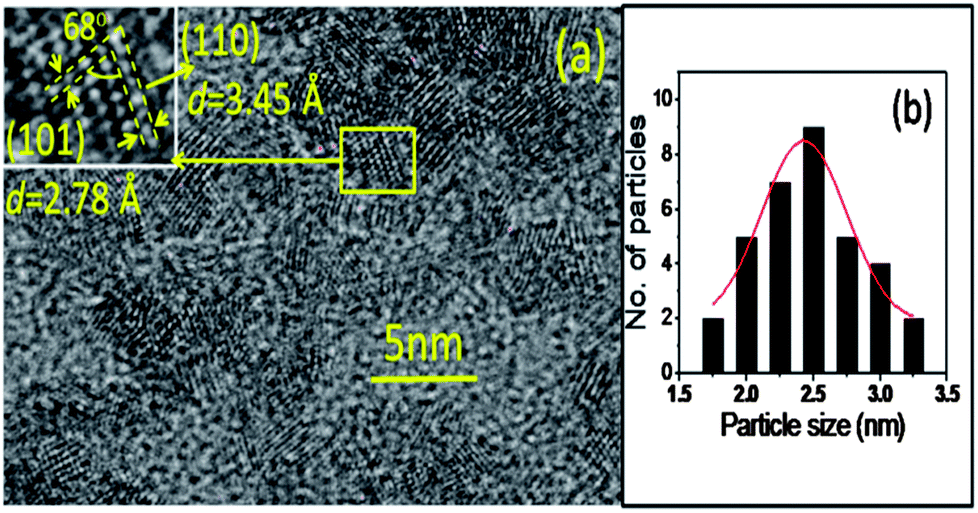
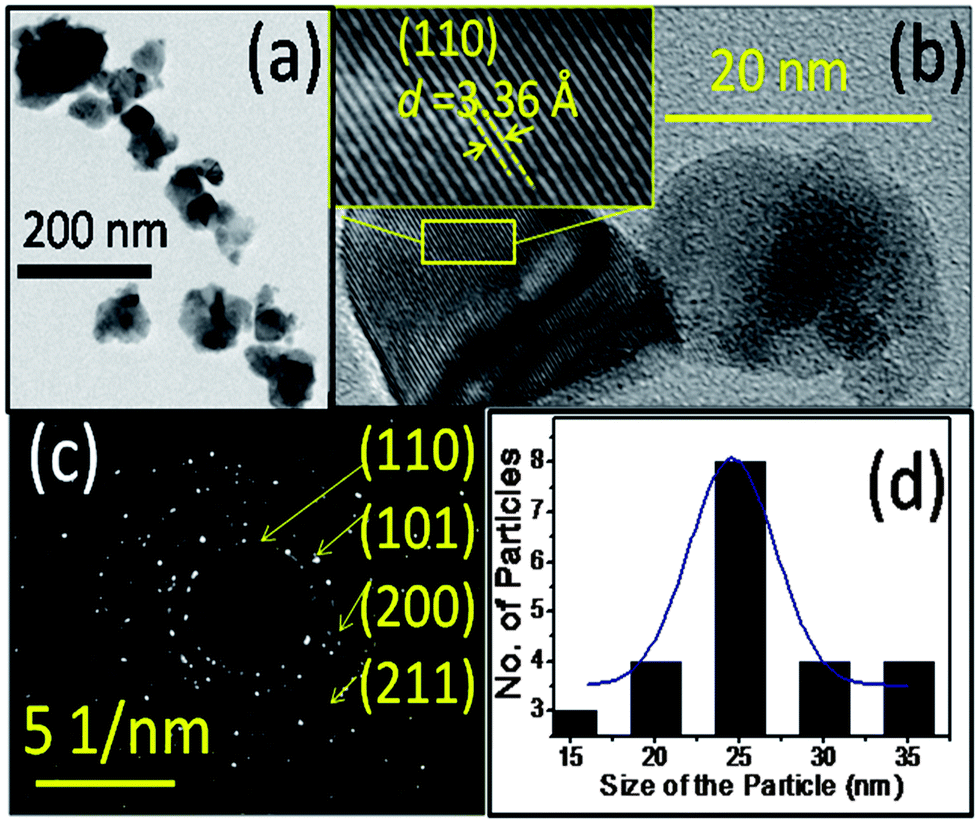
A HRTEM image of the as-prepared sample (Fig. 3a) shows nearly spherical clusters with an average particle size of ∼2.4 nm (Fig. 3b), which closely matches with the size estimated from the XRD analysis. These particle sizes are less than the reported Bohr radius (rB) of the SnO2 (2.7 nm) conforming to the QD structure.27 Furthermore, the HRTEM image displays two distinct ‘d’ spacings of 0.34 nm and 0.28 nm with a measured angle of 68° between them (inset of Fig. 3a). They closely match to the d spacing of the (110) and (101) planes of the rutile SnO2 phase, respectively. However, the d (0.345 nm) spacing is higher by ∼3.5% than the reported value (JCPDS # 41-1445). This high value of d spacing indicates the presence of a tensile strength in the as-prepared sample. TEM images show the presence of NPs in the annealed sample (Fig. 4a and b). The annealed sample exhibits a d spacing of 0.336 nm for SnO2 (110) planes shown in the HRTEM image (inset of Fig. 4b). Additionally, the selected area electron diffractions (Fig. 4c) displays spotty patterns, confirming the presence of NPs with different orientations with an improved crystalline nature for the annealed sample which shows no significant change in the lattice constant. Feng et al.24 reported a compressive strain in the SnO2 NPs synthesized by a sol–gel method, while Kar et al.23 found a tensile strain for the NPs prepared from a precursor of tin acetate. The nature of the strain in the NPs was thus influenced by the synthesis process. The distribution of the particle size for the annealed sample is displayed in Fig. 4d and shows an average size around 24.5 nm. Thus the HRTEM analysis of SnO2 particles supports the observation made from the XRD and field emission scanning electron microscopy (FESEM) studies.
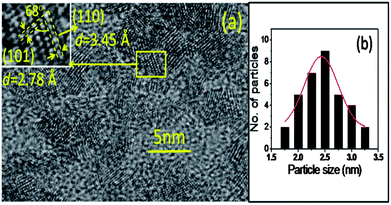 |
| | Fig. 3 (a) TEM image of the ultra-small SnO2 present in the as-prepared sample. The inset shows planes of the SnO2 and the corresponding angle. (b) Particle size distribution of the as-prepared sample. | |
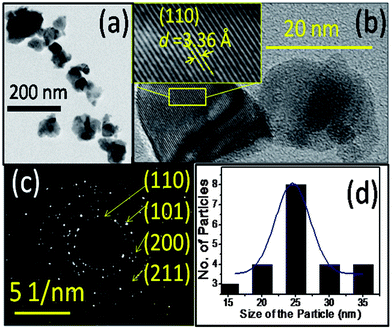 |
| | Fig. 4 TEM analysis of the annealed SnO2 sample (a) bright field image (b) HRTEM image (inset showing the zoomed-in (110) plane of SnO2) (c) SAED pattern (d) particle size distribution. | |
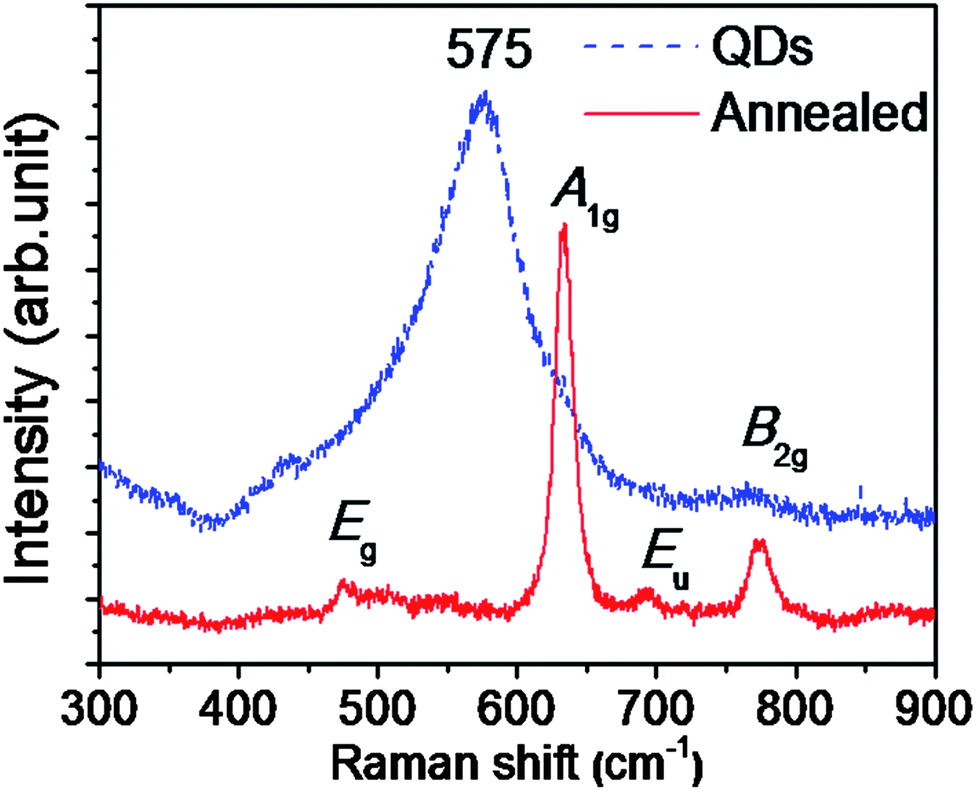
The Raman spectra for the annealed sample (Fig. 5) show peaks at 474, 633 and 775 cm−1. These mode frequencies are assigned to the Eg, A1g and B2g modes, respectively.28–30 IR modes can be active in the Raman spectrum due to the breakdown of symmetry in the nanostructures or in the presence of disorder. Thus an IR active Eu mode at 693 cm−1 with weak intensity is observed in the annealed sample (Fig. 5).28 In contrast, a strong broad peak at 575 cm−1 for the as-prepared QD sample is observed. This feature does not conform to the predicted Raman modes and is attributed to the possible off-stoichiometric surface of SnO2 QDs.30 DFT calculations showed that the peak at 573 cm−1 is due to in-plane ‘O’ vacancies on the surfaces.31 Since the surface to volume ratio is high in QDs, the related surface defect peak becomes dominant in the Raman spectra.
 |
| | Fig. 5 Raman spectra for the as-prepared QDs and the annealed samples. | |
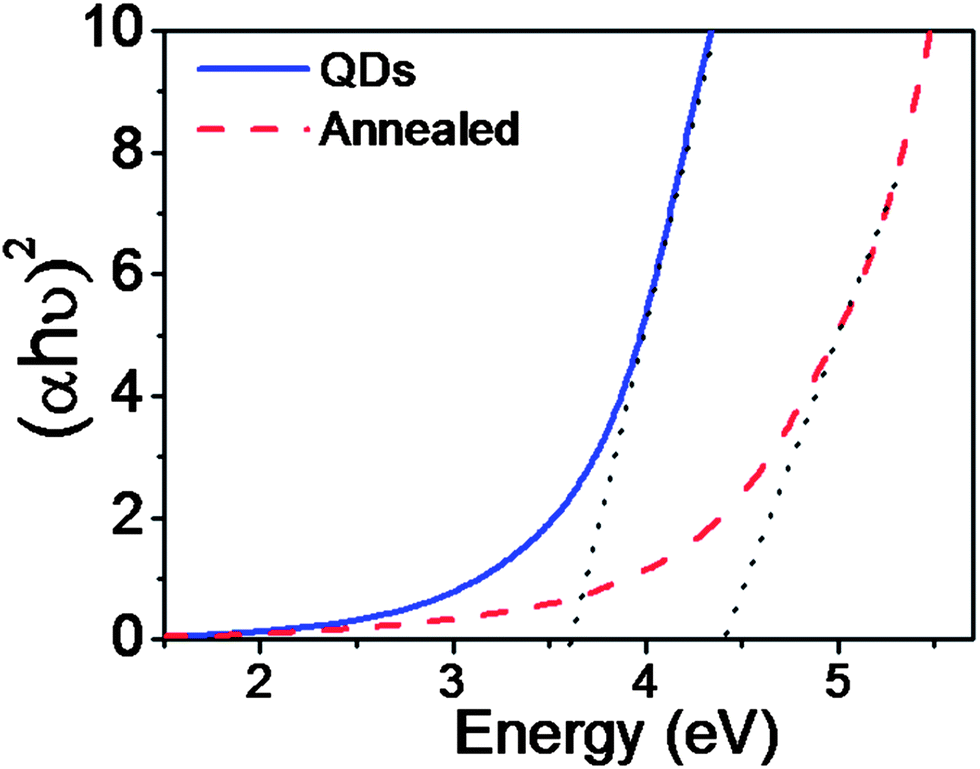
As the particle size approaches rB, the quantum confinement effect is strongly observed in the optical properties with a blue shift in the band gap energy. TEM, XRD and Raman studies on the as-prepared SnO2 reveal that the particle size is smaller than the rB of SnO2 and consequently it can exhibit a strong quantum confinement effect. UV-Vis absorption spectra were recorded for both samples (Fig. 6). The following equation (eqn (1)) is used to calculate the band gap of SnO2 NPs from the absorption spectra.
where
α is the absorption coefficient,
Eg is the bulk band gap energy, and
n = 1/2 for direct band gap materials like SnO
2. The band gap can be estimated by plotting (
αhν)
2vs. hν and extrapolating to zero absorption coefficients. The calculated band gap energy of the as-prepared sample is around 4.4 eV, which is much higher than that of the annealed sample. The
Eg value of the annealed sample matches closely to the reported bulk value of 3.6 eV. Size dependent optical properties of QDs are explained by the effective mass model.
32 When the QD radius is below the
rB, the electron hole motion is not correlated. In that case, the effective band gap energy is given by,
| |  | (2) |
where
r is the particle radius,
μ is the effective reduced mass (0.27
me for SnO
2),
33Eg is the bulk band gap energy (3.6 eV) and the dielectric constant, the
∈ of SnO
2 is 14. From the HRTEM study, the effective particle size of the sample is 2.4 nm. The calculated band gap energy using
eqn (2) is ∼4.35 eV which corroborates the observed band gap (
Fig. 6) exhibiting the quantum confinement effect for the as-prepared sample. Thus such NPs can provide a large surface area as a source of high surface energy.
34 Moreover, it can allow the formation of a totally charge depleted region due to the chemisorbed oxidized species. Concurrently, these factors can strongly influence the sensing aspects which are discussed below.
 |
| | Fig. 6 Band gap estimations from the absorption spectra of the annealed sample and the as-prepared SnO2 NPs. | |
Sensing studies
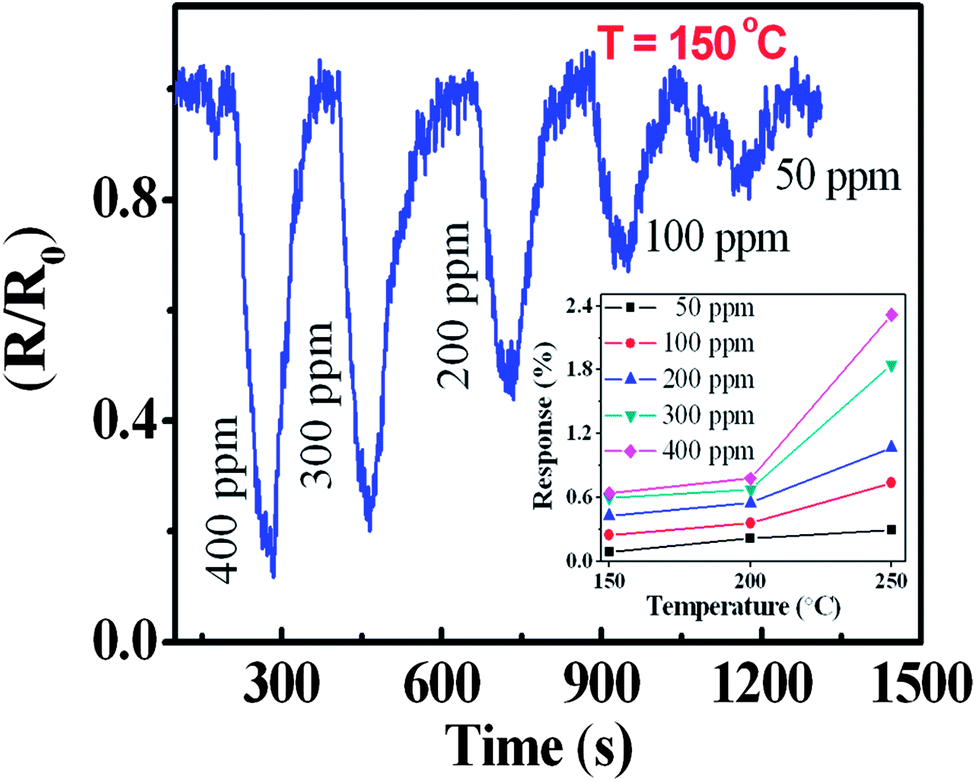
Fig. 7 depicts the sensor response for the as-prepared sample towards CH4 exposure at a typical temperature of 150 °C. The responses are shown as the relative variation in resistance (R/R0), where R0 is the base line resistance (∼56 kΩ at 150 °C) before the gas exposure. The ON and OFF signify exposure gas introduction and withdrawal time, respectively followed by a recovery. For the n-type semiconductor SnO2, a decrease in resistance results due to the release of bound electrons attached to the chemisorbed oxygen.1,6 There is a progressively increasing response with increasing concentrations of CH4 (Fig. 7). Experimentally, a detection of 50 ppm CH4 with a significant response was recorded. However, a low detection limit was evaluated after considering only the sensor signal which was three times above the noise level. The predicted value of around 30 ppm (Fig. 8) is the lowest detectable CH4 value for a pristine SnO2 system. For a comparative study, the sensor response is defined as S = (Ra − Rg)/Ra, where Ra and Rg are the electrical resistances in air and in the presence of the gas, respectively. The response to various CH4 concentrations are shown in the temperature range of 150–250 °C for the QDs (inset of Fig. 7). A monotonous increase in the ‘S’ value was observed up to 225 °C. Due to the desorption effect a moderate decrease in the value of S was however noticed in QDs above 225 °C. No distinct morphological change was observed for the QDs at and below 200 °C from the FESEM image. The annealed sample at 800 °C also responded progressively with increasing concentrations of CH4, even at a temperature of 150 °C (Fig. 9). Nevertheless, the sensor signal is comparatively weak and the corresponding S value is low (S < 1%, typically for 400 ppm at 200 °C) (inset of Fig. 9). Moreover, the response pattern for the annealed sample differed markedly with the results obtained for the as-prepared QDs. For the annealed sample, S was found to increase with rising operating temperatures without showing saturation for any of the concentrations (Fig. 9). This trend closely followed that reported6,15 for a crystalline thin film of SnO2, at and above 250 °C. In the present case, both samples showed quick recovery. The response and recovery times at 90% of the signal for 400 ppm of CH4 were found to be less than 50 seconds. This value is much lower than the reported value for the porous SnO2 nanorods which needed a few minutes for response and recovery at temperatures below 300 °C.26 The QDs sensor, therefore offers a quick detection of CH4 at low temperatures. The present samples showed no significant change in the base line after 2 minutes of exposure to oxidizing gas, like 15% O2, or reducing gas like 1000 ppm of H2, even up to 200 °C. This provides an apparent guideline for the interference from such analytes.
 |
| | Fig. 7 Sensor response of the as-prepared sample to various concentrations of CH4 at 150 °C. The inset shows the response of different CH4 concentrations exposed to the as-prepared sample at various temperatures. | |
 |
| | Fig. 8 The plot displays the linear variation of CH4 concentrations against the relative response for the as-prepared sample. The extrapolation of the curve beyond the experimental value of 50 ppm indicates a detection of 30 ppm CH4 after considering a sensor signal to noise ratio of more than three times above the noise level. | |
 |
| | Fig. 9 Relative responses after the exposure of the annealed sample to various concentrations of CH4. The inset displays variation in the response with temperatures. A low S value (S < 1) is observed for all concentrations in comparison to the as-prepared sample at and below 200 °C. | |
The operating temperature strongly influences the adsorption and desorption rates of oxygen ions on the metal–oxide surface, and therefore controls the sensor response. Various oxygen ions like O− and O2− in the temperature range of 100–200 °C and above are found to be chemically adsorbed on the metal–oxide surfaces and allow the formation of a depleted layer of charge carriers.1,6 Moreover, these O− and O2− start desorbing from the surface at temperatures ∼130 and 250 °C, respectively. The total surface energy which strongly depends on the size, shape and defects at surfaces can also influence the chemisorption process. Hence the interplay of the operating temperature and chemisorption of oxygen species, is a crucial step for sensing with reducing CH4, which upon reaction with the n-type SnO2 semiconductor exchanges carriers. This phenomenon led to a decrease in the resistance, as observed in the relative response. In the process, CH4 is oxidized to CH3–O firstly and ultimately gets transformed to CO2.13 The overall reduction processes can then be presented as,
| | | CH4 + 4O−(ads) → 2H2O + CO2 + 4e− | (3) |
| | | CH4 + 4O2− (ads) → 2H2O + CO2 + 8e− | (4) |
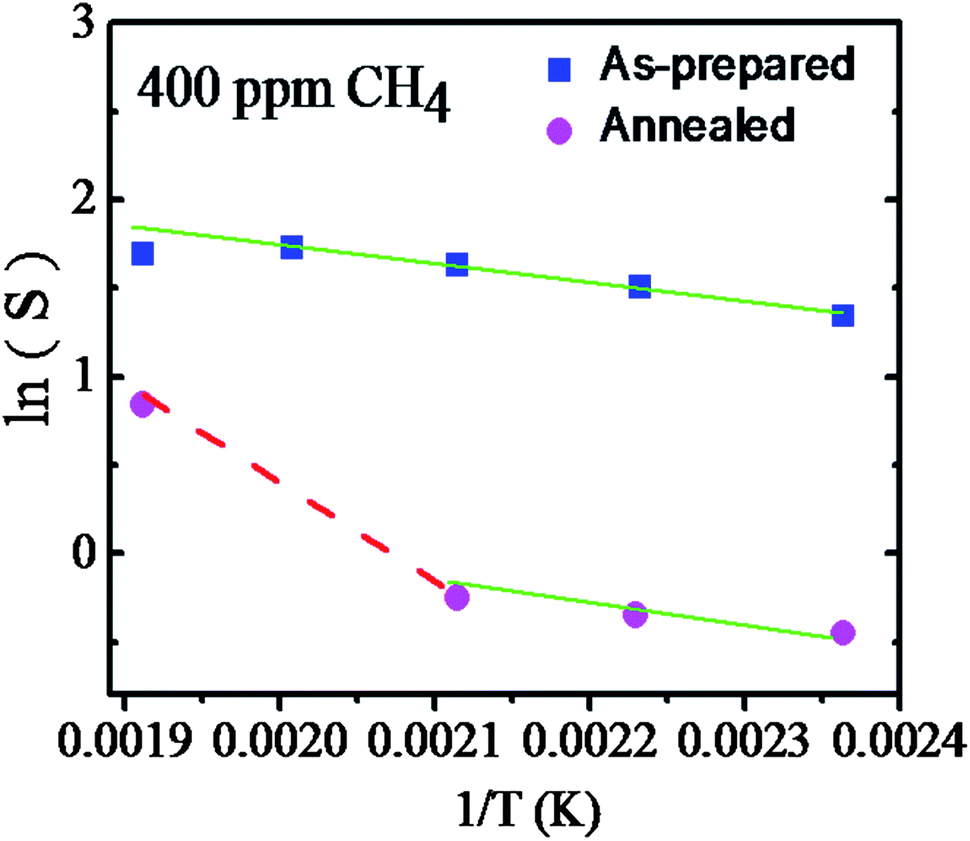
Eqn (3) dominates in the low temperature region while eqn (4) primarily operates at and above 200 °C. As discussed above, highly reproducible sensing results were obtained at and above 150 °C for both of the samples. However, a strong response was seen for the QDs system. The chemisorbed O− species, being stable at low temperatures, were then allowed to interact with CH4 dominantly for the sensing of the QDs. A reduction of the response, however, was observed at around 225 °C. This was ascribed to a high rate of desorption of O− species at these temperatures.1 In fact, with CH4 being thermodynamically stable, the surface energy of the SnO2 plays a key role in such a reduction reaction. The surface reactivity depends on the available free energy for promoting a reaction which can provide the appropriate activation energy (A.E.). QDs can possess an obviously larger amount of surface energy than that for the long grain of annealed samples.34,35Fig. 10 shows the Arrhenius plot of ln(S) with 1/T for both samples exposed to a typical concentration of 400 ppm of CH4. The QDs sample exhibited an activation energy of 90 meV. A similar value was also obtained for the annealed sample up to 200 °C (Fig. 10). Apparently, a sudden change in the slope of the Arrhenius plot took place above 200 °C. This abrupt change reflects a rather high A.E. of 180 meV. Accordingly, the observed change in the A.E. can be ascribed to the possible onset of a specific reaction involving the chemisorbed O2−, which is dominantly present at high temperatures. In fact, a high activation energy was reported,35,36 for sensing at high temperatures with a crystalline SnO2 thin film which closely resembles the present case of the annealed sample.
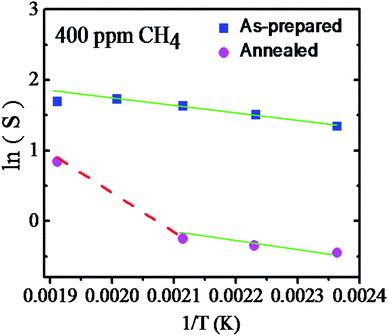 |
| | Fig. 10 Arrhenius plot for the calculation of the activation energy of 400 ppm CH4 exposure to the as-prepared and annealed samples. | |
The observed high sensitivity of the SnO2 NPs can be explained taking into account the increased surface area to volume ratio. However, this observation does not elucidate the variation in sensor response with temperature and the change in A.E. for both these samples. High surface energy could be a source of easy reaction as discussed. Various factors e.g. size, shape and defects control the surface energy. In fact, crystallographic planes e.g. (110) and (101) of stoichiometric SnO2 are more stable energetically than the corresponding planes of reduced states having O or Sn terminated surface states with high surface energy.37 Ottaviano et al.38 have also elucidated the existence of an off-stoichiometric surface in the SnO2 thin film due to oxygen deficiencies using X-ray photoelectron spectroscopy and XRD studies in detail. In our study, a broad feature in the XRD spectrum was observed for the as-prepared QDs sample (Fig. 2). Raman studies also exhibited (Fig. 5) a broad peak corresponding to an off-stoichiometric phase of SnO2 in the as-prepared QDs sample. The stoichiometric phase is therefore dominantly present in the annealed sample, whereas off-stoichiometric reduced states due to abrupt surface terminations with a large surface to volume ratio are predominant in the QDs sample. It is generally understood that a certain number density of surface states is available in both of these nanostructured samples. Defects of the surface states contribute to the excess surface energy, which can easily initiate reactions at a low A.E. of 90 meV with the assistance of adsorbed O− on both the SnO2 NPs, as described in eqn (3). However, reaction with O2− (eqn (4)) can be prevalent over the reaction with O− (eqn (3)) at a temperature above 200 °C and the process releases excess electrons back to the SnO2 NPs. Both the availability of extra charge and the onset of alternative surface reaction with O2− for the annealed sample may contribute to a further decrease in the resistance of the system and to the abrupt change in the sensor response.1,6 However, the associated process needed an A.E. of 180 meV for high temperature operation. No significant sensing interaction could occur at a temperature below the operating temperature of 200 °C for the annealed sample whereas QDs surface presumably, giving a response only with O− species with a low A.E of 90 meV.
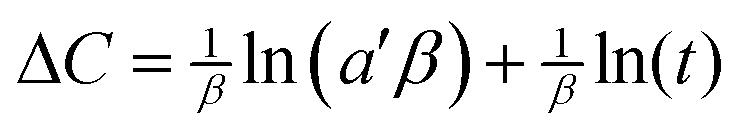
From the point of view of adsorption kinetics, a significant change can occur due to the variation in reaction species. Further support was therefore attempted to analyze the adsorption mechanism following the Elovich model39 and subsequent determination of reaction kinetics. Previously this model40,41 was employed to decipher reaction kinetics at sensor surfaces (eqn (5))
| | 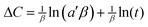 | (5) |
where Δ
C is defined as the change in DC conductance at time
t with respect to the baseline at
t = 0 due to an adsorption of a toxic gas.
β denotes a possible potential barrier for successive adsorption and
a′ is the initial adsorption rate. In the present case, the amount of CH
4 adsorbed at the reactive sites of SnO
2 was assumed to influence Δ
C proportionately and the surface was screened by a ‘potential barrier’ for successive adsorption. Plots of Δ
C vs. ln(
t) were derived following the Elovich model showing a characteristic linear variation for the typical temperatures of 200 and 250 °C (
Fig. 11). Corresponding parameters were obtained upon carrying out a linear regression fitting to the Elovich plots. The deduced value of
β for the QDs was found to decrease from a value of 1.5 to 0.5 MΩ with an increase in temperature from 150 °C to 250 °C while
a′ increased from a value of 1 × 10
−6 to 4 × 10
−6 in the same temperature range. Similarly,
β values of the annealed sample reduced drastically from a value of 18 to 2 MΩ for the same variation in temperature. However, these values were found to be higher than the values obtained for the QDs. In the case of the annealed sample, the value of
a′ is favorably enhanced by an order of magnitude from a value of 3 × 10
−7 to 2.2 × 10
−6 with increasing temperature from 150 °C to 250 °C. Notably, at 250 °C, the predominant species was O
2− whose adsorption was favourable for the annealed sample. The increased temperature, therefore allowed the annealed sample to a great extent to induce adsorption for initiating a reaction with CH
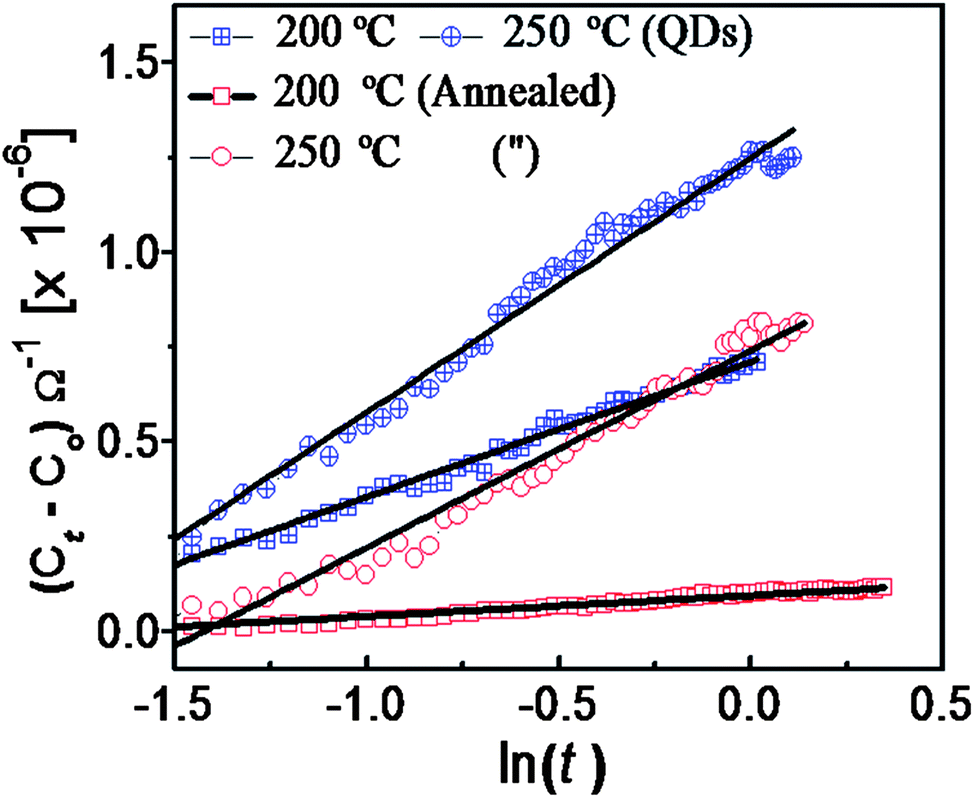
4 strongly. This observation supports the trend of sensor output with a variation of temperature. In order to shed light on the role of the chemisorbed species, we investigated the reaction kinetics by examining the reaction order which could be affected by the change of reaction species. For such studies the conductance of the sample as a function of time was measured at different operating temperatures (100–250 °C) typically for 400 ppm exposure. The reaction order was determined from the relationships of log(
Ce −
Ct))
vs. t where
Ce, and
Ct were the film conductance at the beginning and at any time
t of the reaction, respectively (
Fig. 12).
42 The rate constant,
k was determined from the slope of the linear fittings (
Fig. 12). The surface reaction with CH
4 obeyed the first-order kinetics indicating a dependence on the singular reactant. The
k values varied systematically with 3.49, 3.95 and 4.76 at temperatures of 150, 200 and 250 °C, respectively for the QDs. The
k values for the annealed sample were 3.05, 3.96 and 3.03 at temperatures of 150, 200 and 250 °C, respectively. QDs showed a steady and systematic increase in the
k values following a particular reaction of first order kinetics in contrast to the annealed sample. The decrease in
k value in the latter indicates a relatively low reactivity on the SnO
2 surfaces at 250 °C with O
− with an onset of a change in the reaction species, from O
− to O
2− species for the associated reaction in which the higher temperature provided the required A.E. At a particular temperature, the abundance of various oxygenated species presumably remains constant and in such circumstances, only modulation of a particular species cannot justify a decrease in
k value. Instead, it may be due to the fact that the reaction kinetics determines the reactant species. Studies of the A.E. from the sensor response offered an indication of the recourse of reaction specificity with various oxygenated species. Whereas the evaluation of the reaction kinetics from the Elovich model led to a conclusive point of understanding that the reaction kinetics were the reason for the observed change in the A.E. for the annealed sample.
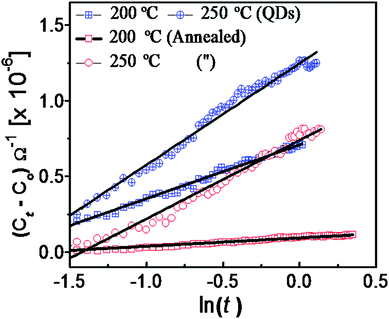 |
| | Fig. 11 Elovich plot for the annealed and QDs samples to focus on the adsorption at various temperatures. | |
 |
| | Fig. 12 First order kinetics for CH4 adsorption following the Elovich plot for the annealed and the QDs sample at various temperatures. | |
Experimental section
Synthesis and characterization
Monodispersed SnO2 NPs were synthesized from the reaction of 0.02 M stannic chloride (SnCl4, Alfa Aesar) and 2 M NH4OH (MERCK) in a controlled fashion to keep the pH of the solution around 8.5. The reaction proceeded under magnetic stirring at a controlled temperature of 80 °C for 15 min. A white gel like precipitate was then collected and washed with distilled water (MilliQ, 18 MΩ) to remove traces of Cl− ions. The final white powder collected after heating at 100 °C for 30 min was referred to as the as-prepared SnO2. This was further annealed at 800 °C for 1 h in air to obtain the large grains with long range order.
XRD at RT was carried out using Cu Kα radiation (STOE). Morphologies of these samples were obtained using FESEM (Zeiss SUPRA 55). HRTEM images were taken by the Libra 200 Zeiss electron microscope. The preparation of samples for HRTEM involved dispersing the powder material in isopropanol solvent followed by ultrasonication for 3 minutes. Thereafter, a drop of the mixture was placed on the carbon coated Cu-grid for TEM study. Micro-Raman spectroscopy (InVia, Reinshaw) was carried out using 514.5 nm excitation of an Ar+ laser with 1800 gr mm−1 grating, and thermoelectric cooled CCD detector in the backscattering mode. UV-Visible spectroscopy (Avantes) was used for the absorption study of SnO2 NPs in the wavelength range of 200 nm to 800 nm. A well dispersed suspension of SnO2 NPs (0.5 mg/2 ml) in distilled water was used for recording the absorption spectra which provided the absorption co-efficient (α) for calculating the optical band gap of the material.
Sensing measurement
For the sensing studies, these NPs were dispersed in ethanol solution and spin coated at 1000 rotations per minute on the interdigitated Au electrodes (IDE) which were deposited by the thermal evaporation on the SiO2 (100 nm)/Si substrates.42 The gas sensing experiments were carried out using a custom built gas exposure facility system equipped with mass flow controllers (MKS) aided by a computer and protected by pneumatic valves. A controlled gas mixture (with synthetic air) entered the sensing chamber through a valve for delivery to the sample which was mounted on a PID controlled heater. This heating stage goes to an operating temperature of 500 °C with a resolution of ±1 °C. Ultra High purity CH4, NH3 and H2 (Deluxe Industrial Gas) gas mixtures in UHP N2 were used for this study. The sensor response upon gas exposure was manifested as resistance change and was recorded using Micro Ohm Meter (Agilent 34401). The exposure facility can be controlled manually or externally using Supervisory Control and Data Acquisition (SCADA) software. Details of the gas exposure facility were reported earlier.42
Conclusions
We report the growth of nearly mono-dispersed QDs of SnO2 using a soft chemical route without a capping agent. After confirming the quantum nature of the SnO2 crystallites, a comparative study of CH4 sensing was carried out with the crystalline nanoparticles of 25 nm. Off-stoichiometry in the SnO2 QDs was discussed in relation to the increased sensitivity towards CH4 at the low temperature of 150 °C. The significant role of the chemisorbed oxygen species at various temperatures affecting the sensing mechanism was discussed. The activation energy for the surface reaction was deduced to corroborate the role of the chemisorbed species. The study also points to the possibility of detecting CH4 as low as 30 ppm at 150 °C using SnO2 QDs. The response and recovery time being less than a minute, the QDs based sensors are found to be unique at low temperature for CH4 detection. On the contrary, the annealed samples of size ∼25 nm behave like bulk SnO2 showing limited sensitivity. The role of the chemisorbed species, particularly O− was found to be confined to QDs at low temperature. In contrast, the O2− species reacted preferably with the annealed sample. The onset temperature of change in reaction with oxygenated species of O− to O2− is 200 °C. The QDs allow the making of compact and portable sensors which have potential uses in monitoring CH4 detection at affordable low power.
Acknowledgements
We thank Ramanathaswamy Pandian of SND, IGCAR, Kalpakkam for recording FESEM images and S. Amirthapandian of MPD, IGCAR, Kalpakkam for HRTEM analysis.
Notes and references
- K. Wetchakun, T. Samerjaia, N. Tamaekonga, C. Liewhiran, C. Siriwong, V. Kruefu, A. Wisitsoraat, A. Tuantranont and S. Phanichphant, Sens. Actuators, B, 2011, 160, 580 CrossRef CAS PubMed.
- A. Lewandowska, I. Kocemba and J. Rynkowski, Pol. J. Environ. Stud., 2008, 17, 433 CAS.
- K. D. Schierbaum, U. Weimar and W. Göpel, Sens. Actuators, B, 1992, 7, 709 CrossRef CAS.
- D. Kohl, J. Phys. D: Appl. Phys., 2001, 34, 125 CrossRef.
- J. Shemshada, S. M. Aminossadatia and M. S. Kizil, Sens. Actuators, B, 2012, 171, 77 CrossRef PubMed.
- M. Batzill and U. Diebold, Prog. Surf. Sci., 2005, 79, 47 CrossRef CAS PubMed.
- S. M. Sedghi, Y. Mortazavi and A. Khodadadi, Sens. Actuators, B, 2010, 14, 512 Search PubMed.
- P. Bhattacharyya, P. K. Basu, C. Lang, H. Saha and S. Basu, Sens. Actuators, B, 2008, 129, 551 CrossRef CAS PubMed.
- L. Sun, F. Qiu and B. Quan, Sens. Actuators, B, 2000, 66, 289 CrossRef CAS.
- A. Cabot, A. Vilà and J. R. Morante, Sens. Actuators, B, 2002, 84, 12 CrossRef CAS.
- M. Wang and Y. Feng, Sens. Actuators, B, 2007, 123, 101 CrossRef CAS PubMed.
- J. C. Kim, H. K. Jun, J.-S. Huh and D. D. Lee, Sens. Actuators, B, 1997, 45, 271 CrossRef CAS.
- S. Basu and K. P. Basu, J. Sens., 2009, 2009, 1 Search PubMed.
- G. Korotcenkov, Sens. Actuators, B, 2005, 107, 209 CrossRef CAS PubMed.
- Y. Lu, J. Li, J. Han, H.-T. Ng, C. Binder, C. Partridge and M. Meyyappan, Chem. Phys. Lett., 2004, 391, 344 CrossRef CAS PubMed.
- F. Quaranta, R. Rella, P. Siciliano, S. Capone, M. Epifani, L. Vasanelli, A. Licciulli and A. Zocco, Sens. Actuators, B, 1999, 58, 350 CrossRef CAS.
- S. Brovelli, A. Chiodini, A. Lauria, F. Meinardi and A. Paleari, Phys. Rev. B: Condens. Matter Mater. Phys., 2006, 73, 073406 CrossRef.
- C. Killic and A. Zunger, Phys. Rev. Lett., 2002, 88, 095501 CrossRef.
- J. Pan, H. Shen and S. Mathur, J. Nanotechnol., 2011, 2012, 1 Search PubMed.
- J. M. Wu, Nanotechnology, 2010, 21, 235501 CrossRef PubMed.
- J. Pan, H. Shen and S. Mathur, J. Nanotechnol., 2011, 2012, 1 Search PubMed.
- J. M. Wu, Nanotechnology, 2010, 21, 235501 CrossRef PubMed.
- A. Kar, S. Kundu and A. Patra, J. Phys. Chem. C, 2011, 115, 118 CAS.
- G. Feng, W. S. Fen, F. S. Chun, K. L. Meng, X. Q. Yong, J. Z. Guang, X. Dong and R. Y. Duo, J. Phys. Chem. B, 2004, 108, 8119 Search PubMed.
- P. Seung-Keun, S.-H. Yu, P. Nicola, W. Seunghee, J. Byung-Chul, C. Young-Hoon, C. Yong-Hun, S. Yung-Yun and P. Yuanzhe, J. Mater. Chem., 2012, 22, 2520 RSC.
- A. Biaggi-Labiosa, F. Sola, M. Lebron-Colon, L. J. Evans, J. C. Xu, G. W. Hunter, G. M. Berger and J. M. Gonzalez, Nanotechnology, 2012, 23, 455501 CrossRef CAS PubMed.
- E. J. H. Lee, C. Ribeiro, T. R. Giraldi, E. Longo, E. R. Leite and J. A. Varela, Appl. Phys. Lett., 2004, 84, 1745 CrossRef CAS.
- L. Abello, B. Bochu, A. Gaskov, S. Koudryavtseva, G. Lucazeau and M. Roumyantseva, J. Solid State Chem., 1998, 135, 78 CrossRef CAS.
- R. S. Katiyar and R. S. Krishnan, Phys. Lett. A, 1967, 25, 525 CrossRef CAS.
- K. N. Yu, X. Yonghong, L. Yulong and X. Caoshui, Phys. Rev. B: Condens. Matter, 1997, 55, 2666 CrossRef CAS.
- L. Z. Liu, T. H. Li, X. L. Wu, J. C. Shen and P. K. Chu, J. Raman Spectrosc., 2012, 43, 1423 CrossRef CAS.
- L. E. Brus, J. Phys. Chem., 1986, 90, 2555 CrossRef CAS.
- K. J. Button, C. G. Fonstad and W. Dreybrodt, Phys. Rev. B: Solid State, 1971, 4, 4539 CrossRef.
-
G. Cao and Y. Wang, Nanostructures and Nanomaterials Synthesis, Properties, and Applications, World scientific publishing Co. Plc. Ltd, USA, 2nd edn, 2004 Search PubMed.
- G. Zhang and M. Liu, Sens. Actuators, B, 2000, 69, 144 CrossRef CAS.
- Th. Becker, S. Ahlers, C. Bosch-Braunmühl, G. Müller and O. K. Wetter, Sens. Actuators, B, 2001, 77, 55 CrossRef CAS.
- W. Bergermayer and I. Tanaka, Appl. Phys. Lett., 2004, 84, 909 CrossRef CAS.
- L. Ottaviano, M. Kwoka, F. Bisti, P. Parisse, V. Grossi and S. Santucci, Thin Solid Films, 2008, 517, 6161 CrossRef PubMed.
- M. J. D. Low, Chem. Rev., 1960, 60, 267 CrossRef CAS.
- I. Singh and R. K. Bedi, Solid State Sci., 2011, 13, 2011 CrossRef CAS PubMed.
- R. Tongpool and S. Yoriya, Thin Solid Films, 2005, 477, 148 CrossRef CAS PubMed.
- P. Sahoo, S. Dhara, S. Dash, S. Amirthapandian, A. K. Prasad and A. K. Tyagi, Int. J. Hydrogen Energy, 2013, 38, 3513 CrossRef CAS PubMed.
|
| This journal is © The Royal Society of Chemistry 2014 |
Click here to see how this site uses Cookies. View our privacy policy here.