 Open Access Article
Creative Commons Attribution 3.0 Unported Licence
Field induced transitions and interlayer interactions in intermediate smectic phases
L.
Johnson
,
S.
Jaradat
and
H. F.
Gleeson
*
School of Physics and Astronomy, University of Manchester, Manchester, M13 9PL, UK. E-mail: helen.gleeson@manchester.ac.uk
First published on 8th November 2013
Abstract
A series of liquid crystal mixtures displaying wide three- and four-layer intermediate phases are reported. The mixtures are formed from a selenium-containing antiferroelectric material combined with up to 9% (by weight) of a chiral dopant. We describe physical properties including spontaneous polarization, layer spacing and tilt for mixtures including up to 9% concentration of the chiral dopant. Such measurements offer an insight into the factors that affect the stability of the intermediate smectic phases. However, a quantitative measure of the interlayer interaction strength can be obtained from analysis of field-temperature phase diagrams. Therefore, the field-temperature phase diagrams are also determined in the intermediate phase regime of the mixtures containing up to 5% w/w concentration of the chiral dopant and compared with theoretical predictions. Excellent agreement with the theory is observed for the pure material, though for mixtures with increasing concentrations of chiral dopant, deviations from the theory are recorded, in particular in the nature of the transition from the four-layer structure to the three-layer structure. Quantitative measurements of the interlayer interaction constants are deduced from the gradients of the field thresholds, and the interlayer pairing is found to reduce significantly with an increasing concentration of chiral dopant. An interlayer interaction constant of 147 ± 13 N m−2 K−1 is found in the pure material, reducing to 21 ± 4 N m−2 K−1 in the mixture with concentration of chiral dopant of 5%. Measurement of the interlayer interaction constants from the field-temperature phase diagrams is shown to give a quantitative understanding of the importance of the interlayer interaction, which is only indicated qualitatively by other measurements. Finally, some evidence is presented for an additional field-induced transition observed in temperature regions close to a triple point on the field-temperature phase diagram.
1. Introduction
Smectic liquid crystals are fluid states of matter in which molecules possess both orientational and positional order. Remarkably, certain smectic phases can exhibit ferroelectricity, ferrielectricity and antiferroelectricity;1 in all such cases the material is chiral and the director![[n with combining circumflex]](https://www.rsc.org/images/entities/i_char_006e_0302.gif) (the average molecular direction) is tilted with respect to the layer normal. The structures that allow such electronic properties to emerge, and the phase sequences that occur in the systems, are the subjects of much interest, not least because of the potential for devices that rely on the rapid electro-optic response observed (of microsecond order). Ferroelectricity and antiferroelectricity can also be observed in bent core systems, when the achiral molecules show polar order and form chiral superstructures.2 In the tilted smectic phases, rod-like molecules, consisting of a rigid core and flexible alkyl chains, are arranged in layers with their long-axes tilted at a temperature-dependent tilt angle, θ, with respect to the layer normal. The projection of the director
(the average molecular direction) is tilted with respect to the layer normal. The structures that allow such electronic properties to emerge, and the phase sequences that occur in the systems, are the subjects of much interest, not least because of the potential for devices that rely on the rapid electro-optic response observed (of microsecond order). Ferroelectricity and antiferroelectricity can also be observed in bent core systems, when the achiral molecules show polar order and form chiral superstructures.2 In the tilted smectic phases, rod-like molecules, consisting of a rigid core and flexible alkyl chains, are arranged in layers with their long-axes tilted at a temperature-dependent tilt angle, θ, with respect to the layer normal. The projection of the director ![[n with combining circumflex]](https://www.rsc.org/images/entities/i_char_006e_0302.gif) onto the layer plane is known as the c-director. In the chiral phases the azimuthal tilt direction precesses from one layer to the next creating a helicoidal structure with a pitch that is usually of the order of hundreds of layers.
onto the layer plane is known as the c-director. In the chiral phases the azimuthal tilt direction precesses from one layer to the next creating a helicoidal structure with a pitch that is usually of the order of hundreds of layers.
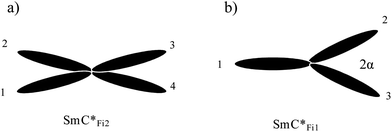
Ferroelectricity was discovered in the chiral smectic-C (SmC*) phase,3 in which the molecules in successive layers point in approximately the same direction, modified by the small angular displacement due to the chirality. A spontaneous polarization is observed perpendicular to the tilt direction and layer normal. The SmC*α phase is often observed at temperatures just below the non-tilted smectic phase, SmA*, and although it has the same symmetry as the SmC* phase, it has a much shorter pitch-length of around ten layers and is characterised by low values of tilt angle.4 An antiferroelectric tilted chiral smectic phase, SmC*A, was discovered in 1989.1 This phase has an anticlinic ordering, such that the tilt direction, and hence the direction of the spontaneous polarization, alternates in successive layers. Two further intermediate phases have been confirmed in the temperature region between the SmC* and SmC*A phases,5 and several resonant X-ray scattering experiments on different materials displaying these subphases have determined details of the three and four layer periodicity.4,6 The three-layer phase, SmC*Fi1, is ferrielectric whereas the four-layer phase, SmC*Fi2, is antiferroelectric. Resonant X-ray scattering experiments7–9 and optical rotation measurements,10 have confirmed that the structures of the intermediate phases are biaxial, and Fig. 1(a) and (b) depict the structures of the three-and four-layer phases; the c-director is indicated for each layer in the repeat unit and the distortion angle, α, is also shown.
The factors that influence the stability of the intermediate phases have been the subject of considerable theoretical and experimental research. It has been clear since their first discovery that chirality is an important factor in stabilising these phases and adding small amounts of chiral dopant to a host liquid crystal offers a convenient way of modifying materials for study.11 However, both theory and experiment have shown that other factors can also have a significant influence on the intermediate phase stability.11–13 In particular, in a family of mixtures similar to that studied here, interlayer interactions have been implicated in influencing the stability of the intermediate phases. Qualitative insight into the interlayer interactions can be obtained by correlating measurements of layer spacing, steric and optical tilt and spontaneous polarization with the stability of the intermediate phases in mixtures. However, it has recently been shown that the interlayer interactions can also be studied quantitatively using theories that consider the interactions between adjacent layers to predict the stability of the intermediate phases in the presence of an applied electric field.14 By measuring thresholds associated with the field-induced phase changes it is possible to deduce values of the interlayer interaction constant quantitatively, allowing a detailed understanding of the characteristics of the intermediate phases and how the strength of interlayer pairing influences the stability. In this paper, we use this approach to deduce the influence of an increasing concentration of chiral dopant on the interlayer interaction strength in a series of materials. Further, we correlate the values obtained for the interlayer interaction strength with qualitative information deduced from properties including phase stability, optical and steric tilt, spontaneous polarization and layer spacing. This allows the first quantitative examination of the dependence of the stability of the intermediate phases on the interlayer interaction strength and a deeper understanding of the factors that influence the stability of the intermediate phases than has hitherto been available.
2. The influence of electric fields on the intermediate phases; threshold equations
Tilted smectic phases can undergo both phase changes and changes in orientation upon the application of an external electric field. The field-dependence of the apparent tilt angle, and hence the field-dependence of the phase in chiral tilted smectic systems was investigated many years ago by Hiraoka et al.,15 who concentrated on the transitions between SmA, SmC*α and SmC* phases. However, these and other experiments are limited by narrow phase stability typically associated with the intermediate phases. Introducing a chiral dopant to liquid crystal materials widens the stability of the intermediate phases, allowing a greater depth of study into their properties.11The field-temperature phase diagram of a system exhibiting both three- and four-layer intermediate phases is shown schematically in Fig. 2. Resonant X-ray scattering16 has shown that at higher temperatures in the SmC*Fi2 phase (TA in Fig. 2) a single phase transformation to the SmC* phase is observed upon increasing the applied electric field. At lower temperatures in the SmC*Fi2 phase (TB in Fig. 2) a four-layer phase transforms to a three-layer phase as the electric field increases. Interestingly, an additional phase, which resonant X-ray scattering indicates also has a three-layer structure, has been observed at intermediate field strengths mediating the transition between the SmC*Fi1 and the SmC* phases.17 A pitch-fork structure as shown in Fig. 3 has been suggested for this ferrielectric biaxial phase. Rather simple expressions which depend on the interlayer interaction strength can be deduced for the field-temperature thresholds,14 as summarised below.
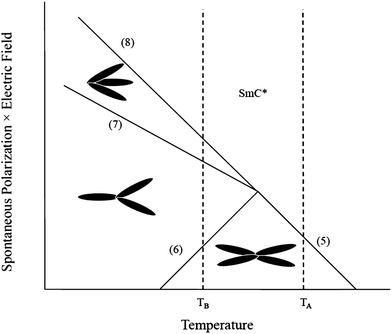 | ||
| Fig. 2 Schematic of phase diagram. The structures of the phases are given. The thresholds, which are discontinuous, are numbered, referring to the equation number ((5)–(8)) that describes that particular threshold. At TA, upon increasing the electric field from zero, the phase sequence is SmC*Fi2–SmC*. At TB, upon increasing the electric field from zero, the phase sequence is SmC*Fi2–SmC*Fi1–SmC*Fi1_2–SmC*. | ||
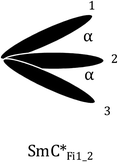 | ||
| Fig. 3 Suggested structure of the field induced three-layer ‘pitch-fork’ phase. The projection of the molecules on the layer plane is shown, with adjacent layers numbered. α is the distortion angle. | ||
Osipov and Gorkunov's model18 proposes that the free energy of the smectic phases is made up of interactions between adjacent layers, biquadratic and chiral interactions and terms due to spontaneous polarization of the material. This free energy model can be used to predict the thresholds of the field-induced transitions between intermediate phases. The interactions between the nearest neighbour, the next nearest neighbour and the third nearest neighbour layers are calculated for the different phase structures and, to first order, the biquadratic coupling and chirality interactions are neglected. A further assumption made in ref. 17 and expanded on in ref. 14, summarising arguments in ref. 12 and 19, is that all temperature dependence is due to the nearest neighbour interactions, i.e. that the interlayer interaction strength Δ can be described by Δ = Δ0(T* − T). T* is the (virtual) transition temperature from SmC* to SmC*A phase in the absence of subphases and Δ0 is the bare interaction strength. The free energy of the SmC*, and SmC*Fi2 phases in the presence of an electric field, E, are FC and FFi2 respectively, where,
| FC = Δ + J2 + J3 − PsE, | (1) |
| FFi2 = −J2. | (2) |
FFi1 = (Δ + J2)(2![[thin space (1/6-em)]](https://www.rsc.org/images/entities/char_2009.gif) cos2 cos2![[thin space (1/6-em)]](https://www.rsc.org/images/entities/char_2009.gif) α − 2 α − 2![[thin space (1/6-em)]](https://www.rsc.org/images/entities/char_2009.gif) cos cos![[thin space (1/6-em)]](https://www.rsc.org/images/entities/char_2009.gif) α − 1)/3 + J3 − 2(PsE α − 1)/3 + J3 − 2(PsE![[thin space (1/6-em)]](https://www.rsc.org/images/entities/char_2009.gif) cos cos![[thin space (1/6-em)]](https://www.rsc.org/images/entities/char_2009.gif) α)/3 + PsE/3. α)/3 + PsE/3. | (3) |
FFi1_2 = (Δ + J2)(2![[thin space (1/6-em)]](https://www.rsc.org/images/entities/char_2009.gif) cos2 cos2![[thin space (1/6-em)]](https://www.rsc.org/images/entities/char_2009.gif) α + 2 α + 2![[thin space (1/6-em)]](https://www.rsc.org/images/entities/char_2009.gif) cos cos![[thin space (1/6-em)]](https://www.rsc.org/images/entities/char_2009.gif) α − 1)/3 + J3 − 2(PsE α − 1)/3 + J3 − 2(PsE![[thin space (1/6-em)]](https://www.rsc.org/images/entities/char_2009.gif) cos cos![[thin space (1/6-em)]](https://www.rsc.org/images/entities/char_2009.gif) α)/3 − PsE/3. α)/3 − PsE/3. | (4) |
Manipulation of these free energy expressions allows the electric field-dependent thresholds between the phases to be deduced:
 | (5) |
 | (6) |
 | (7) |
 | (8) |
Using the thresholds predicted by eqn (5)–(8) a field-temperature phase diagram for the intermediate smectic phases can be produced as is shown schematically in Fig. 2. Clearly, a linear dependence of the threshold on the parameter PsE is predicted, with the gradient of each of the thresholds related to the layer interaction strength, Δ0. Experimentally determined field-temperature phase diagrams can therefore be analysed using fits to the equations, allowing quantitative information to be obtained regarding the interactions between layers for different phases and materials. There are a few reports of field-temperature phase diagrams produced14,16,23 for different smectic systems displaying three- and four-layer phases. However, the only quantitative analysis of the threshold gradients, yielding a value for the smectic layer interaction strength was in ref. 14 for a single mixture, offering no insight to the relationship between Δ0 and phase stability.
This paper is arranged as follows. Firstly, we consider how parameters including spontaneous polarization, layer spacing measurements and tilt angle can reveal qualitative information on the factors that affect the stability of the intermediate smectic phases. In the second half of the paper we determine details of electric field-induced transitions between phases through measurements of the field-dependence of the optical tilt angle. Using the thresholds from the phase diagrams and eqn (5)–(8) we determine values of Δ0 with respect to the concentration of chiral dopant in the materials studied, providing quantitative information on the relationship between the interlayer interaction strength and the phase stability.
3. Materials and measurements
Measurements were performed on the selenium-containing liquid crystal compound KC-983 mixed with the chiral dopant S1011 (Merck Ltd.) in concentrations up to 9%. The structures of the compounds are given in Fig. 4. The pure mixture is denoted here as A, the mixture with 1% w/w chiral dopant as A1 and so on up to A9.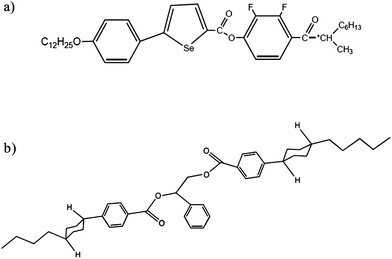 | ||
| Fig. 4 Chemical structures of (a) the liquid crystal material KC-983 and (b) the chiral dopant S1011. | ||
These mixtures have been studied before; the high-temperature regime was the subject of a detailed study that allowed the extent of the SmC*α phase to be determined and the influence of chirality quantified.24 The chiral dopant enhances the stability of the intermediate phases, as has been observed in a similar family of materials,11 and certain of the mixtures have therefore also been studied in detail via resonant X-ray scattering.16,17 The phase diagram is shown in Fig. 5; the transition temperatures were primarily determined via polarizing microscopy (using both devices and free-standing films) and indicate a clear widening of intermediate phases as the concentration of the chiral dopant increases, from a total range of ∼2.5 K in pure material A to ∼17 K in the A5 mixture. For mixtures with ≥6% w/w concentration of chiral dopant, there is complete suppression of the intermediate phases and of the antiferroelectric phase. The extent of the SmC*α phase was determined using the current reversal method,24 and this increases in stability with increasing concentration of chiral dopant, completely suppressing the SmC* phase at concentrations above 8% w/w. The smectic layer spacing was determined using small angle X-ray scattering (SAXS) measurements carried out at the Synchrotron Radiation Source, Daresbury, and the transition from the SmA to SmC*α phase is the temperature at which there is an abrupt reduction in layer spacing associated with the change from the orthogonal (SmA) to tilted SmC*α structure.
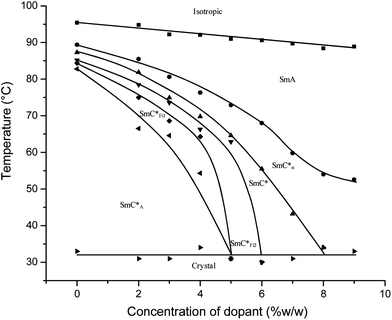 | ||
| Fig. 5 The phase diagram for the mixtures with respect to the concentration of chiral dopant S1011. Transition temperatures typically have a relative accuracy of ±0.2 K, though the absolute accuracy of temperature measurement using different apparatus is ±1 K. Consequently, measurements of physical parameters in later figures are given in terms of the reduced temperature, T − T0, where T0 is the transition from the orthogonal to tilted regime. The SmA–SmC*α transition was deduced from layer spacing measurements, the SmC*α–SmC* transition was taken from current reversal measurements.24 The remaining transitions were determined using polarizing microscopy. The lines are given as a guide to the eye. | ||
For the electro-optic measurements, the mixtures were contained in devices comprising glass substrates coated with transparent indium tin-oxide electrodes. A rubbed nylon alignment layer is included on each inner surface, to produce good, monodomain alignment. The glass substrates were separated by spacers, producing a gap of ∼20 μm. In all experiments, the temperature was controlled by a Linkam hot stage which has a temperature stability of ± 0.1 K.
There are two angles associated with the tilt of the director in smectic phases, the optical tilt angle and the steric tilt angle defined by the angles between the layer normal and the optic axis and the mass axis respectively. These angles differ as the optical tilt is concerned primarily with the highly polarisable rigid core of the molecules, while the flexible alkyl chains at each end of the molecules also contribute to the steric tilt.25 Both tilt angles were determined for each of the mixtures over the temperature range of the smectic phases. To measure the optical tilt, an alternating electric field with a square waveform is applied to a planar sample. On reversal of the field, the director (and hence the optic axis) rotates through twice the tilt angle, observed as positions of minimum transmission on a polarizing microscope. This method allows the optical tilt angle to be determined with an accuracy of ±0.5°. The steric tilt angle is deduced from measurements of the smectic layer spacing d; the results are corrected to compensate for the linear expansion of the layers as described in ref. 11 and the steric tilt angle is deduced using the relation cos![[thin space (1/6-em)]](https://www.rsc.org/images/entities/char_2009.gif) θ = d/dc where dc is the layer spacing at the transition from the SmA to SmC*α phase.
θ = d/dc where dc is the layer spacing at the transition from the SmA to SmC*α phase.
As already mentioned, the chiral tilted smectic phases of interest here are ferro-, ferri- or antiferro-electric and the temperature-dependent spontaneous polarization, Ps, can be determined using the current pulse method26 in which an alternating electric field with a triangular waveform is applied across the device. Upon reversal of the field the director rotates, resulting in a pulse of current, i, which is related to the spontaneous polarization by Ps = ∫idt/2A (where t is time and A is the electrode area). Measurements of the Ps are reported for large values of electric field, when the sample is in a field-induced SmC* state, to ensure saturation, as at lower fields only partial switching occurs. The spontaneous polarization measured is equal to Ps, defined as the spontaneous polarization for a single layer, because measurements are taken in the ferroelectric SmC* phase.
4. Field-independent results
The smectic layer spacing of the mixtures is shown in Fig. 6 as a function of reduced temperature (T − T0), where T0 is the SmA–SmC* or the SmA–SmC*α transition. The transition between the SmA and the tilted (SmC* or SmC*α) phases is characterised by a noticeable reduction in layer spacing. This transition is clear in mixtures of concentrations up to and including A6, however in mixtures A8 and A9 there is little layer contraction at the transition, a feature discussed in detail in ref. 24. The values of layer spacing at the transition from SmA to tilted phases are given in Table 1. Fig. 6 shows that as the dopant concentration increases, the layer spacing in the SmA phase increases.| Mixture | d c (Å) |
|---|---|
| A2 | 36.6 ± 0.2 |
| A3 | 36.5 ± 0.2 |
| A4 | 36.7 ± 0.2 |
| A5 | 36.8 ± 0.2 |
| A6 | 36.8 ± 0.2 |
| A7 | 36.8 ± 0.2 |
| A8 | 37.3 ± 0.2 |
| A9 | 37.1 ± 0.2 |
It has previously been suggested that such an increase in layer spacing indicates a weakening in interlayer pairing11 that can be linked to the destabilisation of the SmC*A phase. However, the reduction in interlayer pairing strength suggested in ref. 11 was thought not to explain fully the destabilisation of the intermediate phases. In the mixtures studied here, there again appears to be a clear relationship between the interlayer pairing strength and the suppression of the SmC*A and intermediate phases; there is a steady increase in spacing as the concentration increases, with a dramatic increase for concentrations greater than 7%. This non-linearity in the layer spacing with increasing concentration indicates that the increase in layer spacing is not simply a result of different molecular length of components, but associated with the destabilisation of the intermediate and SmC*A phases. This will be investigated quantitatively in Section 5 with measurements of the interlayer interaction constant derived from field-temperature phase diagrams. In mixture A8 the layer spacing is marginally higher than in A9, however at these concentrations the intermediate phases and SmC*A phase are completely suppressed, suggesting that at high chirality the interlayer interaction is reduced so much that it is no longer a dominant factor affecting the layer spacing. Similar results are observed in measurements of the steric tilt and spontaneous polarization.
The steric and optical tilt angles were measured for mixtures of varying dopant concentration, with the results displayed in Fig. 7. Both tilt angles decrease with increasing concentration, and the steric tilt angle is significantly smaller than the optical tilt angle for any mixture concentration. This implies that the core of the molecule is more tilted than the molecular chains; such observations are common for materials that exhibit intermediate and antiferroelectric phases. The importance of the conformational packing in stabilising the intermediate phases is clear from the tilt angle data. The maximum tilt angle ratios for mixtures A2, A3 and A4 take similar values (0.73, 0.72 and 0.76, respectively), see Fig. 8. A significant drop to around 0.64 occurs at 5% dopant concentration (mixture A5), mainly due to a change in steric tilt. The θs/θo ratio takes a comparable value (0.62) in mixture A6, due to a reduction in θo; it is between these two concentrations that the intermediate phases disappear completely. In other words, in addition to the relative orientation of the molecular cores and chains being an important factor in stabilising the intermediate phases, the orientation of each of them with respect to the smectic layer normal also seems to play a significant role. In the case of this family of mixtures it appears that at high concentrations of chiral dopant the tilt reduces to such a degree that the intermediate phases become unstable, an observation in agreement with theoretical predictions.12
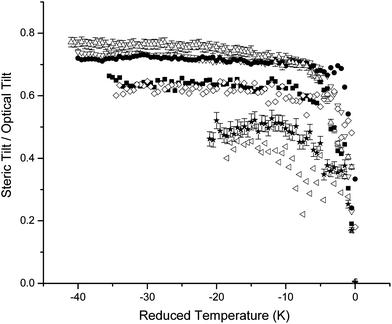 | ||
| Fig. 8 The ratio of the steric tilt angle to optical tilt angle as a function of reduced temperature for mixtures A2 to A9. | ||
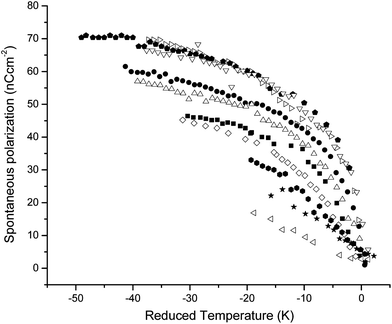
Fig. 9 shows the spontaneous polarization, Ps, as a function of temperature for the different mixtures. As the dopant concentration increases, Ps decreases from a maximum of ∼70 nC cm−2 (compound A) to a minimum of 17 nC cm−2 (compound A8), which is not surprising given the coupling between the tilt angle and Ps. The ratio of Ps to the sine of the optical tilt angle, shown in Fig. 10, gives a measure of the chiral interaction strength. There is a noticeable reduction in the chiral interaction strength occurring above 5% dopant concentration, a change that is associated with the suppression of the intermediate phases. Further, as the chiral interaction strength decreases, the SmC*α phase stabilises to the point where it replaces the SmC* phase in mixtures with >6% of chiral dopant, consistent with predictions made by Cepic et al.,13 Gorecka et al.27 and Cady et al.28 and observations made by Chang et al.24
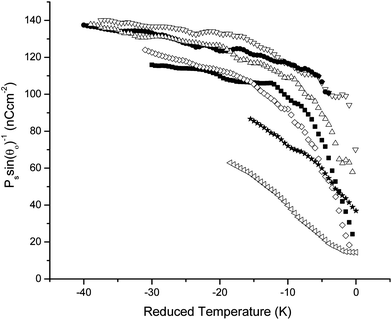 | ||
Fig. 10 The ratio of spontaneous polarization to sin![[thin space (1/6-em)]](https://www.rsc.org/images/entities/char_2009.gif) θo as a function of reduced temperature for mixtures A2 to A9. θo as a function of reduced temperature for mixtures A2 to A9. | ||
Summary of field-free data
The information that can be gleaned from the measurement of field-free parameters regarding the factors that influence the stability of the intermediate phases for this family of mixtures can be summarised as follows:• The layer spacing increases with increasing concentration of chiral dopant in the mixtures, suggesting a weakening of the interlayer interaction strength. The associated suppression of the SmC*A phase is consistent with findings in the related family of mixtures.11
• Although the intermediate phases initially widen upon adding small concentrations of chiral dopant (<6%), they destabilise rapidly at concentrations approaching this threshold and disappear completely for higher concentrations. The conformational packing arrangements associated with the mixtures are such that a marked reduction in the tilt angle occurs as the intermediate phases are lost (i.e., between mixtures A5 and A6). This reduction is particularly obvious from measurements of optical tilt, and the observation is consistent with the prediction that intermediate phases disappear in low-tilt regimes.12
• The strength of the chiral interaction reduces as the SmC*A is destabilised in favour of other SmC* sub-phases in mixtures up to 6%. However, in these mixtures, this reduction does not result in the stabilisation of an intermediate phase, as it did for the mixtures in ref. 11 but rather in a significant enhancement of the SmC*α phase.24
Clearly, while measurements of field-free parameters allow useful qualitative tests of theories, it is extremely desirable to make quantitative tests of the relevant parameters, including the layer interaction strength. The following section employs an analysis of the field-induced phase transitions to facilitate this.
5. Field-induced transitions
The field-temperature phase diagrams of interest are based around the SmC*Fi1 and the SmC*Fi2 phases, and therefore quantitative measurements of the layer interaction strength can only be made for mixtures in which these intermediate phases are stable, i.e. those containing ≤5% chiral dopant. Previous optical studies of the field-induced transitions14 relied on changes in the optical transmission of devices which, while indicating where the thresholds occur, do not offer sufficient information for a more robust quantitative evaluation of the transitions. Therefore, effective optical tilt angle measurements were made as a function of applied field across the temperature range of the intermediate phases for the pure material A and the mixtures in which the intermediate phases were measured to be most stable: A3, A4 and A5. The data for two selected temperatures in the mixture A4 are shown in Fig. 11.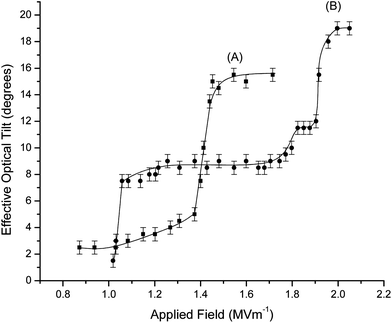 | ||
| Fig. 11 Effective optical tilt angle as a function of the electric field at reduced temperature (A) −12.4 K (■) and (B) −17.4 K (●) for mixture A4. Measurements of the effective optical tilt are accurate to ±0.5°. At electric field strengths close to zero the tilt angle is too small to measure and is assumed to be zero. (A: ■) refers to the higher temperature regime displayed in Fig. 2 in which there is a direct field-induced transition from the 4-layer to the ferroelectric structure. (B: ●) refers to the lower temperature regime where the three-layer intermediate phases are induced as the applied field is increased. The lines are given as a guide to the eye. | ||
Consider first the higher temperature regime, (A) of Fig. 11. At field strengths less than ∼0.8 MV m−1 the effective optical tilt angle is too small to measure, as would be expected for the non-polar four-layer SmC*Fi2 phase. However, for electric fields greater than ∼0.8 MV m−1 a very small value of effective optical tilt can be measured which increases gradually up to a maximum of 5°. Such behaviour is consistent with the description of Emelyanenko29 who reports second order transitions between helical and unwound phases at relatively low field strengths in the antiferroelectric subphases. The most significant change occurs at a field strength of ∼1.4 MV m−1 where a clear transition is observed, as indicated by the sudden large change in tilt. A change in texture is also observed at this point via polarizing microscopy. Referring to the schematic of the phase diagram in Fig. 2, this increase in effective tilt can be attributed to the transition between the four-layer SmC*Fi2 phase and the SmC* phase.
At lower temperatures, displayed as (B) in Fig. 11, there are two clear field-induced transitions at low (∼1.0 MV m−1) and high (∼2.0 MV m−1) fields. There is also a less obvious transition at medium field strengths (∼1.8 MV m−1), which is the transition from the SmC*Fi1 to SmC*Fi1_2 phase. In this last case, it can be seen that the change in the effective tilt angle is much smaller than that observed for the other transitions summarised in Fig. 2.
The field-induced phase transitions can thus be determined from plots of the optical tilt angle as a function of temperature. These data are summarised in Fig. 12 for the four materials considered. It is most convenient to plot the value of PsE where the transition is observed as a function of reduced temperature so that the data can be compared directly to the relevant equations summarised in Section 2. In each case, a straight line differentiating the different phase regimes is expected, with the gradient of the line defined by the layer interaction strength and the distortion angle, α, (eqn (5)–(8)).
 | ||
| Fig. 12 Phase diagrams for (a) A, (b) A3, (c) A4 and (d) A5. The typical error associated with the determination of PsE at each transition is 30 N m−2, and is shown as error bars in (a). Schematics of the structures corresponding to each of the intermediate phases observed are given. The straight-line fits to the equations describing the thresholds are shown; the numbers indicate the relevant equation given in Section 2. The field-free reduced temperature corresponding to the SmC*–SmC*Fi2 transition is marked by ★ on the axis of each graph. Note that an additional threshold, not predicted by eqn (5)–(8), can be seen in (b and c); the corresponding data have also been fitted by a straight line (dashed). | ||
The phase diagrams for the mixtures, Fig. 12, show that one field-induced transition occurs at high temperatures while three occur at lower temperatures. Data based on optical transmission experiments were reported previously14 for the mixture A3. Good qualitative agreement is found between the data sets, though we believe that direct measurement of the optical tilt as a function of field offers a more robust approach to deducing the phase transitions. The thresholds shown in Fig. 12 are effectively linear, in broad agreement with the eqn (5)–(8). However, considering these thresholds in detail allows an interesting insight into the physics of the phase transitions.
The SmC*Fi2–SmC* transition
We consider first the single phase transition that is observed at higher temperatures, indicated by (●) on the phase diagrams in Fig. 12. In our analysis, we associate this with the SmC*Fi2–SmC* transition. The threshold is linear with respect to temperature, in agreement with the SmC*Fi2–SmC* transition described by eqn (5) and it is possible to calculate the interlayer interaction constant, Δ0, from the value of the gradient. The values deduced are given in Table 2; clearly the value of Δ0 evaluated from this transition decreases significantly with increasing chiral dopant. The intercept of the fit to eqn (5) with the temperature axis, Tfit5, should coincide with the measured SmC*Fi2 to SmC* transition temperature,TFi2/C. In the pure material, A, the fit and measured temperatures are in excellent agreement, but in mixtures with larger concentrations of chiral dopant, Tfit5 deviates increasingly from TFi2/C, as can be seen in Table 2.| Mixture | Δ 0 (N m−2 K−1) | T fit5 − TFi2/C (K) | Error on Tfit5 (K) |
|---|---|---|---|
| A | 147 ± 13 | −0.2 | ±0.2 |
| A3 | 73 ± 9 | 5.4 | ±0.8 |
| A4 | 35 ± 10 | 13.2 | ±3.9 |
| A5 | 21 ± 4 | 18.3 | ±3.6 |
The SmC*Fi2–SmCFi1* transition
The threshold for the field-induced SmC*Fi2 to SmC*Fi1 transition is indicated by (▲) in Fig. 12 and represented by eqn (6). There appears to be a reasonable fit with theory only for the pure material. This threshold should again be linear and should have an equal and opposite gradient to the SmC*Fi2–SmC* threshold described by eqn (5). In pure material A, the gradient of this threshold is 128 ± 13 N m−2 K−1 which is comparable to the magnitude of the gradient of SmC*Fi2–SmC*, 147 ± 13 N m−2 K−1. Indeed, the deviation from this specific prediction is increasingly marked as the concentration of the chiral dopant is increased until, in mixture A5, the gradient of the threshold is around zero. It is important to note that eqn (5)–(8) as written include intercepts that represent phase transition temperatures (which are, in some cases virtual). In mixture A5 the SmC*Fi1 phase is unstable in the absence of a field and it appears that this factor dominates the field-temperature phase diagram particularly in Fig. 12(d); there is no intercept with the temperature axis. Indeed, the fact that the stability of the SmC*Fi2 phase increases at the expense of the SmC*Fi1 phase with increasing chirality in the mixtures appears to significantly affect this particular field-induced transition. An additional term may be needed in the description of the free energy in eqn (2) to account for the enhanced stability of the SmC*Fi2 phase over the SmC*Fi1 phase, which would influence this threshold far more than that described in eqn (5).The SmC*Fi1–SmCFi1_2* and SmC*Fi1_2–SmC* transitions
We next consider the thresholds between the 3-layer phases and the unwound SmC* phase (eqn (7) and (8)); these are by far the most complicated transitions observed. Previous studies identified the field-induced 3-layer phase, but a distinct additional transition is seen at intermediate temperatures in mixtures A3 and A4, indicated by the dashed lines. Indeed in A4, there is a complicated temperature region at reduced temperatures between −17 K and −20 K where there are four field-induced transitions, which will be discussed later. No such additional transition was observed in ref. 14.
Eqn (7) and (8) imply that the values of the distortion angle, α, at the SmC*Fi1 to SmC*Fi1_2 transition and at the SmC*Fi1_2 to SmC* transition can be calculated using values for the interlayer interaction strength (Δ0 in Table 1). For the transition between the two 3-layer phases we use eqn (7) (in which the gradient is −2Δ0![[thin space (1/6-em)]](https://www.rsc.org/images/entities/char_2009.gif) cos
cos![[thin space (1/6-em)]](https://www.rsc.org/images/entities/char_2009.gif) α) and at the transition between 3-layer phase and the SmC* phase we use eqn (8) (in which the gradient is −Δ0(cos
α) and at the transition between 3-layer phase and the SmC* phase we use eqn (8) (in which the gradient is −Δ0(cos![[thin space (1/6-em)]](https://www.rsc.org/images/entities/char_2009.gif) α + 2)). The values deduced are given in Table 3. The field-free distortion angle for mixtures A3 and A5 in the SmC*Fi1 phase has previously been measured to be 39° and 55° respectively using resonant X-ray scattering.8 As the field-free distortion angle is known to be relatively temperature insensitive, it is reasonable to assume it to be constant for a particular material throughout the SmC*Fi1 phase. Further, the experimentally measured thresholds (eqn (7) and (8)) are linear so it appears that the value of the distortion angle at the transition between the phases is a constant for a particular material. However, the values deduced for the distortion angle using this approach do not show any strong correlation with respect to chirality, though in all cases the angle is rather large. By minimising the free energy we would predict that at the SmC*Fi1–SmC*Fi1_2 transition the distortion angle is equal to 90° and decreases with an increasing electric field. With increasing chirality the measured values of the distortion angle at this transition are further from the predicted value of 90°. At the SmC*Fi1_2–SmC* transition it is predicted that the distortion angle should approach zero, however the measured values of the distortion angle at this transition are very large. It is likely that our equations are too simplistic to allow anything other than broad behaviour to be deduced from this parameter.
α + 2)). The values deduced are given in Table 3. The field-free distortion angle for mixtures A3 and A5 in the SmC*Fi1 phase has previously been measured to be 39° and 55° respectively using resonant X-ray scattering.8 As the field-free distortion angle is known to be relatively temperature insensitive, it is reasonable to assume it to be constant for a particular material throughout the SmC*Fi1 phase. Further, the experimentally measured thresholds (eqn (7) and (8)) are linear so it appears that the value of the distortion angle at the transition between the phases is a constant for a particular material. However, the values deduced for the distortion angle using this approach do not show any strong correlation with respect to chirality, though in all cases the angle is rather large. By minimising the free energy we would predict that at the SmC*Fi1–SmC*Fi1_2 transition the distortion angle is equal to 90° and decreases with an increasing electric field. With increasing chirality the measured values of the distortion angle at this transition are further from the predicted value of 90°. At the SmC*Fi1_2–SmC* transition it is predicted that the distortion angle should approach zero, however the measured values of the distortion angle at this transition are very large. It is likely that our equations are too simplistic to allow anything other than broad behaviour to be deduced from this parameter.
| Mixture | α Fi1/Fi1_2 (°) | α Fi1_2/C (°) |
|---|---|---|
| A | 52 | 113 |
| A3 | 61 | 146 |
| A4 | 34 | 92 |
| A5 | 31 | 95 |
Having considered the variation of α, we return to the more complicated field-induced transitions observed for mixtures A3 and A4, as displayed in Fig. 12(b) and (c) by the dashed threshold. The details of this dashed threshold can be summarised as follows:
• For mixtures A, A3 and A4 the effective optical tilt of the SmC*Fi1_2 phase is equal to 1/2 that of the SmC* phase, however in the region between the dashed threshold and the transition to the SmC* phase, the ratio of the optical tilt to that of the SmC* phase is 0.58 (this is the region between 1.8 and 1.9 MV m−1 for B in Fig. 11).
• In A3 there is a step change in the threshold within the 3-layer regime at a reduced temperature of −13 K. Theoretical fitting of eqn (5)–(8) (ref. 14) has shown how the threshold depends on the distortion angle. The discontinuous change observed experimentally could therefore be the result of an abrupt change in the distortion angle of the structure at T − T0 = −13 K, which would lead to a different gradient of the threshold;
• In A4, there are clearly four field-induced transitions in the reduced temperature interval between ∼−17 K and −20 K and the dashed threshold occurs above that associated with eqn (7) and below that for (8);
• The additional regime is not observed in the A material, however in the A5 mixture there is some evidence for its presence. The additional threshold is not indicated in Fig. 12(d) as it is very close to the threshold to the SmC* phase.
• The additional field-induced regime has a very narrow stability and the increase in the effective optical tilt angle at this transition is much smaller than for other transitions (see, for example, B in Fig. 11).
• The additional field-induced regime appears to be close to the triple point where the SmC*, SmC*Fi2 and SmC*Fi1 coexist.
Further studies are required to determine whether the dashed threshold is due to changes in distortion angle or whether there is a new field-induced phase present. We believe that the difference in effective optical tilt suggests that there is indeed a transition to another phase, the nature of which will be discussed in a future publication.
Summary of data deduced from field-temperature phase diagrams
The information that can be deduced from fits to the field-induced phase transitions for this family of mixtures can be summarised as follows:• The linear dependence of all of the transitions implies that it is reasonable to assume that the significant temperature-dependent phenomena depend on (T − T0);
• The simplest field-induced transition is the SmC*Fi2 to SmC* transition, and it appears that this follows the theoretical expectations most closely though the relationship between T0 and the transition to the SmC* phase in zero field becomes less good as the concentration of chiral dopant increases (Table 2);
• The interlayer interaction strength decreases dramatically as the concentration of the chiral dopant is increased, from values around 150 N m−2 K−1, tending towards much smaller values (∼20 N m−2 K−1) at concentrations of 5%;
• It appears that the higher the value of Δ0 (lower chiral dopant concentration), the closer the field-temperature phase diagram is to the expected form. This suggests that the approximations used in deducing the thresholds are reasonable when Δ0 is large, but that other terms (which could also be temperature dependent) become important as Δ0 reduces;
• Disappointingly, it appears that it is not possible to deduce quantitative information about the distortion angle in the ferrielectric phase from the thresholds, though qualitatively, one can say that the angle is large;
• There is an additional field-induced region which requires further study.
6. Conclusions
Comparing the qualitative information available from the field-free data with the quantitative information from the field-induced transitions offers a useful insight into the role the interlayer interaction strength plays in the stability of the antiferroelectric and ferrielectric phases. There is clear agreement between the quantitative measurements of the interlayer interaction strength and the qualitative conclusions deduced from the layer spacing, Fig. 6, where the increase in layer spacing with increasing chirality suggests a weakening in interlayer pairing. The interlayer interaction strength depends not only on chirality, but also the packing conformation of the molecules; measurements of the ratio of spontaneous polarization and tilt (Fig. 10) also suggest a weakening in interaction strength between layers with increasing chirality, with the ratio decreasing as the concentration of chiral dopant increases. However, the change in interlayer constant with increasing chirality is much greater than differences in tilt, polarization and layer-spacing for the same mixtures, suggesting that it is the interlayer pairing which has the greatest effect on the stabilisation of intermediate phases. We suggest the distortion angle is field dependent, and note that in the mixture A3 a discontinuous change with temperature could explain the dashed field threshold observed. However, it seems most likely that an additional phase transition occurs in some of the mixtures and we present initial evidence based on the effective optical tilt angle supporting this suggestion.References
- A. D. L. Chandani, E. Gorecka, Y. Ouchi, H. Takezoe and A. Fukuda, Jpn. J. Appl. Phys., 1989, 28, 1265–1268 CrossRef.
- T. Niori, T. Sekine, J. Watanabe, T. Fukuwara and H. Takezoe, J. Mater. Chem., 1996, 6, 1231–1233 RSC.
- R. B. Meyer, L. Liebert, L. Strzelecki and P. Keller, J. Phys. Lett., 1975, 36, 69–71 CrossRef.
- P. Mach, R. Pindak, A. Levelut, P. Barois, H. T. Nguyen, C. C. Huang and L. Furenlid, Phys. Rev. Lett., 1998, 81, 1015–1018 CrossRef CAS.
- A. Fukuda, Y. Takanishi, T. Isozake, K. Ishikawa and H. Takezoe, J. Mater. Chem., 1994, 4, 997–1016 RSC.
- P. Mach, R. Pindak, A. Levelut, P. Barois, H. T. Nguyen, H. Baltes, M. Hird, K. Toyne, A. Seed, J. W. Goodby, C. C. Huang and L. Furenlid, Phys. Rev. E: Stat. Phys., Plasmas, Fluids, Relat. Interdiscip. Top., 1999, 60, 6793–6802 CrossRef CAS.
- A. Cady, J. A. Pitney, R. Pindak, L. S. Martin, S. J. Watson, H. F. Gleeson, P. Cluzeau, P. Barois, A. Levelut, W. Caliebe, J. W. Goodby, M. Hird and C. C. Huang, Phys. Rev. E: Stat., Nonlinear, Soft Matter Phys., 2001, 64, 050702(R) CrossRef.
- N. W. Roberts, S. Jaradat, L. S. Hirst, M. S. Thurlow, Y. Wang, S. T. Wang, Z. Q. Liu, C. C. Huang, J. Bai, R. Pindak and H. F. Gleeson, Europhys. Lett., 2005, 72, 976–982 CrossRef CAS.
- N. W. Roberts, S. Jaradat, C. Southern, S. T. Wang, C. C. Huang, E. DiMasi, R. Pindak, H. F. Gleeson and P. D. Brimicombe, Eur. Phys. J. E, 2007, 23, 281–287 CrossRef PubMed.
- I. Musevic and M. Skarabot, Phys. Rev. E: Stat., Nonlinear, Soft Matter Phys., 2001, 64, 051706 CrossRef CAS.
- S. Jaradat, N. W. Roberts, Y. Wang, L. S. Hirst and H. F. Gleeson, J. Mater. Chem., 2006, 16, 3753–3761 RSC.
- A. V. Emelyanenko and M. Osipov, Phys. Rev. E: Stat., Nonlinear, Soft Matter Phys., 2003, 68, 051703 CrossRef CAS.
- M. Cepic and B. Zeks, Phys. Rev. Lett., 2001, 87, 085501 CrossRef CAS.
- H. F. Gleeson, S. Jaradat, A. Labeeb and M. Osipov, Ferroelectrics, 2012, 431, 40–47 CrossRef CAS.
- K. Hiraoka, Y. Takanishi, K. Skarp, H. Takezoe and A. Fukuda, Jpn. J. Appl. Phys., 1991, 30, 1819–1822 CrossRef.
- S. Jaradat, P. D. Brimicombe, C. Southern, S. D. Siemianowski, E. DiMasi, M. Osipov, R. Pindak and H. F. Gleeson, Phys. Rev. E: Stat., Nonlinear, Soft Matter Phys., 2008, 77, 010701 CrossRef CAS.
- S. Jaradat, P. D. Brimicombe, M. Osipov, R. Pindak and H. F. Gleeson, Appl. Phys. Lett., 2011, 98, 043501 CrossRef.
- M. Osipov and M. V. Gorkunov, Liq. Cryst., 2006, 33, 1133–1141 CrossRef CAS.
- A. V. Emelyanenko and M. A. Osipov, Ferroelectrics, 2004, 309, 13–25 CrossRef CAS.
- M. Cepic and B. Zeks, Mol. Cryst. Liq. Cryst., 1995, 263, 61–67 CrossRef.
- P. D. Brimicombe, N. W. Roberts, S. Jaradat, C. Southern, S. T. Wang, C. C. Huang, E. DiMasi, R. Pindak and H. F. Gleeson, Eur. Phys. J. E, 2007, 23, 281–287 CrossRef CAS PubMed.
- P. M. Johnson, D. A. Olson, S. Pankratz, T. Nguyen, J. Goodby, M. Hird and C. C. Huang, Phys. Rev. Lett., 2000, 84, 4870–4873 CrossRef CAS.
- J. P. Marcerou, H. T. Nguyen, N. Bitri, A. Gharbi, S. Essid and T. Soltani, Eur. Phys. J. E, 2007, 23, 319–328 CrossRef CAS PubMed.
- H. S. Chang, S. Jaradat, H. F. Gleeson, I. Dierking and M. A. Osipov, Phys. Rev. E: Stat., Nonlinear, Soft Matter Phys., 2009, 79, 061706 CrossRef.
- J. Mills and H. F. Gleeson, Mol. Cryst. Liq. Cryst., 1999, 330, 1693–1700 CAS.
- K. Miyasato, S. Abe, H. Takezoe, A. Fukuda and E. Kuze, Jpn. J. Appl. Phys., 1983, 22, L661–L663 CrossRef.
- E. Gorecka, D. Pociecha, M. Cepic, B. Zeks and R. Dabrowski, Phys. Rev. E: Stat., Nonlinear, Soft Matter Phys., 2002, 65, 061703 CrossRef CAS.
- A. Cady, Z. Q. Liu, X. F. Han, S. T. Wang, M. Veum, N. Janarthanan, C. S. Hsu, D. A. Olson and C. C. Huang, Phys. Rev. E: Stat., Nonlinear, Soft Matter Phys., 2002, 66, 061704 CrossRef CAS.
- A. V. Emelyanenko, Phys. Rev. E: Stat., Nonlinear, Soft Matter Phys., 2010, 82, 031710 CrossRef CAS.
| This journal is © The Royal Society of Chemistry 2014 |

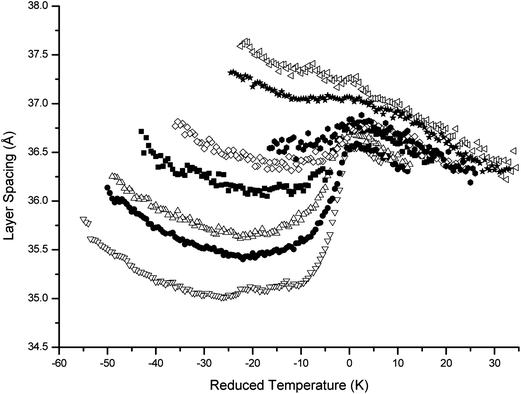
![[hexagon filled, point down]](https://www.rsc.org/images/entities/char_e124.gif) ), A8 (◁) and A9 (★). Data for the A and A1 mixtures are not included due to poor signal-to-noise ratio. Typical error is 0.4%.
), A8 (◁) and A9 (★). Data for the A and A1 mixtures are not included due to poor signal-to-noise ratio. Typical error is 0.4%.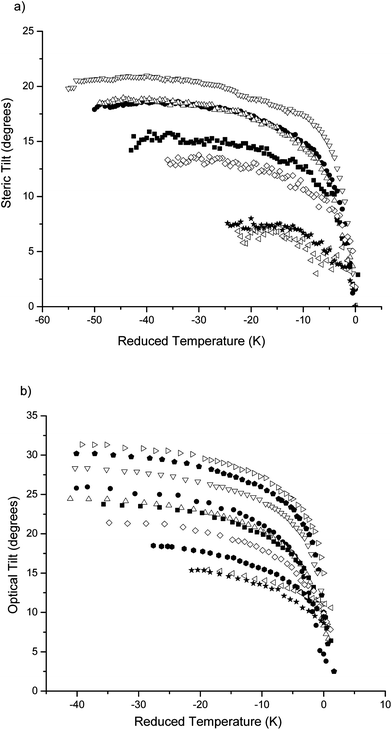
![[pentagon filled]](https://www.rsc.org/images/entities/char_e13d.gif) ). Typical errors in the steric and optical tilt angles are 0.6% and ±0.5° respectively.
). Typical errors in the steric and optical tilt angles are 0.6% and ±0.5° respectively.