Beneficial effects of stoichiometry and nanostructure for a LiBH4–MgH2 hydrogen storage system†
Jianjiang
Hu
*a,
Raiker
Witter
ab,
Huaiyu
Shao
c,
Michael
Felderhoff
c and
Maximilian
Fichtner
a
aInstitute of Nanotechnology, Karlsruhe Institute of Technology (KIT), P.O. Box 3640, D-76021 Karlsruhe, Germany. E-mail: jianjiang.hu@kit.edu; Fax: +49 721 6082 6368; Tel: +49 721 6082 8915
bTechnomedicum, Tallinn University of Technology, Ehitajate tee 5, 19086 Tallinn, Estonia
cMax-Planck-Institut für Kohlenforschung, Kaiser-Wilhelm-Platz 1, D-45470 Mülheim an der Ruhr, Germany
First published on 23rd October 2013
Abstract
The hydrogen storage system [MgH2–2LiBH4] shows attractive properties such as favorable thermodynamics, high hydrogen capacity and reversibility. However, there exists an incubation period that amounts up to 10 hours in the dehydrogenation steps, which restricts this system as a practical material. In this study, the influences of stoichiometry and the nanoscale MgH2 were investigated for the system. Considerably shortened incubation times were achieved with deficit amounts of LiBH4 or by using nanoscale MgH2. In addition, the application of nanoscale MgH2 prevented or suppressed the formation of [B12H12]2− in the dehydrogenation, which is otherwise an issue concerning the re-cyclability.
Introduction
Efficient storage of hydrogen as an energy carrier has been proved to be a bottleneck factor in the implementation of this clean energy in the past decades. Mobile application of hydrogen storage materials demands both high capacity and appropriate thermodynamics.1,2Borohydrides are a category of compounds that have high H contents. However, the chemical stability of B–H appears to be critical for the application as a hydrogen storage medium. While some metal borohydrides are very unstable and ready to decompose to extremely toxic diborane,3 others are so stable that they only release hydrogen at impractically high temperatures.4 For tuning of the thermodynamics there are currently two strategies. One is by forming borohydrides with mixed cations5 and the other is to form stabilized desorption products by alloying.6
Vajo et al. reported in 2004 an approach for destabilizing LiH and MgH2 by alloy formation during the dehydrogenation process.6 The temperature of 1 bar equilibrium pressure of H2 could be dramatically lowered in this way. The same research group extended this methodology to lithium borohydride and developed a hydrogen storage system based on solid state reactions (eqn (1)), which were later also investigated by other research groups.7–10 With a theoretical capacity of 11.4% and thermodynamics superior to each single component in the system, this material has met the DOE requirements in a few critical points and thus attracted widespread interest.
| MgH2 + 2LiBH4 → MgB2 + 2LiH + 4H2 | (1) |
Nevertheless, the capacities reported by different groups were much lower than the theoretical value.8,11 In addition, an incubation period longer than a dozen of hours was observed during the hydrogen desorption process, which degrades the applicability of the material.
While transition metal compounds as additives are effective to reduce the incubation time,11,12 the capacity is, however, lowered as well. To tackle the above-mentioned issues, we investigated the effects of the stoichiometry between MgH2 and LiBH4 in eqn (1) on the hydrogen desorption behavior. In addition, magnesium hydride synthesized via an organometallic approach13 that showed high reactivity as a single component was used for an enhanced kinetics.
Experimental
Sample preparation: LiBH4 (95%) and MgH2 (98%) from Alfa Aesar were stored in a glovebox under an Ar atmosphere and used as received. Nanostructured MgH2 (denoted as *MgH2) was synthesized via an organometallic method described in detail elsewhere.13 For the ball milling process, the starting chemicals were loaded into a milling vessel inside the glovebox at a certain ratio of MgH2 to LiBH4. Ball milling was performed using a Retsch PM 400 at 200 rpm and a ball to powder ratio of 80![[thin space (1/6-em)]](https://www.rsc.org/images/entities/char_2009.gif) :
:![[thin space (1/6-em)]](https://www.rsc.org/images/entities/char_2009.gif) 1 for 20 h.
1 for 20 h.
Fourier Transform Infrared Spectroscopy (FTIR) measurements were carried out using a Perkin Elmer Spectrum GX FT-IR system. The powdery samples were mixed with KBr and pressed into pellets and measured at a resolution of 4 cm−1.
Identification of crystal phases was performed by X-ray diffractometry (XRD) on a Philips X'PERT diffractometer (Cu Kα radiation). In order to protect samples against air, a sample holder consisting of a Kapton foil hood and a silicon single crystal base was used. Powdery samples were spread evenly onto the silicon crystal and then sealed with the Kapton foil hood inside the glovebox. The measurement was conducted in the 2θ range between 10° and 80° at a step length of 0.02°.
Differential Scanning Calorimetry (DSC) measurements were performed on a Netzsch DSC 204 HP housed inside a glovebox to detect heat effects accompanying hydrogen desorption. Samples were heated at 5 °C min−1 under 3 bar He or H2.
For the quantification of H desorption, a home-made Sieverts' system was used to measure the H2 amount evolved from the materials upon temperature elevation. The sample temperature was raised first at 5 °C min−1 to 400 °C and kept at this temperature for a certain period. To enable a thermodynamically permitted formation of MgB2,14 a hydrogen back pressure of 3 bar was applied during the dehydrogenation process.
A TG-DSC-MS (Sensys Evo, Setaram) was housed inside a glovebox with an Ar atmosphere. Approximately 5–8 milligram sample was loaded into the crucible of alumina. Measurement was carried out under He flow of 20 ml min−1 at a heating rate of 5 °C min−1.
A Bruker 600 MHz Avance system with a 4 mm MAS probe head was used for solid state 11B NMR experiments. Echo spectra were recorded at room temperature at a resonance frequency of 192.6 MHz, magic angle spinning speed of 12.5 kHz, and 90/180°-pulses of 2.5/5.0 μs and 6.5/12.0 μs. Na (11BH4) was used for referencing.
Results and discussion
Influence of stoichiometry on the dehydrogenation
The stoichiometry of the mixture [MgH2 + xLiBH4] was varied at x = 0.2, 0.6, 1.0 and 2.0. The results of thermal desorption experiments are shown in Fig. 1. Depending on the ball milling conditions, an incubation period in the range from 10 to 15 h was observed for the composition at x = 2.0 (MgH2 + 2LiBH4) by Bösenberg et al.10,11 An incubation period of more than 10 h for x = 2.0 between the desorption steps of MgH2 and LiBH4 was also observed in our experiments. A dramatic decrease in the incubation periods could be achieved at lower values of x or lower concentrations of LiBH4. At x = 0.2, the incubation almost disappeared. The total amount of desorbed hydrogen, however, decreased at lower x values.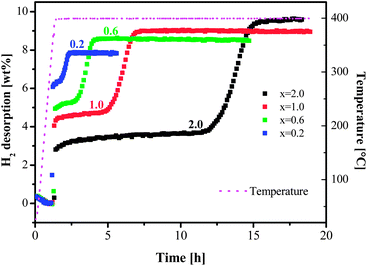 | ||
| Fig. 1 Dehydrogenation isotherms at 400 °C and 3 bar H2 for samples [MgH2 + xLiBH4] (x = 0.2, 0.6, 1.0 and 2.0). | ||
With varying compositions, the dehydrogenation reaction in eqn (1) can be rewritten as follows:
| MgH2 + xLiBH4 → x/2MgB2 + (1 − x/2)Mg + xLiH + (2 + 3x)/2H2 | (2) |
The theoretical dehydrogenation amounts were calculated using the above equation and listed in Table 1. Since the H content of LiBH4 is higher than that of MgH2, higher H release was expected for LiBH4-rich compositions, which was proved by the experimental results, i.e., more hydrogen could be released with increased LiBH4 content. The desorption yield, in contrast, decreased for LiBH4-rich compositions, indicating that dehydrogenation was more efficient at lower x.
| x | Mol. mass | H amount from MgH2 (%) | H wt% cal. | H wt% found | Desorption yield (%) |
|---|---|---|---|---|---|
| 0.2 | 30.7 | 6.51 | 8.47 | 7.9 | 93.3 |
| 0.6 | 39.5 | 5.06 | 9.62 | 8.6 | 89.4 |
| 1.0 | 48.3 | 4.14 | 10.35 | 9.0 | 87.0 |
| 2.0 | 70.3 | 2.84 | 11.38 | 9.6 | 84.4 |
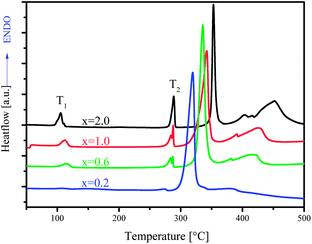
Shown in Fig. 2 are the DSC curves for samples with various x values. Typical thermal events were displayed at x = 2. The weak peak a little bit above 100 °C (T1) was attributed to the crystal structure transition of LiBH4, whereas the endothermic event just below 300 °C (T2) resulted from the melting of LiBH4. The strong endothermic peak next to T2 was attributed to the dehydrogenation of MgH2, followed by a broad peak arising from the decomposition of LiBH4.11,15 Therefore, the dehydrogenation of LiBH4 occurred after the melting of LiBH4 in the presence of a solid Mg phase, which means that the second dehydrogenation step took place heterogeneously. This phenomenon was observed using SEM/EDX analysis by Deprez et al. that the LiBH4 phase was highly dispersed and partially covering MgH2 particles.16
In a liquid–solid reaction, the specific area of the solid component is a determining factor for the kinetics. As we can see, the dehydrogenation peak of MgH2 shifted to the lower temperature with lower x, suggesting that MgH2 became more reactive or destabilized. Interestingly, the decomposition of LiBH4 (the broad peak) shifted concurrently to lower temperature. Since the newly formed Mg metal from the decomposition of MgH2 was immersed in the liquid state LiBH4, the Mg particles were covered by a liquid layer of LiBH4,16 and the coalescence of Mg particles was presumably hindered. As a consequence, reactivity of Mg metal could be preserved, which facilitated its reaction with LiBH4 to form MgB2. For Mg-rich compositions (lower x), the lowering of LiBH4 decomposition suggests a shortened incubation period, which is consistent with the observation by the Sieverts' method (Fig. 1). The reason for a shortened incubation may be twofold. First, in the Mg-rich samples, more Mg particles provide more reactive surface and consequently faster kinetics, given that freshly formed Mg metal particles from different compositions have similar particle size. Using the bulk densities of LiBH4 and MgH2 (0.67 and 1.45 g cm−3, respectively), the volume ratio of the two starting components varies from 3.65 to 0.365 for the x range from 2.0 to 0.2. If using the density of Mg (1.74 g cm−3) instead of MgH2, the ratio becomes 4.70 to 0.47. Although in reality this volume ratio might shift to a lower value due to the pulverization of MgH2, this simple calculation enables to envision the substantial change in the reaction conditions in terms of the relationship between liquid reactant LiBH4 and surface area of Mg metal. Secondly, with Mg-rich samples, ball milling efficiency increased, which can be inferred from the XRD results (ESI†). As a matter of fact, crystal grain sizes of MgH2 decreased with increased content of MgH2 in the composition, which is further in favor of faster kinetics in the dehydrogenation from the reaction between liquid LiBH4 and Mg.
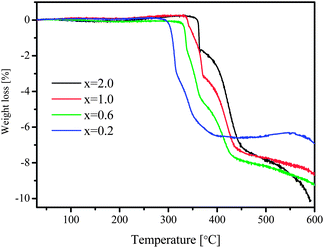
At temperatures above that of LiBH4 decomposition, several heat events were still detectable, indicating further reactions at higher temperatures, which are illustrated more clearly by TGA curves (Fig. 3). Weight loss proceeded stepwise and went up to the temperature limit of the instrument at 600 °C, which suggests that the dehydrogenation of LiBH4 is rather complex. For samples with lower x values, the weight loss took place at lower temperature as well. Similar to the Sieverts' results, however, none of the compositions led to a hydrogen amount close to the theoretical values by TGA measurements, which will be clarified by the results of XRD and solid-state 11B NMR in the following sections.
Investigations on this two-component system were dominantly performed at a 1![[thin space (1/6-em)]](https://www.rsc.org/images/entities/char_2009.gif) :
:![[thin space (1/6-em)]](https://www.rsc.org/images/entities/char_2009.gif) 2 molar ratio of MgH2 and LiBH4. Nevertheless, there have been a few studies dedicated to the stoichiometric effect on the dehydrogenation performance.17–19 Price et al. found diverse reaction pathways and kinetics under various molar ratios. The compositions equivalent to the x values between 0.11 and 2.0 were studied by Walker et al.19 They found a decrease in the peak temperature of LiBH4 decomposition, which agrees partially with our results. Nevertheless, no obvious change in the dehydrogenation temperature of MgH2 was observed. Although a three-step desorption was observed, the temperature for MgH2 decomposition and the onset temperature of weight loss during DTG-MS measurements were independent of the stoichiometry, which differs from our observation described above. Comparing the conditions for sample preparation, we noted that the milling duration and energy were much higher in our case than those used by Walker et al. The particle size of MgH2 induced by ball milling may not be significantly reduced under the applied conditions in ref. 19.
2 molar ratio of MgH2 and LiBH4. Nevertheless, there have been a few studies dedicated to the stoichiometric effect on the dehydrogenation performance.17–19 Price et al. found diverse reaction pathways and kinetics under various molar ratios. The compositions equivalent to the x values between 0.11 and 2.0 were studied by Walker et al.19 They found a decrease in the peak temperature of LiBH4 decomposition, which agrees partially with our results. Nevertheless, no obvious change in the dehydrogenation temperature of MgH2 was observed. Although a three-step desorption was observed, the temperature for MgH2 decomposition and the onset temperature of weight loss during DTG-MS measurements were independent of the stoichiometry, which differs from our observation described above. Comparing the conditions for sample preparation, we noted that the milling duration and energy were much higher in our case than those used by Walker et al. The particle size of MgH2 induced by ball milling may not be significantly reduced under the applied conditions in ref. 19.
Effect of nanoscale *MgH2 as a starting component
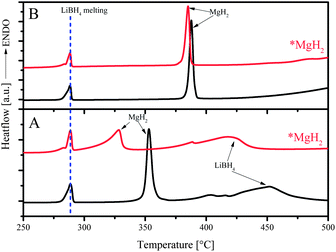
*MgH2 synthesized via an organometallic method exhibited much enhanced dehydrogenation. With a specific area of 108 m2 g−1, the dehydrogenated material absorbed hydrogen 40 times faster than its commercial counterpart.20 The effectiveness of *MgH2 in the MgH2–LiBH4 system was tested by replacing commercial MgH2 with nanostructured *MgH2 at x = 1.0 and 2.0.Shown in Fig. 4 are the DSC measurements for the compositions at x = 2 with commercial MgH2 and *MgH2, under the atmosphere of 3 bar He (Fig. 4A) and 3 bar H2 (Fig. 4B), respectively. As expected, neither atmosphere nor *MgH2 induced any effect on the melting of LiBH4 at about 290 °C, as indicated by the dotted blue line. However, dehydrogenation behaviors differed from each other under various atmospheres. Under a He atmosphere, the peak temperature of *MgH2 decomposition appeared at a lower position by 25 °C than that of commercial MgH2 (Fig. 4A), suggesting a higher reactivity of *MgH2 than that of commercial MgH2. Dehydrogenation of LiBH4 took place at lower temperature as well for the sample with *MgH2 than with commercial MgH2. Using H2 as the atmosphere, dehydrogenation reaction was suppressed, and the dehydrogenation shifted to higher temperature. Nevertheless, *MgH2 decomposed still at lower temperature than commercial MgH2 by about 5 °C, which could be an indication of improved thermodynamics for *MgH2, which was not identified by means of van't Hoff plot earlier by Shao et al.21
The effectiveness of *MgH2 is reflected clearly in the desorption isotherms shown in Fig. 5. Both *MgH2–containing samples showed faster dehydrogenation than the compositions using commercial MgH2. The incubation times were approximately halved compared to the respective samples with commercial MgH2.
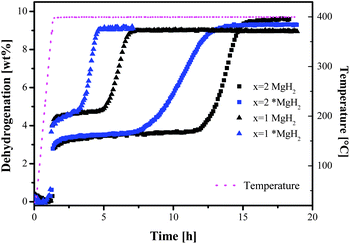 | ||
| Fig. 5 Dehydrogenation isotherms at 400 °C and 3 bar H2: square symbols for x = 2, triangle symbols for x = 1; black for commercial MgH2 and blue for nanoscale *MgH2. | ||
Zeng et al. prepared reactive MgH2 or MgD2 by doping with Nb2O5 for the MgH2–LiBH4 system.21 It was notable that an H–D exchange was observed in the MgD2–LiBH4 mixture below the melting point of LiBH4. In addition, MgH2 or MgD2 doped with Nb2O5 exhibited peak desorption temperatures which was over 100 °C lower than *MgH2 used in our study (ESI†). Nevertheless, the Nb2O5 doped components lost their dehydrogenation reactivity in the composites, in contrast to the effect of *MgH2 observed in this study, which means that the activation method for MgH2 is also of significance. With the organometallic synthesized MgH2, the material with nanoscale particle size has both high surface area and interfacial contact with other reactants, and therefore benefits enhanced reaction kinetics.8 For the Nb2O5 doped MgH2, however, the increased reactivity originates from the interaction between the oxygen atom of the oxide additive and the hydrogen atom of hydride,22,23 which may be weakened once in contact with a liquid phase, like LiBH4 in this case.
The Sieverts' measurements for the composition at x = 2 were interrupted at the 13th hour and XRD analysis was conducted (Fig. 6). For the sample with commercial MgH2, both starting chemicals and desorbed products were present after 13 h desorption. In contrast, only targeted desorption products of MgB2 and LiH were found in the sample comprising *MgH2, supporting the observation of an enhanced dehydrogenation with the reactive *MgH2. Obviously, nanoscale MgH2 played a significant role in enhancing the whole desorption kinetics.
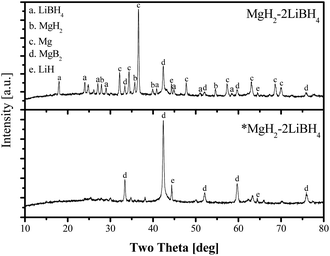 | ||
| Fig. 6 XRD patterns after 12 h dehydrogenation at 400 °C and 3 bar H2 for samples with commercial MgH2 and *MgH2 at x = 2, respectively. | ||
Formation of [B12H12]2− in the desorption products
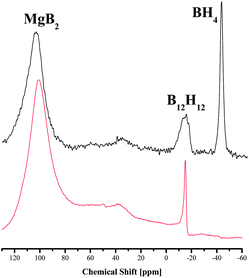
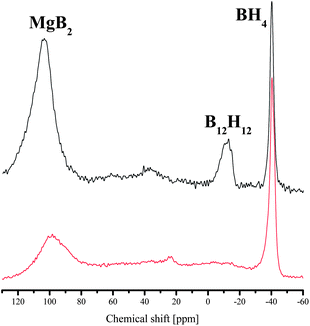
Metal borohydrides, LiBH4 and Mg(BH4)2 in particular, are viewed as promising compounds for hydrogen storage because of their high H contents in the molecules. However, closo-borane structures of [B12H12]2− were identified in the desorption products from compounds like LiBH4 or Mg(BH4)2, as well as from the mixture MgH2–2LiBH4. Due to the high stability, [B12H12]2− is recognized as a thermodynamic sink, which impairs the reversibility of hydrogen storage materials.24,25 Whereas Yan et al. observed the formation of the closo-borane structure via a gradual evolution starting from [BH4]−via [B2H6]2−, [B5H9]2− and [B5H8]− to [B12H12]2−,26 Hwang et al. found that the formation of a closo-borane structure was a universal pathway in the MgH2–2LiBH4 system, regardless of the kinds of additives added to the system.27In order to reveal the stoichiometric effect on the dehydrogenation reaction, the desorbed products of the samples with commercial MgH2 at x = 1.0 and 2.0 were analyzed by the solid state 11B NMR after isotherm desorption at 3 bar H2 and 400 °C for 20 h (Fig. 7). The resonance at 104 ppm appeared in both samples, indicating the formation of the targeted desorption product MgB2. In addition, the typical resonance at about −12 ppm suggests the presence of boron nuclei of [B12H12]2−. A big difference appears at −40 ppm, where the boron nuclei in the anions of tetrahydroboride [BH4]− was detected for x = 2.0 but absent for x = 1.0 after dehydrogenation. The consumption of the starting component LiBH4 was obviously not complete for x = 2.0, which resulted in the lower H yield for the LiBH4-rich samples in Table 1.
Substituting commercial MgH2 with *MgH2 at x = 2, it is interesting to note that no [B12H12]2− was found in the desorbed products from the sample prepared with highly reactive *MgH2, though unconsumed LiBH4 and target compound MgB2 still co-existed after 20 h desorption time (Fig. 8). Theoretical studies show that the formation of [B12H12]2− is thermodynamically favored in the metal borohydride systems during dehydrogenation.28 Pinkerton et al. found that a better reversibility could be achieved by applying a minimal H2 backpressure during the dehydrogenation process.14 They recognized that a suppressed decomposition of LiBH4 is crucial for reversibility. Yan found later on that even at a H2 pressure up to 10 bar,29 formation of Li2B12H12 still took place. This is obviously not the case in this study using *MgH2. The formation of thermodynamically stable species was effectively avoided or at least suppressed, which may hint a different reaction mechanism between the two components under kinetic control, which is worth further investigating. A report by Yu et al. revealed a new mechanism for the MgH2–LiBH4 composition that differs from the mechanism of MgB2 alloying.18 At temperatures higher than 440 °C, dehydrogenation under vacuum resulted in the formation of Li–Mg alloys, which could reversibly absorb H2 quantitatively. The reaction pathway with *MgH2 in this study seems different from the mechanism proposed in ref. 18.
Dehydrogenation sequence
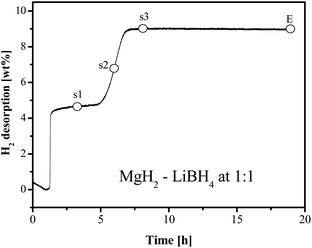
Typically, hydrogen desorption of the LiBH4–MgH2 system takes place in two steps, as is shown in Fig. 9 for x = 1.0. The first step concerning dehydrogenation of MgH2 is fast, followed by a sluggish hydrogen release step. In order to understand the chemical progression in the dehydrogenation process, sampling of MgH2–LiBH4 (x = 1) at three dehydrogenation stages was conducted for analyses using FTIR and XRD. At the respective points, heating was terminated, and at the same time, the hydrogen back pressure was released from the reactor. The first sample was chosen between the two major desorption steps (s1). The second point was in the middle of the 2nd desorption step (s2), followed by the third point at the virtual end of the 2nd desorption (s3), as indicated in Fig. 9.Attempts were made by Bösenberg et al. to investigate the reaction pathways by performing the dehydrogenation at various temperatures and H2 pressures.15 The results excluded a simultaneous decomposition of the two components and formation of LiH/MgB2.
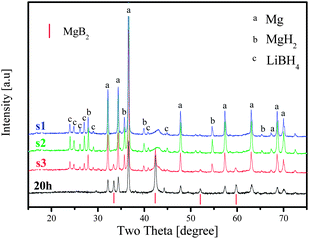
As shown above in this study, the system at x = 1 exhibited a faster desorption kinetics than that at x = 2. According to our XRD results (Fig. 10), Mg, MgH2 and LiBH4 were available in all the three samples s1, s2 and s3. However, a very limited amount of MgB2 could be detected as a target desorption product even at s3 in the stage 3, despite the fact that hydrogen release ceased substantially at this point. The unambiguous presence of MgB2 along with the disappearance of the LiBH4 phase was observed only afterwards under the isothermal conditions for a certain duration (20 h in this test), which agrees with the observation in ref. 16 and indicates that most MgB2 was formed after dehydrogenation of LiBH4. This means that the formation of MgB2 may simply be from the alloying between Mg and B metals, instead of via the reaction suggested in eqn (3) by Vajo et al.7
| LiBH4 + 1/2Mg → LiH + 1/2MgB2 + 3/2H2 | (3) |
Another interpretation might be that MgB2 was present at first in the amorphous state, crystallizing fairly slowly and thus undetectable by XRD.
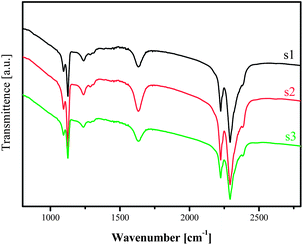
This finding is endorsed by the FTIR investigation on the same samples (Fig. 11). The absorbance originating from deformation vibration of H–B–H in the ranges of 1050–1150 cm−1 and the bridging B–H stretching in the range 2160–2460 cm−1, respectively, were detectable for all the 3 stages, indicating the availability of the [BH4]− moiety. At the end of the measurement, no bridging absorbance from B–H stretching vibration in the range 2160–2460 cm−1 was observed, which agrees with the NMR and XRD observations that [BH4]− was absent after desorption measurement.
Conclusions
Reduced content of LiBH4 in relation to [MgH2–2LiBH4] favored an enhanced dehydrogenation and increased the yield of H desorption. The introduction of nanostructured magnesium hydride *MgH2 in place of commercial MgH2 not only led to a faster kinetics, but also altered the reaction pathway of dehydrogenation.Acknowledgements
Financial supports by the German Ministry of Economy in the framework of the German-Chinese Stainable Fuel Partnership (grant # 03BV108A) and European project Fuel Cell Coupled Solid State Hydrogen Storage Tank (SSH2S) (grant agreement # 256653) are gratefully acknowledged.Notes and references
- L. Schlapbach and A. Züttel, Nature, 2001, 414, 353–358 CrossRef CAS PubMed.
- B. Bogdanovic and M. Schwickardi, J. Alloys Compd., 1997, 253–254, 1–9 CrossRef CAS.
- O. Friedrichs, A. Borgschulte, S. Kato, F. Buchter, R. Gremaud, A. Remhof and A. Züttel, Chem.–Eur. J., 2009, 15, 5531–5534 CrossRef CAS PubMed.
- W. Grochala and P. P. Edwards, Chem. Rev., 2004, 104, 1283–1316 CrossRef CAS PubMed.
- D. Ravnsbaek, Y. Filinchuk, Y. Cerenius, H. J. Jakobsen, F. Besenbacher, J. Skibsted and T. R. Jensen, Angew. Chem., Int. Ed., 2009, 48, 6659–6663 CrossRef CAS PubMed.
- J. J. Vajo, F. Mertens, C. C. Ahn, R. C. Bowman and B. Fultz, J. Phys. Chem. B, 2004, 108, 13977–13983 CrossRef CAS.
- J. J. Vajo, S. L. Skeith and F. Mertens, J. Phys. Chem. B, 2005, 109, 3719–3722 CrossRef CAS PubMed.
- J. J. Vajo, T. T. Salguero, A. F. Gross, S. L. Skeith and G. L. Olson, J. Alloys Compd., 2007, 446–447, 409–414 CrossRef CAS PubMed.
- M. Dornheim, S. Doppiu, G. Barkhordarian, U. Boesenberg, T. Klassen, O. Gutfleisch and R. Bormann, Scr. Mater., 2007, 56, 841–846 CrossRef CAS PubMed.
- U. Bösenberg, S. Doppiu, L. Mosegaard, G. Barkhordarian, N. Eigen, A. Borgschulte, T. Jensen, Y. Cerenius, O. Gutfleisch and T. Klassen, Acta Mater., 2007, 55, 3951–3958 CrossRef PubMed.
- U. Bösenberg, S. Doppiu, L. Mosegaard, G. Barkhordarian, N. Eigen, A. Borgschulte, T. R. Jensen, Y. Cerenius, O. Gutfleisch, T. Klassen, M. Dornheim and R. Bormann, Acta Mater., 2010, 58, 3381–3389 CrossRef PubMed.
- N. Boucharat, D. Wang, E. G. Bardají, M. Fichtner and W. Lohstroh, J. Phys. Chem. C, 2012, 116, 11877–11885 CAS.
- B. Bogdanovic, S. Liao, M. Schwickardi, P. Sikorsky and B. Spliethoff, Angew. Chem., Int. Ed. Engl., 1980, 19, 818–819 CrossRef.
- F. E. Pinkerton, M. S. Meyer, G. P. Meisner, M. P. Balogh and J. J. Vajo, J. Phys. Chem. C, 2007, 111, 12881–12885 CAS.
- U. Bosenberg, D. B. Ravnsbæk, H. Hagemann, V. D. Anna, C. B. Minella, C. Pistidda, W. Van Beek, T. R. Jensen and M. Dornheim, J. Phys. Chem. C, 2010, 114, 15212–15217 Search PubMed.
- E. Deprez, M. A. Muñoz-Márquez, M. C. Jimenez de Haro, F. J. Palomares, F. Soria, M. Dornheim, R. Bormann and A. Fernández, J. Appl. Phys., 2011, 109, 014913 CrossRef.
- T. E. C. Price, D. M. Grant, V. Legrand and G. S. Walker, Int. J. Hydrogen Energy, 2010, 35, 4154–4161 CrossRef CAS PubMed.
- X. B. Yu, D. M. Grant and G. S. Walker, Chem. Commun., 2006, 3906–3908 RSC.
- G. S. Walker, D. M. Grant, T. C. Price, X. Yu and V. Legrand, J. Power Sources, 2009, 194, 1128–1134 CrossRef CAS PubMed.
- H. Shao, M. Felderhoff, F. Schüth and C. Weidenthaler, Nanotechnology, 2011, 22, 235401 CrossRef CAS PubMed.
- L. Zeng, H. Miyaoka, T. Ichikawa and Y. Kojima, J. Phys. Chem. C, 2010, 114, 13132–13135 CAS.
- W. Oelerich, T. Klassen and R. Bormann, J. Alloys Compd., 2001, 315, 237–242 CrossRef CAS.
- W. Oelerich, T. Klassen and R. Bormann, Adv. Eng. Mater., 2001, 3, 487–490 CrossRef CAS.
- N. Ohba, K. Miwa, M. Aoki, T. Noritake, S. Towata and A. Züttel, Phys. Rev. B: Condens. Matter Mater. Phys., 2006, 74, 1–7 CrossRef.
- H.-W. Li, K. Miwa, N. Ohba, T. Fujita, T. Sato, Y. Yan, S. Towata, M. W. Chen and S. Orimo, Nanotechnology, 2009, 20, 204013 CrossRef PubMed.
- Y. Yan, H.-W. Li, H. Maekawa, M. Aoki, T. Noritake, M. Matsumoto, K. Miwa, S. Towata and S. Orimo, Mater. Trans., 2011, 52, 1443–1446 CrossRef CAS.
- S. Hwang, R. C. Bowman, J. J. W. Reiter, J. Rijssenbeek, G. L. Soloveichik, J. Zhao, H. Kabbour and C. C. Ahn, J. Phys. Chem. C, 2008, 112, 3164–3169 CAS.
- V. Ozolins, E. H. Majzoub and C. Wolverton, J. Am. Chem. Soc., 2009, 131, 230–237 CrossRef CAS PubMed.
- Y. Yan, H. Li, H. Maekawa, K. Miwa, S. Towata and S. Orimo, J. Phys. Chem. C, 2011, 115, 19419–19423 CAS.
Footnote |
| † Electronic supplementary information (ESI) available: DSC curves of nanoscale MgH2, XRD profiles of as-milled samples from x = 0.2–2.0. See DOI: 10.1039/c3ta13775a |
| This journal is © The Royal Society of Chemistry 2014 |

