 Open Access Article
 This Open Access Article is licensed under a
 Creative Commons Attribution 3.0 Unported Licence
Interfacial mechanisms in active emulsions
Stephan
Herminghaus
*a,
Corinna C.
Maass
a,
Carsten
Krüger
a,
Shashi
Thutupalli
b,
Lucas
Goehring
a and
Christian
Bahr
a
aMax-Planck Institute for Dynamics and Self-Organization, Göttingen, Germany. E-mail: stephan.herminghaus@ds.mpg.de; Fax: +49 551 5176 202
bPrinceton University, G02 E-Quad, Princeton, USA. E-mail: shashi@princeton.edu
First published on 30th May 2014
Abstract
Active emulsions, i.e., emulsions whose droplets perform self-propelled motion, are of tremendous interest for mimicking collective phenomena in biological populations such as phytoplankton and bacterial colonies, but also for experimentally studying rheology, pattern formation, and phase transitions in systems far from thermal equilibrium. For fuelling such systems, molecular processes involving the surfactants which stabilize the emulsions are a straightforward concept. We outline and compare two different types of reactions, one which chemically modifies the surfactant molecules, the other which transfers them into a different colloidal state. While in the first case symmetry breaking follows a standard linear instability, the second case turns out to be more complex. Depending on the dissolution pathway, there is either an intrinsically nonlinear instability, or no symmetry breaking at all (and hence no locomotion).
1 Introduction
1.1 Non-equilibrium collective behaviour
Large scale patterns emerging in crowds of interacting self-driven elements are known from a wide range of biological systems, like a school of fish, a host of sparrows, an army of ants, or a bacterial colony. The complexity of the active elements thereby varies considerably, and so do their mutual interactions. The latter can be of a purely physical nature, like hard core repulsion or hydrodynamic interaction, or genuinely biological, like olfactory and visual signals or chemotaxis, which are present in many microbial settings. Striking similarities in the swarming behavior of widely different types of active elements have spurred a significant recent increase in research activity towards understanding the basic mechanisms of pattern and texture formation in such systems. While theoretical work has been concentrating on active elements which were greatly simplified in their shape and interactions,1–10 most experiments so far have been performed with bacterial colonies.3,11–16 This is not only due to the particular importance of understanding the collective behavior of micro-organisms, but also because these are the only relatively simple active elements which can be obtained in sufficient number. Even a bacterium, however, is much more complex than the model elements used so far in theories and simulations. Consequently, it is not yet clear which aspects of their collective behavior are due to physical interactions, and which trace down to more complex biological signalling.The significance of understanding these processes has become increasingly important over the last decades. Along with the upsurge of concern about future climate and sustainability on our planet, it has been recognized that the ecology, transport, and biodiversity of pelagic phytoplankton plays a pivotal role in the transfer of energy into the biosphere. Long standing problems like the ‘paradox of the plankton’,17i.e., the unexplained large biodiversity of the marine phytoplankton, are thought to be intimately related to the observed inhomogeneous distribution of plankton species19,20 (cf.Fig. 1). Candidate mechanisms contributing to this phenomenon include the interplay between self-propelled motion of the organisms, buoyancy, and advection. Investigations thus need to take into account Langmuir circulation,21 flotation and buoyancy effects,22 gyrotaxis,23 impact of motility on the fluid rheology,1,24–26 turbulence-induced segregation effects,27,28 and circadian cycles of the phytoplankton species.29
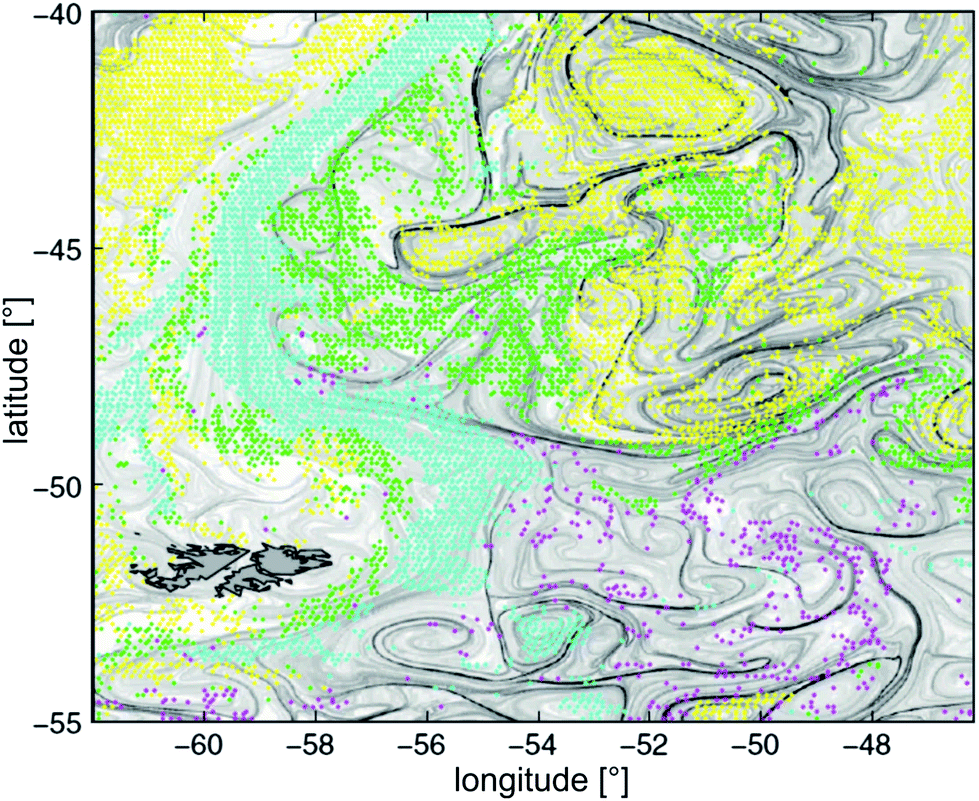 | ||
| Fig. 1 Dominant phytoplankton types observed during the spring bloom of November 2001 at the confluence of the Brazil and Malvinas currents. Yellow: Prochlorococcus, Synecococcus, and nano-eukaryotes. Green: diatoms. Magenta: Phaeocystis. Cyan: coccolithophorides. Overlaid grey levels represent the local Lyapunov exponents of the flow field, as derived from altimetry18 (reproduced with permission from the National Academy of Sciences of the USA. PHYSAT image taken at 9 km resolution. The dark grey structure to the lower left, with black outline, are the Falkland islands). | ||
It is clear that a detailed understanding of these processes is an enormous task involving many length and time scales. As ocean currents are characterized by high Reynolds numbers, the most demanding step is the understanding of turbulent advection and its interplay with the self-propelled motion of the plankton organisms.30,31 Large scale simulations of plankton transport in the oceans are considering only two-dimensional (2D) turbulence for the sake of numerical tractability. However, in order to investigate under which circumstances such approaches are justified, a detailed understanding of the 3D problem at smaller scales is indispensable. This must include the swarming behavior of the plankton in the turbulent flow as well as the back-action of the swarming plankton on the flow due to buoyancy.32 It will be extremely difficult to perform reliable computer simulations of these systems since the hydrodynamic interactions between active particles decay only algebraically away from individual swimmers. Hence there is no reliable cut-off criterion by which the range of mutual interactions can be limited, at least none which can be proven to leave all collective effects unchanged.
Consequently, it is of vital importance to come up with well-controlled model systems which allow the study of these effects experimentally, and which can be used as benchmarks for validating computer simulations. From a fundamental point of view, it would be generally desirable to perform experiments with artificial active elements the properties and interactions of which can be well controlled and adequately described by simple physical models. These might lead to novel ideas for overarching descriptions of collective behavior far from thermal equilibrium. Such attempts may be inspired by phase transition concepts,33 which are frequently used to describe transitions between different types of collective motion in swarming entities.34–40 Furthermore, it has been shown that the rheological properties of dense suspensions of actively moving objects are quite unusual and can differ pronouncedly from those of their ‘passive’ counterparts.1,24–26 We see that there is a plethora of interesting effects and novel concepts to explore. In the present paper, we will discuss design concepts for individual active particles which lend themselves to model experiments on the wide range of phenomena outlined above.
1.2 Active emulsions as model systems
For the design of suitable model systems, organisms such as cyano-bacteria, paramecium, and volvox are particularly inspiring. They belong to a class of swimmers referred to as squirmers, which are characterized by tangential motion of the cell surface5,41,42 driving their locomotion. Squirming is particularly appealing for studying the hydrodynamics of microscale swimming, since the velocities in the near and far field around such a swimming organism can be described analytically,6,43–45 and are similar to the flow fields around moving spherical objects. Such squirming organisms may thus possibly be modelled by self-propelling liquid droplets, which is what we pursue in the present paper.Before we go into the matter, let us outline what we should expect from a suitable model squirmer. There are three important requirements. First of all, there should be no interaction of individual squirmers with their ‘exhaust’ materials, neither their own or those of their interaction partners. Since every driving mechanism must be dissipative, it is clear that the medium is necessarily changed in some way during the locomotion. The impact of this change on the locomotion itself must be kept as small as possible, i.e., the locomotion velocity must be independent of the local concentration of any reaction products or other exhaust species. Second, the motion should be as long lived as possible, such that non-equilibrium steady states of collective behavior can be reached. Since the diameter of a single squirmer provides the only obvious inherent length scale of the system (there may be less obvious ones, which are discussed below), it suggests itself to consider as a figure of merit the total distance travelled by the squirmer until fuel runs out, divided by its diameter. This will be referred to below as the cruising range. Third, the droplet shape should remain spherical in order to avoid unnecessary complication of the system and the involved interactions. This is naturally taken care of by interfacial tension, if this is not too far reduced by surfactants.
A suspension of actively moving droplets in a second, immiscible fluid may be legitimately called an active emulsion. We mention here that we do not distinguish between emulsions and inverse emulsions, by not referring specifically to which phase is aqueous and which is not. All we require is that both liquid phases be sufficiently immiscible. In terms of the desired model character of the system, droplets (as opposed to solid particles, like colloids) are ideal in the sense that each one provides a reservoir for carrying some kind of ‘fuel’. Hence they do not rely on energy supply from external fields and thus have the potential of truly autonomous motion, thus resembling, e.g., self-propelling plankton species or motile bacteria. At the same time, interfacial tension keeps their shape close to spherical, and thus well defined.
This spatial symmetry, however, comes as well with the inherent drawback that there is no preferred direction along which locomotion should proceed. Hence we need a mechanism of spontaneous symmetry breaking in order to obtain actively motile droplets, and hence an active emulsion.46 In the present paper, we will discuss two examples of active emulsions which represent different routes to symmetry breaking. One proceeds by a linear dynamic instability, the other by a dynamic nucleation process originating from fluctuations.
2 Interfacial stress as a driving force
2.1 The Marangoni effect
A suitable driving mechanism for active droplets is the Marangoni effect. It can be presented easily by considering what happens if the excess free energy of an interface, i.e., the interfacial tension, γ, varies along this interface. Since γ has the dimension of energy per unit area, the gradient of γ, taken along the interface, has the dimension of a stress. If the media adjacent to the interface are viscous liquids, it is clear that this stress can only be compensated for by viscous stress in the liquids. Hence a lateral variation of interfacial tension is intimately connected to viscous shear flow in the adjacent media. This is called Marangoni flow, or the Marangoni effect, which induces a current at the interface in the direction of increasing interfacial tension. One of its most well-known occurrences is the thermo-capillary effect, where one exploits the temperature dependence of interfacial tension. By imposing suitable temperature gradients, gradients in γ can be induced by virtue of the temperature dependence of the latter, and liquids can be transported in a well-controlled manner.47 Perhaps the best known example of Marangoni flow is shown in Fig. 2. The different rates of evaporation of alcohol and water give rise to gradients in composition, and hence in surface tension. The resulting stresses are large enough to exceed gravity and shift some of the liquid several millimeters upwards along the glass surface.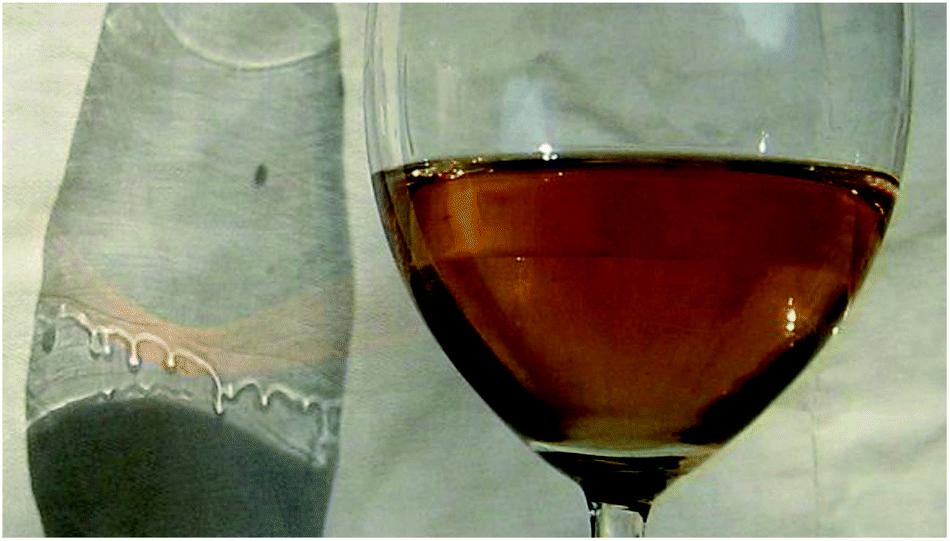 | ||
| Fig. 2 The so-called ‘tears of wine’, clearly visible in the shadow of the glass (left). They form as a result of gradients in the surface tension of the fluid, which in turn are due to variations in composition (i.e., alcohol concentration). The generated force is strong enough to easily overcome gravity.48 | ||
The reason why Marangoni effects are particularly promising for transport processes, in particular at small scales, becomes apparent if one considers the typical scales of the involved quantities. For interfaces between water and oil, for instance, interfacial tensions are on the order of several milli-newtons per meter, while viscosities are several milli-pascal seconds. Dividing both quantities with respect to each other yields the characteristic velocity of transport, the so-called capillary velocity, which is on the order of several meters per second. Hence for the required locomotion velocities of just a few microns per second, Marangoni effects might provide enough drive already at minute lateral variations in interfacial tension.
2.2 Flow fields near droplets
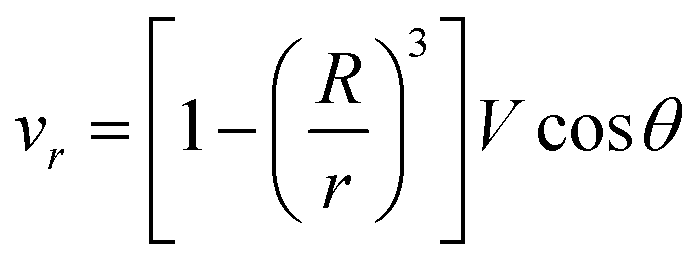
Let us now discuss the typical flow fields we expect to deal with. For a single spherical droplet of radius R moving at a velocity V with respect to an infinite bath of surrounding suspension, the velocity field is obtained as a solution to the Stokes equation with appropriate boundary conditions. In the rest frame of the droplet, it can be written as49 | (1) |
 | (2) |
 | (3) |
This represents a flow which has maximal velocity at the equator of the droplet and two stagnation points, one at each of its poles. The viscous drag force is given by49
 | (4) |
If the droplet of radius R moves with a velocity V, the rate of energy dissipation due to the flow along the surface is of order 2πRVΔγ, where Δγ is the total variation of interfacial tension along the surface. If we demand this to be equal to the dissipation from the viscous resistance, FviscVs = 5πRηsV2, we find
 | (5) |
In an emulsion, the interface will be laden with some surfactant, which is necessary to stabilize the emulsion against coalescence of droplets. This interfacial layer is in equilibrium with the number density of surfactant molecules dissolved in the surrounding liquid, as sketched in Fig. 3a. Its binding energy leads to a reduction of the interfacial tension, γ, of the droplet surface. It thus suggests itself to try to introduce a spatial variation of the interfacial tension (and thus Marangoni stresses) by controlling the distribution of surfactant along the droplet surface.
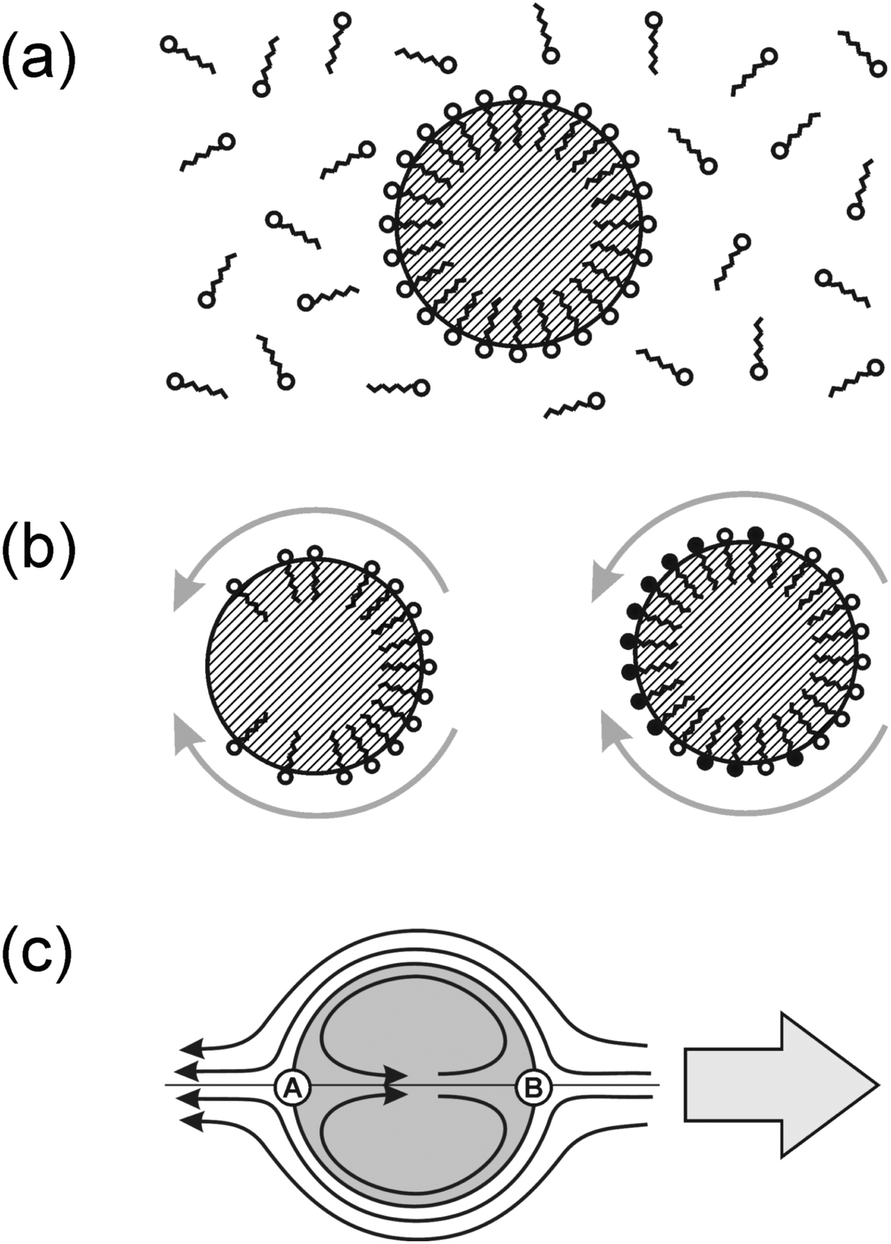 | ||
| Fig. 3 (a) The surfactant used to stabilize the emulsion adsorbs to the liquid interface, forming a mono-molecular layer of areal density c. This layer is in equilibrium with the surrounding surfactant concentration, ρs, and leads to a substantial reduction of the interfacial tension, γ. (b) Two ways of generating Marangoni stresses along the droplet surface. Left: the surfactant density has been made inhomogeneous. Right: the surfactant density is spatially constant, but a chemical reaction has reduced its surface activity (molecules labelled in black) in an inhomogeneous way. In both cases, the result is a Marangoni stress towards the region with higher surface tension (grey arrows). The induced motion of the droplets point into the opposite direction. (c) Flow pattern emerging in the situations sketched in (b). The large arrow to the right indicates the motion of the droplet with respect to the surrounding liquid. Of the two stagnation points A and B, only B is being supplied with fresh surfactant by advection. | ||
If the droplet moves solely as a consequence of such stresses, with no external force exerted upon it, the external flow field differs from eqn (1) and (2), which have been derived for spherical objects moving due to, e.g., a gravitational force. In order to obtain the correct flow profile, we subtract the external force solution which vanishes at the sphere surface and consider the simplest mode of tangential flow, prescribing u(θ) ∝ sin![[thin space (1/6-em)]](https://www.rsc.org/images/entities/char_2009.gif) θ as in eqn (3) as the boundary condition. This may be regarded as modelling, e.g., the action of cilia on the surface of a spherical microbe (squirmer). In this rather simple case, we find44
θ as in eqn (3) as the boundary condition. This may be regarded as modelling, e.g., the action of cilia on the surface of a spherical microbe (squirmer). In this rather simple case, we find44
 | (6) |
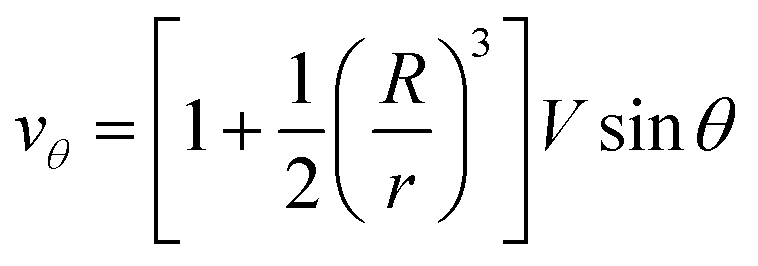 | (7) |
 | (8) |
As long as the areal density of surfactant molecules, c, is constant over the droplet surface, there will be no gradient in interfacial tension and thus no Marangoni stress. If, however, the droplet starts to move with respect to the surrounding liquid, the coverage will change according to
 | (9) |
As Fig. 3b indicates, there are mainly two distinct ways of using the surfactant layer for the generation of Marangoni stresses. Either one induces a gradient in the surfactant coverage (left), or a spatially inhomogeneous chemical reaction transforms the surfactant into some other surfactant with different efficiency (right). Combinations of both processes may as well be discussed, but we will restrict the present treatment to the two ‘pure’ cases sketched in Fig. 3b. The general scheme can be outlined as follows. Some non-equilibrium process is needed which consumes the (pristine) surfactant from the surface. The corresponding flow pattern, which arises due to Marangoni stresses and is sketched in Fig. 3c, advects fresh surfactant to the leading edge stagnation point (B) and its vicinity. This keeps the interfacial tension low, sustaining the Marangoni stress, and thereby the flow pattern. If this is achieved, the result closely models what is commonly called a squirmer: a body which procures a finite streaming velocity along its surface and thereby induces locomotion with respect to the surrounding fluid. Although this general scheme appears quite straightforward, we will see that real systems may exhibit substantial ramifications. In what follows, we demonstrate this by comparing two active emulsion systems, the first of which closely follows the outlined scheme, while the second one is more complex.
3 Schemes utilizing chemical reactions
3.1 Experimental realization
There have been numerous examples of chemical reaction schemes inducing droplet locomotion.51–53 They all have in common that they affect the surfactant and thereby the interfacial tension (right panel of Fig. 3b). In our experiments, we prepared aqueous droplets with typical diameters of few tens of microns in a continuous liquid phase consisting of squalane, with mono-olein (MO) as a surfactant.54 The surfactant concentration has been chosen well above the critical concentration for micelle formation (CMC) in order to reduce the ‘exhaust sensitivity’ of the system (see below). As a fuel, we added a formulation to the droplets which leads to a steady release of bromine (50 mM sulphuric acid, 28 mM sodium bromate, 400 mM malonic acid, and 2.7 mM ferroin). The bromine diffuses to the droplet surface and spontaneously reacts with the C![[double bond, length as m-dash]](https://www.rsc.org/images/entities/char_e001.gif) C double bond in the tail group of the MO, thus changing its properties as a surfactant.54,55 While the tension of the MO–laden interface between water and squalane is 1.3 mN m−1, it increases to about 3 mN m−1 for brominated MO (brMO).58
C double bond in the tail group of the MO, thus changing its properties as a surfactant.54,55 While the tension of the MO–laden interface between water and squalane is 1.3 mN m−1, it increases to about 3 mN m−1 for brominated MO (brMO).58
We observed that the aqueous droplets undergo spontaneous locomotion, with a speed on the order of a few microns per second which does not seem to depend systematically on the droplet size. It persists for several minutes while slowly decaying, and finally comes to rest. In order to determine the flow profile around a squirming drop, we added small fluorescent colloids to the suspension and performed particle image velocimetry (PIV) using a standard setup (ILA GmbH, Germany). The result as directly obtained in the laboratory frame is displayed in the left panel of Fig. 4. In the right panel, the proper motion of the droplet has been subtracted, such that the velocity profile in the frame of reference of the droplet becomes apparent. Qualitatively, we see that the flow profile indeed resembles a field as expected for the lowest order mode, as expressed in eqn (6) and (7).
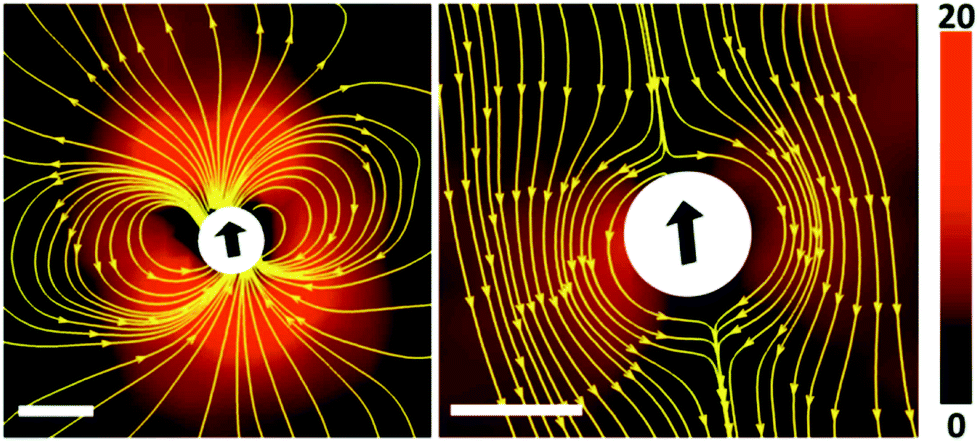 | ||
| Fig. 4 The velocity field around a squirmer droplet as measured by means of PIV (image taken with permission from ref. 58). The length of the scale bar is 100 microns, the magnitude of the velocity is color coded (cf. color scale to the right, in units of microns per second). Left panel: Velocity field in the laboratory frame of reference, as obtained by PIV. Right panel: Velocity field in the rest frame of the droplet. Yellow lines are stream lines of the flow. | ||
3.2 Properties of squirming droplets
Fig. 5 shows the dependence of the droplet velocity as a function of the MO concentration in the oil phase. Note that the critical micelle concentration (CMC) for MO in squalane is about 1 mM. Hence we are well in the range of a micellar solution, and the overwhelming majority of the surfactant is stored in micelles. After an initial increase, the velocity saturates at higher surfactant concentrations. At such high concentrations, it is likely that the process of disintegration of micelles near the droplet surface becomes the rate limiting step, which is independent of concentration and thus leads to a constant velocity.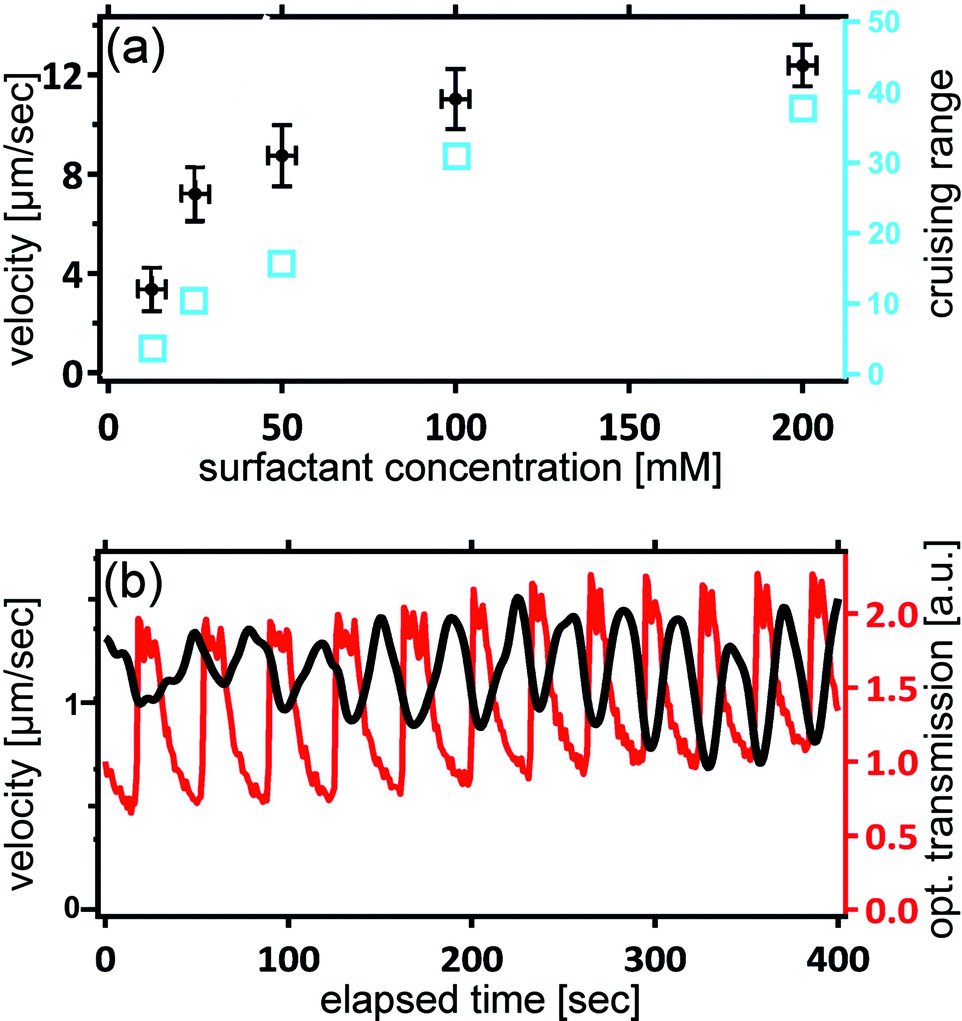 | ||
| Fig. 5 (a) Squirmer velocity as a function of surfactant concentration (black). Each point represents an average of 50 different squirmer droplets, each of diameter 80 microns. Superimposed in blue are the corresponding cruising ranges (total distance travelled, in units of the droplet diameter). (b) Traces of locomotion speed (black) and optical transmission (red) for droplets with Belouzhov–Zhabotinsky oscillations taking place in their interior. | ||
This latter property provides another key feature of our system which makes it particularly suited for experimental studies of collective motion. During an experiment, the concentration of brMO gradually builds up from the ‘exhaust’ of the many squirmers in a poorly controllable and spatially inhomogeneous fashion. Since the majority of the brMO becomes trapped in the MO micelles, its effect is mainly to reduce the effective concentration of MO in the oil. Fig. 5 tells us that by choosing a high surfactant concentration, where there is almost no sensitivity of the squirmer velocity on the surfactant density, we can also minimize the sensitivity of the velocity to the concentration of brMO, thereby minimizing any unwanted cross talk between the squirmers.
While the velocity does not depend noticeably on the surfactant concentration if this is large enough, it should depend strongly on the supply of bromine. That this is indeed the case can be demonstrated by means of a simple modification of the experiment. The reader may have recognized that the formulation added to the aqueous droplets is very similar to the Belouzhov–Zhabotinsky-solution, which is capable of exhibiting oscillatory behavior.56,57 We can indeed introduce such oscillations by properly adjusting the relative concentrations of the constituents. The iron ions from the ferroin provide a means for assessing the oscillations optically, since they strongly affect the optical transmission of the droplets. Fig. 5b shows traces of the optical transmission superimposed to the velocity of a single droplet. We clearly see that the velocity changes in registry with the chemical oscillations, demonstrating the close connection between the bromine release rate and the locomotion velocity.
3.3 Mechanism of locomotion
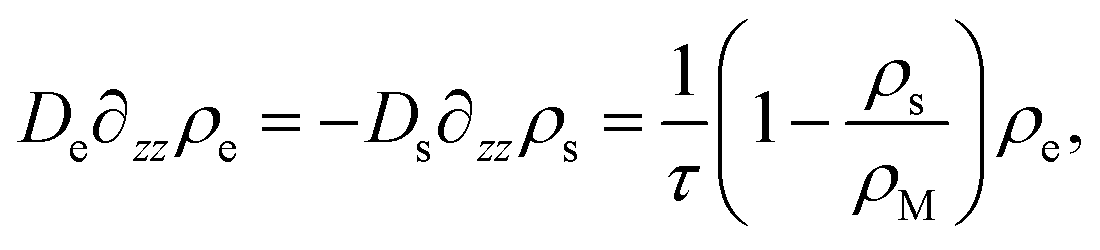
In order to discuss the basic mechanism responsible for the observed droplet locomotion, we follow a line of argument put forward earlier54 which has meanwhile been shown to be rather universal.45 The total coverage, c, of the droplet surface with the MO, either brominated or not, is assumed to be roughly constant and in equilibrium with the micellar phase in the oil. The brominated fractional coverage shall be called b. If the droplet makes a movement due to, say, a thermal fluctuation, such movement will be accompanied by some tangential velocity field u(θ, ϕ) with non-vanishing divergence, ∇u ≠ 0. Since the integral of the divergence must vanish by virtue of Gauss' law, there will be regions of positive and regions of negative divergence. Let us consider a region with positive divergence. The layer of adsorbed surfactant will be diluted here, and thus be replenished from the surrounding suspension. As this provides predominantly fresh surfactant, it is clear that the bromination density will decrease in regions with positive ∇u. Consequently, there will be a Marangoni stress pointing away from this region, thus tending to further enhance the divergent flow. We see that this situation leads to a linear instability, which we will briefly discuss in what follows.Let us consider, in the rest frame of the droplet, an axisymmetric flow field, u(θ), along the droplet surface. The equation of motion for b is
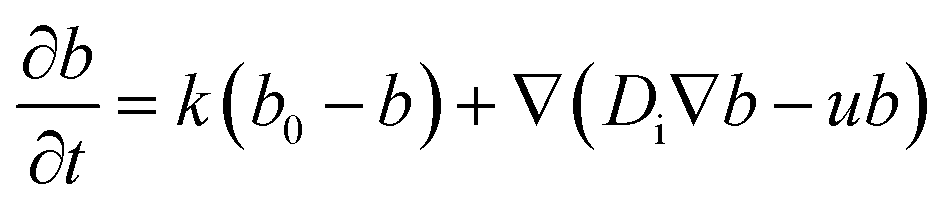 | (10) |
The droplet motion and the surface flow, u(θ), are accompanied by a flow pattern within the droplet as well as in the neighboring oil, which can be calculated analytically once u(θ) is known.50,59 The corresponding viscous tangential stress exerted on the drop surface must be balanced by the Marangoni stress, ∇γ(θ) = M∇b(θ), where
| M = dγ/db | (11) |
 | (12) |
 | (13) |
 | (14) |
It is of interest which of the spherical harmonics becomes unstable first when b0 is gradually increased. Instability occurs when the expression in brackets in eqn (14) becomes positive. It is straightforward to see that for sufficiently small kR2/Di, this happens first for the lowest mode at m = 1. As k becomes larger, the system is ‘stiffer’ concerning its propensity to keep the coverage close to its equilibrium value, b0. The driving term must then be increased, and one may anticipate that this favors the development of higher order modes. If we ask at which value of kR2/Di the m-th and the (m + 1)-st mode become unstable at the same drive, we find that the result is simply m(m + 2). In other words, for given rate and diffusion constants, we find that the largest mode index m obeying
 | (15) |
The nonlinear term ub in the equation of motion for b(θ), eqn (10), shows that the linear stability analysis we have pursued so far is not expected to reveal a complete picture of the process. After some finite time the bromination profile across the droplet surface will not be anymore determined by the fastest growing mode as suggested by eqn (14). Instead, it will acquire a complex shape which has recently been evaluated by means of computer simulation.60 It was found that the steady state is indeed characterized by contributions from several spherical harmonics. The most important ones are the two lowest order modes, i.e., the coefficients b1 and b2. They largely determine the behavior of the squirmer, in particular as far as its hydrodynamic interaction with other squirmers is concerned. For sgn(b2) = sgn(b1) the droplet behaves as a ‘puller’, the flow field of which is reminiscent of swimmers like Chlamydomonas reinhardtii. For sgn(b2) ≠ sgn(b1), however, it rather behaves as a ‘pusher’, similar to Escherichia coli. At high driving, bifurcations to autonomous oscillations are found, which lead to periodic switching between pusher and puller behavior.60
In most cases, the leading b1-term dominates the flow strongly enough that the flow fields as determined by PIV look qualitatively similar. However, the corresponding behavior of the swimmer can differ substantially. Hence we see that this system exhibits a quite rich behavior, which has by far not been explored or exploited yet. It can be controlled by adjustment of a few parameters, which makes it well suitable for forthcoming experiments, e.g., on collective behavior of squirmer-type swimmers.
3.4 Fingerprints of non-equilibrium
Aside from the self-sustained motion of our active droplets, there is some fluctuation in the direction, resulting in locomotion paths resembling persistent random walks.54 It is important to show clear evidence that this random motion is fundamentally different from brownian thermal motion, which would never be able to lead to collective behavior different from what is well-known for equilibrium fluids. A straightforward demonstration of non-equilibrium is shown in Fig. 6. A micro-fluidic device has been set up consisting of a chamber which is divided into two compartments by a geometrically asymmetric dividing wall with a few openings. The wall has the shape of arrow-head wall pieces with some space in between, as shown in Fig. 6. The width of the walls is approximately 100 microns. Initially, the density of droplets is equal in both the upper and the lower compartment, as shown in the top figure.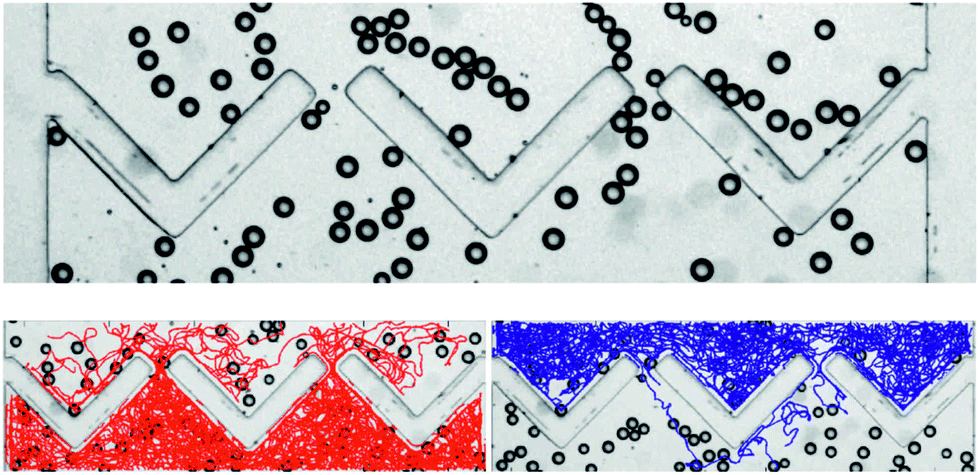 | ||
| Fig. 6 Geometry-driven rectification as a fingerprint of non-equilibrium. Top: the active droplets are deposited in a micro-fluidic chamber which is divided into two compartments by a geometrically asymmetric divide. If the droplet motion were thermal, there would be no net flux between the lower and top compartment. Bottom: to each particle its trajectory is attached; red trajectories go from the lower to the upper compartment (left), blue trajectories go from the upper to the lower compartment (right). | ||
If the motion of the droplets were identical to a random thermal motion, there would be no net flux between the two compartments, by virtue of detailed balance. In the bottom figure, the trajectories of all particles, taken during ten minutes, are overlaid, those of particles starting in the lower compartment in red (left), and those of particles starting in the upper compartment in blue (right). Clearly, there are many more droplets moving from the lower to the upper compartment than vice versa. This effect of geometrically driven rectification clearly shows the strongly non-equilibrium character of this system.
4 Schemes utilizing phase transformations
An obvious drawback of the system discussed above is that due to the fuel being supplied from inside the droplets, the cruising range in necessarily quite limited. Unless the concentration of chemicals in the droplets can be raised dramatically, the fuel supply scales as the third power of the droplet size. Since the dimensionless cruising range (as the figure of merit of the system) is defined as the maximum travel distance divided by the droplet size, it scales as the square of the droplet size. Hence it is naturally limited for systems of small droplets, which are desirable for maximizing droplet number and minimizing influences from, e.g., gravity. We therefore discuss now a different scheme which derives its power supply from the suspension outside the droplet. At the same time, it is interesting from a fundamental point of view since the symmetry breaking process does not proceed through a linear instability here.4.1 Experimental realization
It is well known that droplets of oil may undergo self-sustained locomotion or shape transformations when placed in a solution of a suitable surfactant.61 In our experiments, we used 4-pentyl-4′-cyano-biphenyl (5CB) as the oil and tetradecyl-trimethyl-ammonium bromide (TTAB) as the surfactant. The liquid crystal (LC) character of 5CB will prove very useful for the visibilization of the velocity field. If the surfactant concentration is well above the CMC, the stable phase is a micro-emulsion consisting of micelles in each of which there is a small amount of LC (swollen micelles). This can be confirmed by neutron scattering (cf.Fig. 7a), which shows that the micelles filled with LC are just a little larger than the empty micelles. The overall structure of the fluid (i.e., suspended micelles) is not changed.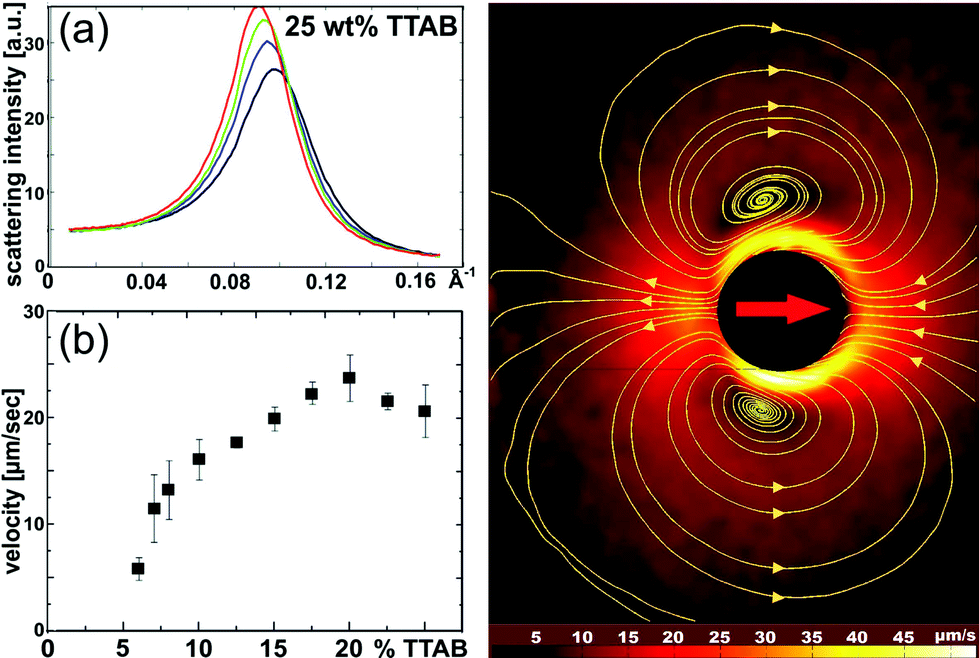 | ||
| Fig. 7 Squirming LC droplet in a surfactant (TTAB) solution. (a) Neutron scattering data show a pronounced peak corresponding to the structure factor of micelles. The addition of LC leads to swelling and a slight deformation of micelles, but no qualitative phase change. Black, blue, green, and red curves correspond to 0, 1, 2, and 3 weight percent of 5CB, respectively. (b) Locomotion velocity sets in at a TTAB concentration of several weight percent, well above the CMC. It levels off at high TTAB concentrations. (c) Velocity field around an LC squirmer (in laboratory frame) as revealed by PIV. The yellow lines are stream lines of the flow. | ||
It is observed that the dissolution process, by which the LC drop gradually shrinks until it vanishes completely in the solution, is accompanied by spontaneous locomotion of this drop. Typical shrinking rates are about 0.1 μm s−1 (ref. 62) and rather independent of droplet size. Since the typical speed is of order 10 μm s−1 as before, the cruising range of this system is of the order of one hundred.
Fig. 7b shows the locomotion velocity of 50 micron diameter droplets as a function of the TTAB concentration. Again, we find an initial increase which at higher concentrations levels off, thus providing a regime with potentially vanishing dependence on exhaust concentration. Below a concentration of 5 weight percent, no locomotion is observed. This is still well above the CMC. Fig. 7c shows that the velocity field around the droplet, as revealed by PIV again, is qualitatively very similar to what was observed with the chemically driven squirmers (cf.Fig. 4a; yellow lines are again the stream lines of the flow).
The fact that 5CB is in the nematic state at room temperature can be exploited to study the velocity field inside the droplets at least qualitatively. The interplay between the director field and the velocity field tends to align their axes of symmetry with respect to each other.63,64 It is interesting to follow the ‘impact’ of two moving droplets with an optical microscope under crossed polarizers, as shown in Fig. 8. Initially, the droplets move towards each other, and the point defect associated with the director field can be discerned in each droplet at its edge, pointed towards the other droplet (i.e., at its leading edge of motion). As the droplets come close to each other, they stop and turn their director fields slowly around, turning around a horizontal axis perpendicular to the microfluidic channel they are confined to. After this process they withdraw from the region of impact, and the point defects can be seen again at the respective leading edges of motion.
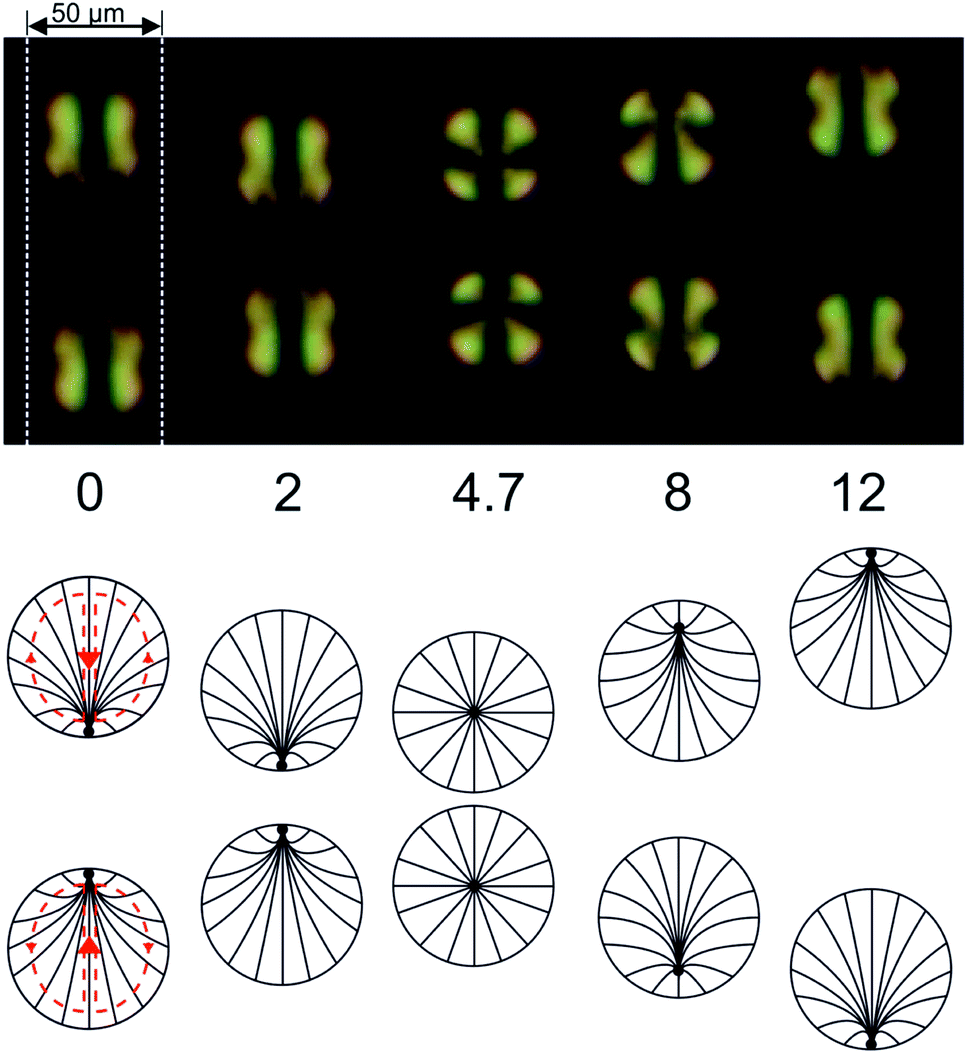 | ||
| Fig. 8 Optical micrograph of a pair of LC (5CB) squirmer droplets approaching each other in a microfluidic channel (indicated by the white dashed lines), taken under crossed polarizers. The numbers at the bottom indicate the elapsed time in seconds. The director field aligns with the velocity field, such that the latter can be directly observed. In the vicinity of the ‘impact’ at t = 4.7 s, the velocity field gradually turns around in both droplets. Before the impact, the point defects which can be discerned at the droplet perimeters are facing each other. After the impact, they point into opposing directions. | ||
In ensembles of many droplets, their hydrodynamic interaction gives rise to a wealth of collective phenomena. As Fig. 9 shows, they tend to arrange into crystalline rafts (left panel), which may take off against buoyancy into the third dimension (right panel). This appears to be due to the convective currents induced by the superposition of individual flow fields of the squirmers, but this needs further confirmation. What we want to stress here is that the quasi-planar arrangement of the raft tends to remain intact even after losing contact with the container bottom.
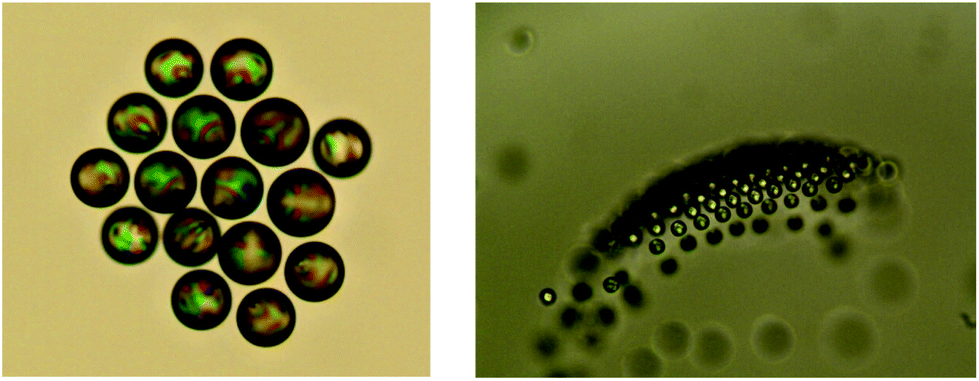 | ||
| Fig. 9 Snapshots of collective motion of squirming LC droplets. In the right panel, part of the raft has moved out of focus, which shows that it propagates in three dimensions as an integral structure. Such dynamic crystalline rafts seem to be more stable when the droplets are in the nematic state. According to our observations, the back-action of the nematic director field onto the flow pattern is sufficient to affect the hydrodynamic interaction, and thereby the collective behavior. The droplet size is approximately 50 microns. | ||
It is interesting to note that the state of the LC constituting the droplet considerably affects this behavior. If the sample is heated above the nematic–isotropic phase transition temperature, the tendency to form crystalline rafts is strongly reduced and the rafts start to disintegrate.
4.2 Mechanism of locomotion
Let us now elaborate possible mechanisms which may be at the basis of this locomotion. Since there is now only one type of surfactant involved, the only possible source of Marangoni stresses is a lateral variation of surface coverage with surfactant molecules. If the surrounding suspension contains the surfactant at concentrations exceeding the CMC, as is the case in our experiments, such variations are expected to be rather small. In order to gain some insight into the magnitude of effects we should expect, we start with a consideration of the surfactant concentration profiles normal to the droplet surface. Subsequently, we will discuss how these profiles may be affected by advection, and how a self-sustained lateral gradient in surfactant density (and hence surface tension) may arise.The fluid outside the LC drop consists of water, surfactant, and possibly some dissolved LC molecules. If there are empty surfactant micelles (i.e., containing no LC), whose number density shall be called ne, the number density of the free surfactant molecules, ρs, is equal to the CMC in equilibrium. If for some reason ρs falls below the CMC in some region, micelles will disassociate until ρs is replenished to the CMC again. There may be also micelles filled with LC (swollen micelles), the number density of which we call nf. Because of the presence of the internal interface between the surfactant and the LC inside these micelles, there is no such direct exchange equilibrium with the free surfactant phase: in order to have surfactant molecules be dissolved from the filled micelles, ρs would have to drop quite substantially below the CMC.
This is in line with the fact that already well below the CMC there is an almost complete monolayer of surfactant molecules at the interface between the LC drop and the aqueous phase. This was shown experimentally65 for a quite similar system, namely the interface between 8CB (4-octyl-4′-cyanobiphenyl) and water with CTAB (hexadecyltrimethylammonium bromide) as surfactant. The CMC of CTAB in water is about 1 mM, but already at CTAB concentrations around 0.001 mM, the anchoring of the LC at the LC/water interface is strongly affected, which suggests that a large fraction of the interface is already covered with CTAB molecules. Above about 0.05 mM, no change in anchoring strength is anymore observed. These findings underpin the strong affinity of the surfactant to the LC/water interface, and suggest that the surfactant density which would be in equilibrium with LC-filled micelles is far below the CMC, due to the internal LC interface present in the filled micelles. It is to be expected that this is qualitatively the case as well in all similar systems.
In what follows, we will consider the densities of surfactant molecules either free in solution (ρs), bound in empty micelles (ρe), or bound in LC-filled micelles (ρf). These can be expressed using the average number of surfactant molecules in an empty micelle, Ne, and the average number of surfactant molecules in an LC-filled (swollen) micelle, Nf. The number densities of surfactant molecules bound in micelles are then ρe = Nene and ρf = Nfnf, respectively.
There are mainly two mechanisms to be considered for solubilization into a micellar phase,66–70 which are sketched in Fig. 10. Either the micelles are filled directly at the droplet interface, via a local process in which the micelle and the interface interact. This is called the micellar pathway. Or the solute is present in some small concentration in the bulk aqueous phase, and enters the micelles from there. This is called the molecular pathway.
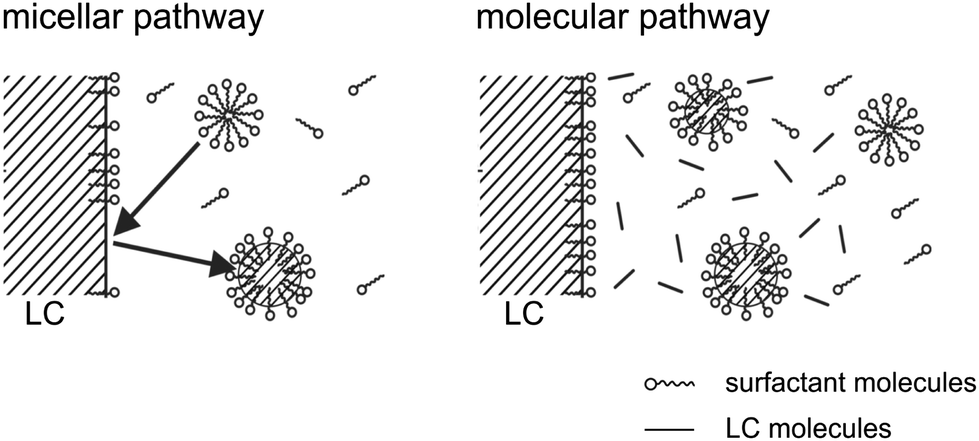 | ||
| Fig. 10 Closeup view of the droplet surface, showing the micellar and molecular pathways of solubilizing the liquid crystal (LC) in the micellar suspension surrounding the droplet. In the micellar pathway, micelles are filled with LC when they impinge on the LC/water interface. In the molecular pathway, freely diffusing LC molecules are trapped in the suspended micelles. | ||
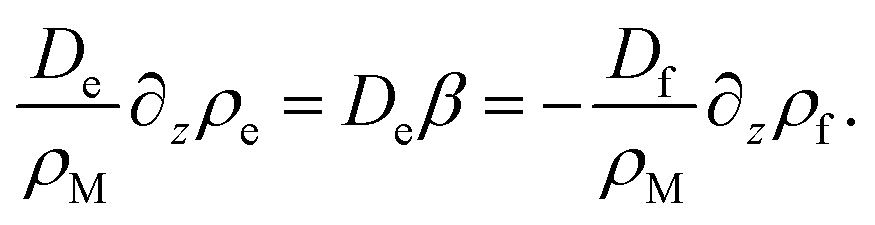
| De∂zne(z)|z=0 = −Df∂znf(z)|z=0 | (16) |
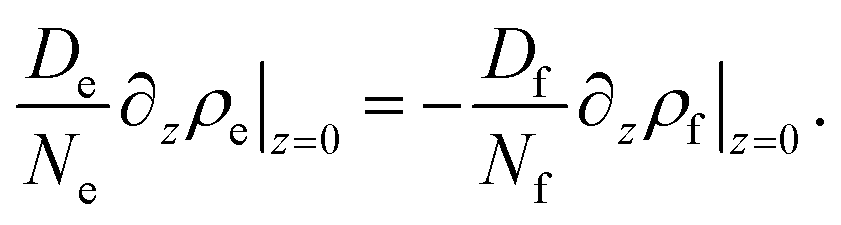 | (17) |
It is important to appreciate that since Nf > Ne, there will be additional surfactant molecules needed to fill a micelle. Since these need to come from the immediate vicinity of the interface, the surfactant layer at this interface will be depleted. As a consequence, the equilibrium between this surfactant layer and the surrounding free surfactant molecules is disturbed. Hence there will be surfactant molecules from the surrounding liquid adsorbing at the interface in order to replenish the surfactant layer. This leads to a dynamic equilibrium between the surfactant flowing diffusively towards the interface and excess surfactant bound in filled micelles which diffuse away from the interface. The current of free surfactant molecules towards the interface must be accompanied by a density gradient, such that the density of free surfactant will be less than the CMC close to the interface. This is sketched in Fig. 11a. Consequently, empty micelles, which are at equilibrium only with surfactant at the CMC, will disassociate in this domain, trying to replenish the free surfactant phase.
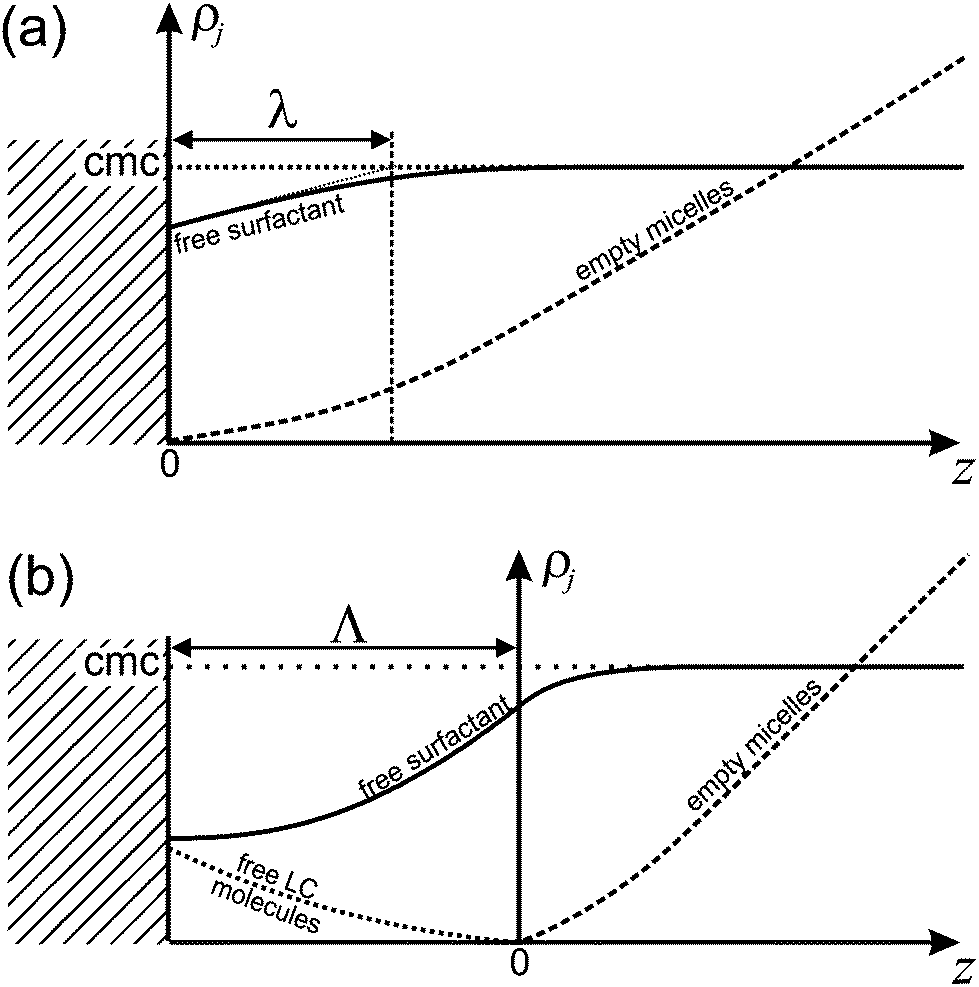 | ||
| Fig. 11 Concentration profiles in the diffusive steady state for the two cases discussed. (a) Micellar pathway. The intersection of the (thin dotted) tangent to the free surfactant concentration profile at z = 0 defines the thickness of the diffusive boundary layer, λ. (b) Molecular pathway. The zone where the formation of filled micelles takes place extends over the ‘reactive’ boundary layer with thickness Λ. | ||
We will now discuss to what density profiles these processes give rise, considering stationary quantities throughout. If the current of free surfactant molecules towards the interface is js, it must be accompanied by a gradient in the density according to
| js(z = 0) = −Ds∂zρs(z)|z=0, | (18) |
 | (19) |
 | (20) |
Let us consider the deviation of the surfactant density from the CMC in the form
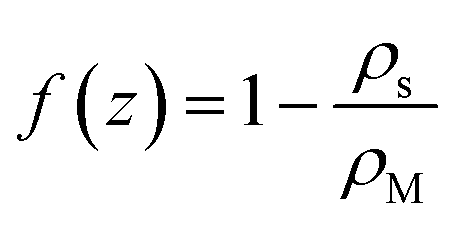 | (21) |
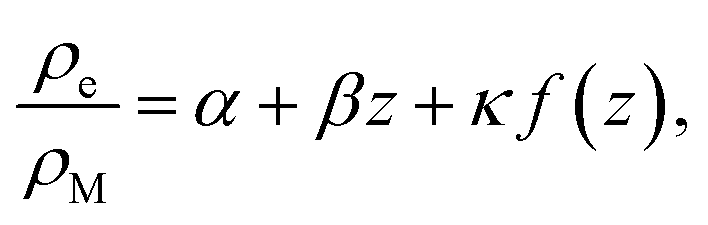 | (22) |
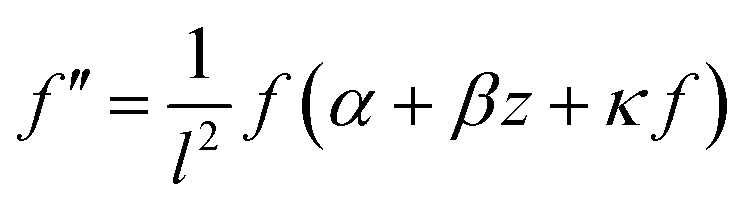 | (23) |
Inspection of eqn (22) shows that far from the interface (f(z) ≈ 0), the density of empty micelles (and hence of the surfactant bound in them) follows a linear profile with slope β. If C+ is the surfactant concentration in excess of the CMC (in other words, the total surfactant concentration is ρM + C+) far away from the interface, we simply have
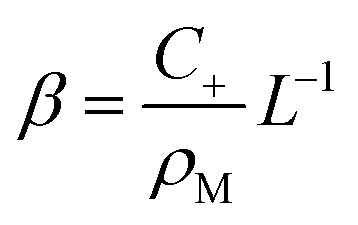 | (24) |
In order to find an expression for β, we note that there is no net current of surfactant wherever ρs = ρM = const, which is the case far away from the interface. Hence all surfactant transport towards the interface region is carried by the empty micelles, and all transport of surfactant away from the interface region is carried by the filled micelles. Far away from the interface, we therefore have
 | (25) |
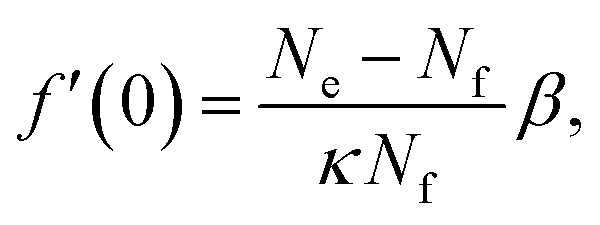
Since there is no source nor sink for filled micelles away from the interface, ρf must be strictly linear everywhere. Hence its gradient is the same immediately at the interface. We can then combine eqn (17), (22) and (25) to find
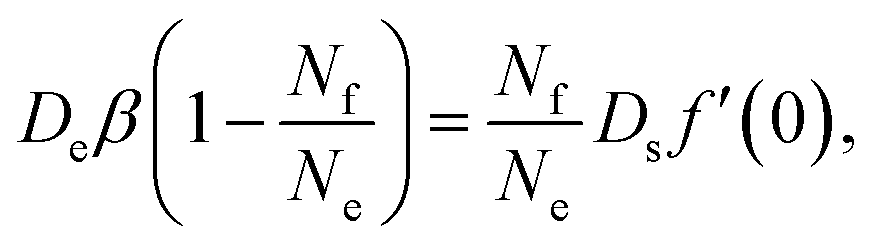 | (26) |
 | (27) |
We can gain an upper estimate for f(0) from inspection of eqn (23). Since empty micelles are converted into filled ones at the interface, we have ρe(0) = 0, and therefore α = −κf(0). Expanding ρe(z) in a Taylor series and neglecting terms higher than linear, we find
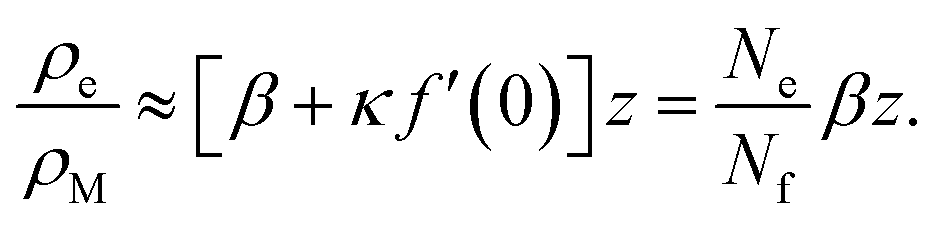 | (28) |
Rewriting now eqn (23) in terms of the auxiliary variable
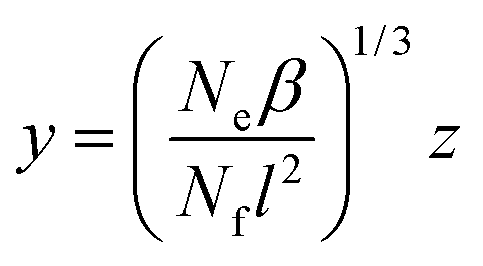 | (29) |
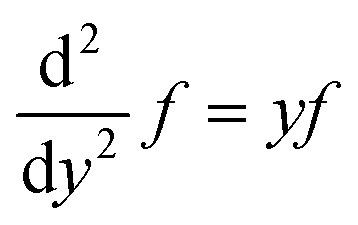 | (30) |
 | (31) |
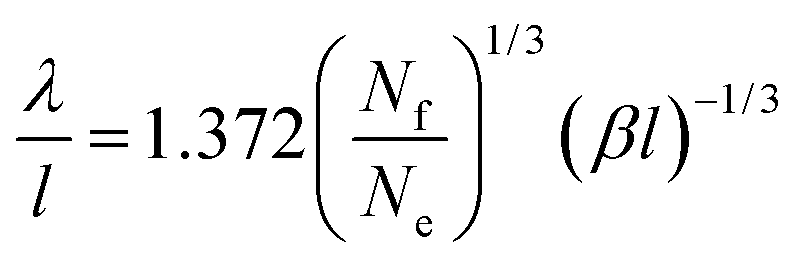
(−Ai(0)/Ai′(0) = 1.372). For the depletion of free surfactant close to the interface, we have f(0) = λf′(0), and therefore with (27)
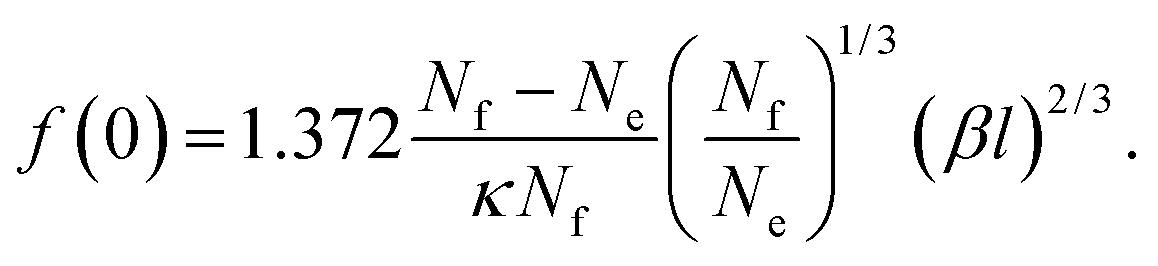 | (32) |
Inserting numbers, we realize that f(0) will be small as compared to unity.
In order to estimate the consequences such depletion will have on the coverage of the interface with surfactant, we assume that the surfactant density at the interface follows a Langmuir isotherm,71 such that
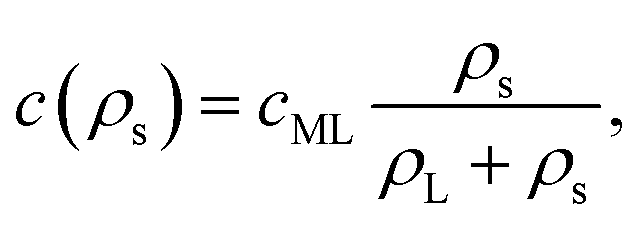 | (33) |
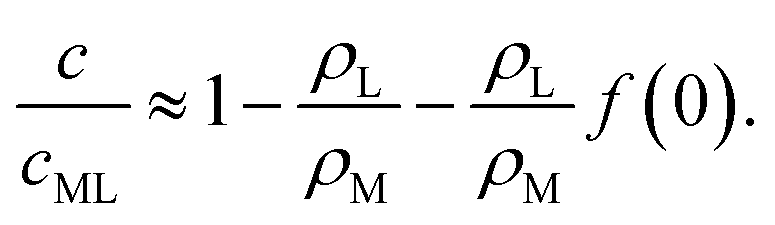 | (34) |
Qualitatively, we see from eqn (32) and (34) that increasing β results in a decrease of surfactant coverage and hence in an increase of the interfacial tension. It is quite counter-intuitive that the surfactant coverage should decrease when the rate of advection of fresh surfactant (i.e., of empty micelles) increases. The obvious reason is that the filling of the micelles itself consumes surfactant, thus providing a sink, not a source. We conclude that the micellar pathway cannot give rise to locomotion in this system.
If we now define the plane of zero z not to be at the interface but within the region where the first LC molecules enter the micelles, we can use all equations derived above for the domain of positive z. We estimate the profiles for z < 0 by assuming that micelles keep absorbing LC molecules and, concomitantly, free surfactant molecules, throughout the boundary layer left of the z-axis at a roughly constant rate. The density profile of the LC molecules, ρLC, acquires then a parabolic shape, with the boundary conditions
 | (35) |
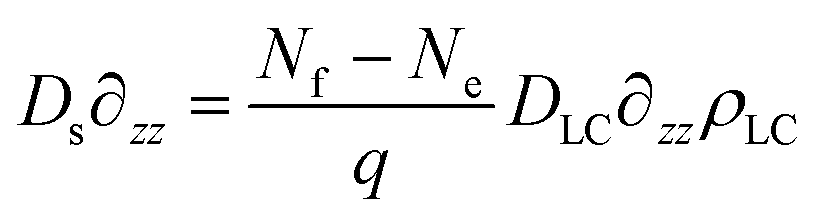
| ∂zρLC|z=−Λ = q∂zρLC|z=0 | (36) |
| DLC∂zρLC|z=−Λ = −h[ρ0 − ρLC(−Λ)] | (37) |
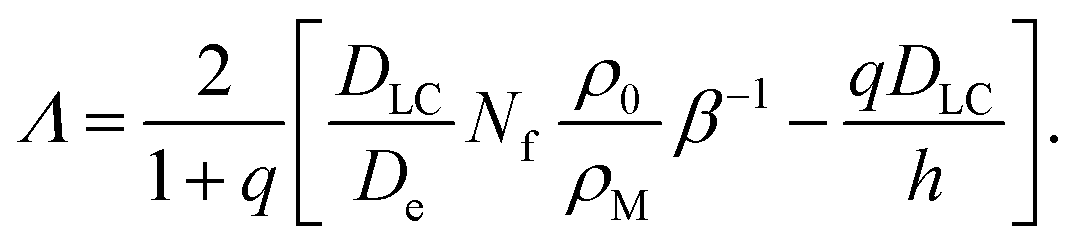 | (38) |
For small β, Λ ≫ λ, since the latter scales as β−1/3 (cf.eqn (31)) while Λ ∝ β−1. With increasing β, Λ becomes smaller and finally vanishes at a finite dissolution rate.
For the depletion of surfactant close to the interface, we use the boundary condition that ∂zρs = 0 at the interface (z = −Λ), and that
 | (39) |
 | (40) |
 | (41) |
The latter represents the ‘background’ depletion which is obtained when β = 0, i.e., when the surfactant concentration in the suspension equals the CMC. The first term on the rhs of eqn (40) stems from the profile for positive z, while the second term represents the region of negative z. The main difference with respect to our findings for the micellar pathway is that we have now, under certain conditions, a decrease of the depletion, and hence of surface tension, with increasing driving parameter, β. As opposed to the simple picture outlined at the end of Section 2, this is not due to the balance of advected ‘fresh’ surfactant, but entirely due to the change in the boundary layer thickness, Λ.
4.3 The role of advection
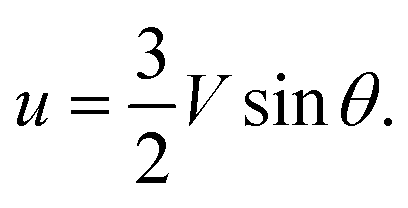
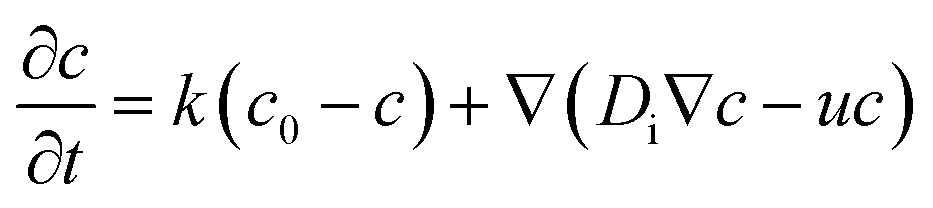
So far we have not identified the mechanism which breaks the symmetry of the homogeneous surfactant distribution on the droplet surface. What we have learned, however, is that the concentration profiles of the diffusing species exhibit strong non-trivial spatial variations only within a boundary layer with a thickness very small as compared to the size of the droplet. We will see how we can exploit this knowledge in what follows. As opposed to the chemically reactive scheme discussed in Section 3, we have now to include advection in the model in an explicit way. It is clear that a combination of diffusion and advection leads to equations one can never hope to solve analytically. However, we may try nevertheless to envisage the principal processes which are expected to be relevant. We will consider a droplet moving at a certain velocity, V, and estimate the effect of the corresponding distortion of the concentration profiles on the surfactant depletion at the droplet surface. We will then use the results obtained above to see whether this gives rise to Marangoni stresses which are sufficient to maintain the droplet motion.The flow field around the moving droplet has been given in eqn (8). On the axis of symmetry and close to the surface, we can write down the advective flow velocity outside the droplet quite generally from the local divergence of the tangential flow field at the surface. Since the three dimensional flow must be source free, we have divν = ∂rνr + ∇u = 0, and hence
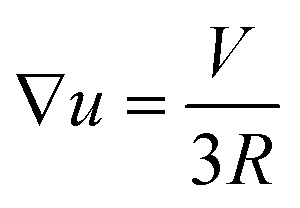 | (42) |
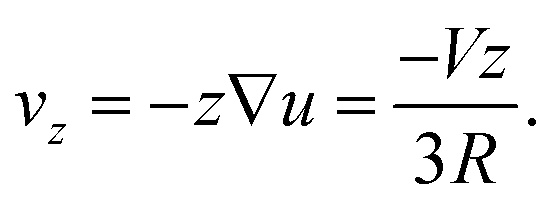 | (43) |
Let us now explore the consequences of this radial flow on the distribution of empty micelles along the symmetry axis. For the rate of change of their density, we have
 | (44) |
We consider the stationary situation, hence
 | (45) |
This is straightforward to solve, with boundary conditions ρe(0) = 0 and ρe(z → ∞) = C+. The result is
 | (46) |
 | (47) |
Close to the surface, this gives rise to an extra normal current of empty micelles, which can be treated as an increment to the driving parameter β. By combining eqn (24) with the derivative of eqn (46), this increment can be derived to be
 | (48) |
Hence we have infinite ‘sensitivity’ of β to small drift velocities, V. In other words, any small drift will induce a divergent tangential velocity field on the droplet surface (∇u ≠ 0) which is sufficient to maintain this motion, even to accelerate it. This instability is not linear, and different modes in terms of spherical harmonics will not decouple as in eqn (14). Nevertheless, we can conclude that the system is unstable with respect to fluctuations whenever the slope of Δρs(β) is negative.
In order to discuss this in some detail, we plot the depletion according to eqn (40) qualitatively as a function of the driving parameter, β. This is shown in Fig. 12. For small β, the depletion increases, similar to what we found for the micellar pathway. This leads to an increase of the local interfacial tension, and thus to a Marangoni stress pointing towards the considered area. Consequently, the system is dynamically stable under these conditions, and there will be no symmetry breaking and hence no locomotion.
 | ||
| Fig. 12 Qualitative variation of the depletion of free surfactant close to the interface, as a function of driving parameter for the molecular pathway. Depending on the slope of the curve, we have either a stable or an unstable situation. For large driving (β > β*), the surface is saturated with surfactant, such that there is no depletion. | ||
If, however, the surfactant concentration is sufficient to locate the system to the right of the maximum (β > βc), any fluctuation leading to a divergent tangential velocity field (i.e., ∇u > 0) will decrease the depletion and hence decrease the interfacial tension in that area. This results in a Marangoni stress pointing away from this area, thus further enhancing the flow velocity. The first result we can note down is that there must be a minimum concentration of surfactant, corresponding to the maximum of Δρs, below which there will be no locomotion. We find βc by demanding the derivative of (40) to vanish. This yields
 | (49) |
This corresponds to a surfactant concentration which is above the CMC, as the latter corresponds to β = 0 (cf.eqn (24)). This is indeed in accordance with the sharp threshold we observe for the onset of locomotion, well beyond the CMC (cf.Fig. 7b).
The spot where the divergent velocity field has developed will take the role of the leading edge of motion, and the depletion decreases further while the droplet velocity increases. The latter will saturate when it has reached a value corresponding to the total variation in surface tension, as we have estimated above (cf.eqn (5)). This value will be independent of surfactant concentration. If the latter is increased well beyond the maximum at βc, the total variation of interfacial tension along the droplet surface will decrease, since there is no depletion anymore for β > β*. Hence the droplet velocity will as well decrease again. All this is in accordance with the data shown in Fig. 7b.
At all stages of the symmetry breaking process, the spatial variation of the surface tension should be represented by a quite sharp kink rather than a simple spherical harmonic. This is in stark contrast to the system discussed in Section 3, where the symmetry breaking proceeds via linear instability of low-order spherical harmonics.
5 Conclusions
Active emulsions, i.e., emulsions the droplets of which perform autonomous locomotion, are promising model systems for the study of collective behavior far from thermal equilibrium. However, although the individual droplet is considerably simpler than the active species it may model, such as a bacterium or plankton cell, understanding and controlling its mechanism of locomotion sometimes poses a considerable task. In the case of chemically driven droplets, the emergence of locomotion seems to be largely understood. We have discussed that experiments, analytical theory, and numerical simulations have reached good agreement. In contrast, in the conceptually much simpler class of systems which are driven by physico-chemical dissolution processes (formation of a microemulsion), the details of the mechanism are still far from being understood. We have tried here to outline a first sketch of a theory of locomotion in such systems. It is worthwhile to note that according to this model, a molecular pathway is required for locomotion to occur, while a purely micellar pathway of dissolution does not lead to any such process. Experiments and simulations will be necessary to corroborate the picture put forward here.What is of practical interest for simulations is that nontrivial spatial density variations of the involved species (surfactant molecules and micelles) are to be expected only within a very narrow region close to the interface. Hence in simulations one only needs to consider the densities of the involved species outside this boundary layer, where they behave as passive scalars. Furthermore, it seems that only a single such field, namely the density of empty micelles, needs to be considered. As opposed to locomotion of droplets containing reactants which affect the surfactant directly,54 one needs to discuss the full advection dynamics to reproduce the dynamic instability leading to symmetry breaking and locomotion.
Abbreviations
| b | Fraction of brominated surfactant at the interface |
| b m | m-th order spherical harmonic of b |
| C + | Surfactant concentration in excess of the CMC |
| C crit+ | Critical value of C+ at which locomotion sets in |
| Ca | Capillary number, eqn (5) |
| c | Surfactant density at the droplet surface, eqn (9) |
| D j | Diffusivity of species j |
| h | Rate constant of dissolution of LC into water, eqn (37) |
| k | Rate constant of dissolution of surfactant, eqn (9) |
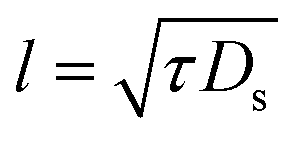
| l | Intrinsic length scale, eqn (20) |
| m | Mode index of spherical harmonics |
| M | Marangoni coefficient, eqn (11) |
| N e | Number of surfactant molecules in an empty micelle |
| N f | Number of surfactant molecules in a filled micelle |
| q | Number of LC molecules per filled micelle |
| r | Radial coordinate |
| R | Radius of droplet |
| u | Tangential flow velocity along droplet surface |
| v | 3D flow velocity field, eqn (6) and (7) |
| V | Velocity of the droplet in the laboratory frame |
| β | Normalized surfactant micelle concentration, eqn (24) |
| γ | Interfacial tension |
| η j | Viscosity of fluid j |
| θ | Polar angle in spherical coordinates |
| κ | Ratio of diffusivities, eqn (22) |
| λ | Thickness of ‘micellar’ boundary layer, eqn (31) |
| Λ | Thickness of ‘molecular’ boundary layer, eqn (38) |
| μ | Ratio of viscosities, eqn (1) and (2) |
| ρ s | Density of free surfactant |
| ρ e | Density of surfactant bound in empty micelles |
| ρ f | Density of surfactant bound in filled micelles |
| ρ L | ‘Langmuir’ surfactant density, eqn (33) |
| ρ M | Critical micelle concentration (CMC) |
| Δρs | Surfactant depletion at interface |
| ρ m | Density of surfactant bound in micelles |
| τ | Lifetime of empty micelle in pure water |
| ∂y | Partial derivative with respect to the variable y |
| ∇ | Nabla operator |
Acknowledgements
Inspiring discussions with Anke Lindner, Teresa Lopez-Rios, and Dennis Bartolo at the ESPCI, Paris, and Dominique Langevin, Wiebke Drenkhan, Emmanuelle Rio, Anniina Salonen, Rik Wensink, and Frederik Restagno at the LPS, Universite' Paris Sud, have considerably contributed to shaping this work. Financial support from the Deutsche Forschungsgemeinschaft within the SFB 755 is gratefully acknowledged. S. H. wishes to express his particular gratitude to Wiebke, Emannuelle, and Dominique for their kind hospitality and generous support during his 2013 summer stay at the LPS.References
- Y. Hatwalne, S. Ramaswamy, M. Rao and R. A. Simha, Phys. Rev. Lett., 2004, 92, 118101 CrossRef.
- I. H. Riedel, K. Kruse and J. Howard, Science, 2005, 309, 300–303 CrossRef CAS PubMed.
- F. Peruani, A. Deutsch and M. Bär, Phys. Rev. E: Stat., Nonlinear, Soft Matter Phys., 2006, 74, 030904(R) CrossRef.
- J. P. Hernandez-Ortiz, C. G. Stoltz and M. D. Graham, Phys. Rev. Lett., 2005, 95, 204501 CrossRef.
- T. Ishikawa, M. P. Simmonds and T. J. Pedley, J. Fluid Mech., 2006, 568, 119–160 CrossRef.
- T. Ishikawa and T. J. Pedley, Phys. Rev. Lett., 2008, 100, 088103 CrossRef.
- F. Ginelli, F. Peruani, M. Bär and H. Chate, Phys. Rev. Lett., 2010, 104, 184502 CrossRef.
- Y. Yang, V. Marceau and G. Gompper, Phys. Rev. E: Stat., Nonlinear, Soft Matter Phys., 2010, 82, 031904 CrossRef.
- S. Ramaswamy, Annu. Rev. Condens. Matter Phys., 2010, 1, 323–345 CrossRef.
- T. Vicsek and A. Zafeiris, Phys. Rep., 2012, 571, 71–140 CrossRef PubMed.
- M. Leoni and T. B. Liverpool, Phys. Rev. Lett., 2010, 105, 238102 CrossRef.
- E. Ben Jacob, Phys. A, 1998, 248, 57–76 CrossRef CAS.
- C. Dombrowski, L. Cisneros, S. Chatkaev, R. E. Goldstein and J. O. Kessler, Phys. Rev. Lett., 2004, 93, 098103 CrossRef.
- A. Sokolov, I. S. Aranson, J. O. Kessler and R. E. Goldstein, Phys. Rev. Lett., 2007, 98, 158102 CrossRef.
- H. P. Zhang, A. Be’er, E.-L. Florin and H. L. Swinney, Proc. Natl. Acad. Sci. U. S. A., 2010, 107, 13626–13630 CrossRef CAS PubMed.
- C. Marchetti, et al. , Rev. Mod. Phys., 2013, 85, 1143–1189 CrossRef.
- U. Sommer, J. Padisak, C. S. Reynolds and P. Juhasz-Nagy, Hydrobiologia, 1993, 249, 1–7 CrossRef.
- F. d'Ovidio, S. De Monte, S. Alvain, Y. Dandonneau and M. Levy, Proc. Natl. Acad. Sci. U. S. A., 2010, 107, 18366–18370 CrossRef PubMed.
- S. M. Gallager, H. Yamazaki and C. S. Davis, Mar. Ecol.: Prog. Ser., 2004, 267, 27–43 CrossRef.
- E. Malkiel, O. Alquaddoomi and J. Katz, Meas. Sci. Technol., 1999, 10, 1142–1152 CrossRef CAS.
- S. A. Thorpe, Annu. Rev. Fluid Mech., 2004, 36, 55–79 CrossRef.
- H. Yamazaki, Bull. Mar. Sci., 1993, 53, 265–278 Search PubMed.
- F. De Lillo, M. Cencini, W. M. Durham and M. Barry, Phys. Rev. Lett., 2014, 112, 044502 CrossRef.
- A. Sokolov and I. S. Aranson, Phys. Rev. Lett., 2009, 103, 148101 CrossRef.
- S. Rafai, L. Jibuti and P. Peyla, Phys. Rev. Lett., 2010, 104, 098102 CrossRef.
- J. Gachelin, et al. , Phys. Rev. Lett., 2013, 110, 268103 CrossRef.
- W. McKiver and Z. Neufeld, Phys. Rev. E: Stat., Nonlinear, Soft Matter Phys., 2009, 79, 061902 CrossRef.
- W. M. Durham, et al. , Nat. Commun., 2013, 4, 2148 Search PubMed.
- H. H. Jakobsen and S. L. Strom, Limnol. Oceanogr., 2004, 49, 1915–1922 CrossRef.
- H. Wioland, et al. , Phys. Rev. Lett., 2013, 110, 268102 CrossRef.
- J. Dunkel, et al. , Phys. Rev. Lett., 2013, 110, 228102 CrossRef.
- R. W. Eppley, R. W. Holmes and J. D. H. Strickland, J. Exp. Mar. Biol. Ecol., 1967, 1, 191–208 CrossRef.
- T. Vicsek, A. Czirok, E. Ben-Jacob, I. Cohen and O. Shochet, Phys. Rev. Lett., 1995, 75, 1226–1229 CrossRef CAS.
- J. Toner and Y. Tu, Phys. Rev. E: Stat. Phys., Plasmas, Fluids, Relat. Interdiscip. Top., 1998, 58, 4828–4858 CrossRef CAS.
- H. H. Wensink, et al. , Proc. Natl. Acad. Sci. U. S. A., 2012, 109, 14308–14313 CrossRef CAS PubMed.
- P. Cremer and H. Löwen, Phys. Rev. E: Stat., Nonlinear, Soft Matter Phys., 2014, 89, 022307 CrossRef.
- A. M. Menzel, T. Ohta and H. Löwen, Phys. Rev. E: Stat., Nonlinear, Soft Matter Phys., 2014, 89, 022301 CrossRef.
- J. Bialke, H. Löwen and Th. Speck, Europhys. Lett., 2013, 103, 30008 CrossRef CAS.
- I. Buttinoni, et al. , Phys. Rev. Lett., 2013, 110, 238301 CrossRef.
- H. H. Wensink and H. Löwen, J. Phys.: Condens. Matter, 2012, 24, 464130 CrossRef CAS PubMed.
- K. M. Ehlers, D. Samuel, H. C. Berg and R. Montgomery, Proc. Natl. Acad. Sci. U. S. A., 1996, 93, 8340 CrossRef CAS.
- K. Drescher, K. C. Leptos, I. Tuval, T. Ishikawa, T. J. Pedley and R. E. Goldstein, Phys. Rev. Lett., 2009, 102, 168101 CrossRef.
- M. T. Downton and H. Stark, J. Phys.: Condens. Matter, 2009, 21, 204101 CrossRef PubMed.
- J. R. Blake, J. Fluid Mech., 1971, 46, 199–208 CrossRef.
- S. Michelin, E. Lauga and D. Bartolo, Phys. Fluids, 2013, 25, 061701 Search PubMed.
- There are numerous systems which instead impose a broken symmetry, such as Janus particles.39,75,76 These are not considered in the present work.
- A. A. Darhuber and S. M. Trojan, Annu. Rev. Fluid Mech., 2005, 37, 425–455 CrossRef.
- http://commons.wikimedia.org/wiki/File:Calusopassito.jpg .
- E. Guyon, J.-P. Hulin, L. Petit and C. D. Mitescu, Physical Hydrodynamics, Oxford University Press, 2001 Search PubMed.
- M. D. LeVan, J. Colloid Interface Sci., 1981, 83, 11–17 CrossRef CAS.
- T. Banno, R. Kuroha and T. Toyota, Langmuir, 2012, 28, 1190–1195 CrossRef CAS PubMed.
- T. Ban, T. Yamagami, H. Nakata and Y. Okano, Langmuir, 2013, 29, 2554–2561 CrossRef CAS PubMed.
- H. Kitahata, N. Yoshinaga, K. H. Nagai and Y. Sumino, Phys. Rev. E: Stat., Nonlinear, Soft Matter Phys., 2011, 84, 015101(R) CrossRef.
- S. Thutupalli, R. Seemann and S. Herminghaus, New J. Phys., 2011, 13, 073021 CrossRef.
- S. Thutupalli and S. Herminghaus, Eur. Phys. J. E, 2013, 36, 91 CrossRef PubMed.
- A. N. Zaikin and A. M. Zhabotinsky, Nature, 1970, 225, 535–537 CrossRef CAS PubMed.
- A. T. Winfree, Science, 1972, 175, 634–636 CAS.
- S. Thutupalli, Towards Autonomous Soft Matter Systems, Springer, Heidelberg, 2014 Search PubMed.
- M. D. LeVan and J. Newman, AIChE J., 1976, 22, 695–701 CrossRef CAS.
- M. Schmitt and H. Stark, Europhys. Lett., 2013, 101, 44008 CrossRef.
- V. Pimienta, M. Brost, N. Kovalchuk, S. Bresch and O. Steinbock, Angew. Chem., Int. Ed., 2011, 50, 10728–10731 CrossRef CAS PubMed.
- K. Peddireddy, P. Kumar, S. Thutupalli, S. Herminghaus and C. Bahr, Langmuir, 2012, 28, 12426–12431 CrossRef CAS PubMed.
- A. Sengupta, Topological Micro-Fluidics, Springer, Heidelberg, 2013 Search PubMed.
- O. O. Prishchepa, A. V. Shabanov and V. Y. Zyryanov, Phys. Rev. E: Stat., Nonlinear, Soft Matter Phys., 2005, 72, 031712 CrossRef CAS.
- Ch. Bahr, Phys. Rev. E: Stat., Nonlinear, Soft Matter Phys., 2006, 73, 030702(R) CrossRef.
- Food Proteins and Lipids, ed. S. Damodaran, Springer, Heidelberg, 1997 Search PubMed.
- N. Matubayasi, S. Sugiyama, M. Kanzaki and A. Matuzawa, J. Colloid Interface Sci., 1997, 196, 123 CrossRef CAS PubMed.
- B.-H. Chen, C. A. Miller and P. R. Garrett, Langmuir, 1998, 14, 31 CrossRef CAS.
- P. D. Todorov, et al. , J. Colloid Interface Sci., 2002, 245, 371 CrossRef CAS PubMed.
- S. Ariyaprakai and S. R. Dungan, Langmuir, 2008, 24, 3061 CrossRef CAS PubMed.
- I. Langmuir, J. Am. Chem. Soc., 1916, 38, 2221 CrossRef CAS.
- A. J. I. Ward and K. Quingley, J. Dispersion Sci. Technol., 1990, 11, 143 CrossRef CAS.
- S. G. Oh and D. O. Shah, J. Am. Oil Chem. Soc., 1993, 70, 673 CrossRef CAS.
- Handbook of Mathematical Functions, ed. M. Abramowitz and I. A. Stegun, Dover, New York, 1965 Search PubMed.
- S. Gangwal, O. J. Cayre, M. Z. Bazant and O. D. Velev, Phys. Rev. Lett., 2008, 100, 058302 CrossRef.
- J. Palacci, S. Sacanna, A. P. Steinberg, D. J. Pine and P. M. Chaikin, Science, 2013, 339, 936–940 CrossRef CAS PubMed.
| This journal is © The Royal Society of Chemistry 2014 |