Formative assessment by first-year chemistry students as predictor of success in summative assessment at a South African university
Hlengani J.
Siweya
* and
Peter
Letsoalo
Faculty of Science and Agriculture, University of Limpopo, Private Bag X1106, Sovenga, 0727, South Africa. E-mail: Hlengani.Siweya@ul.ac.za; Peter.Letsoalo@ul.ac.za
First published on 21st April 2014
Abstract
This study investigated whether formative assessment is a predictor of summative assessment in a university first-year chemistry class. The sample comprised a total of 1687 first-year chemistry students chosen from the 2011 and 2012 cohorts. Both simple and multiple linear regression (SLR and MLR) techniques were applied to perform the primary aim of the research. In order to apply the above mentioned techniques, a selection criterion was executed on the 1687 sample, after which 1519 cases remained for the analysis. The study revealed a statistically significant SLR model, suggesting that formative assessment (FA) can, at 45.4% (that is R2 = 0.454) level of accuracy, predict the summative assessment (SA) of students in a university first-year chemistry class. Furthermore, the results of two MLR models discovered that SA can be predicted by using theory marks at 57.1% (that is R2 = 0.571) level of accuracy, and average semester test marks at 59.4% (that is R2 = 0.594) level of accuracy. The aforementioned domino effects suggest that the semester tests marks are more efficient, among other marks, in predicting the SA marks of students in a chemistry department at a South African traditional university; accordingly recommends that more effort be made in preparing students for their semester marks. In addition the study found that of the 1519 students who had the 40% subminimum entry requirement for summative assessment, 765 (51.4%) passed the summative assessment, that of the 277 whose formative assessment mark was between 40% and 49% (both inclusive), 6 (2.2%) passed the summative assessment, that of the 1208 whose formative assessment mark was at least 50%, 725 (60%) passed the summative assessment and, finally, that of the 34 students whose formative assessment mark was at least 75% only 8 were able to retain their grades. Overall, linear regression and probability analyses suggest that FA does predict the SA mark, but it is best when the AVRSEMT mark is used.
1. Introduction
It is often difficult to explain the discrepancy between the formative and summative marks of many students at higher education institutions (HEIs). Research has shown that inconsistent standards of assessment in both formative and summative settings do lead to inconsistent performance by students at university; and that, on the relationship between formative and summative assessments, it has been shown that many students' performance in formative assessment (FA) far exceeds their performance in summative assessment (SA). There is also speculation that these discrepancies are attributable to a plethora of issues, chief amongst which could be: cheating by students in one form or other, repetition by lecturers of previous years' test questions or assignment tasks or tutorial test questions – from whence, without understanding of or insight into solutions, the students memorise marking schemes and reproduce them in the tests or examinations.For these and other reasons, we compared formative and summative marks of first-year chemistry students over a period of two years: from a sample of 1519 first-year chemistry students of the 2011 and 2012 cohorts at the university where the study was conducted, 37% and 32% of these respective cohorts had formative assessment marks of at least 50% but failed to acquire the subminimum† of 40% in the summative assessments (see Fig. 1).
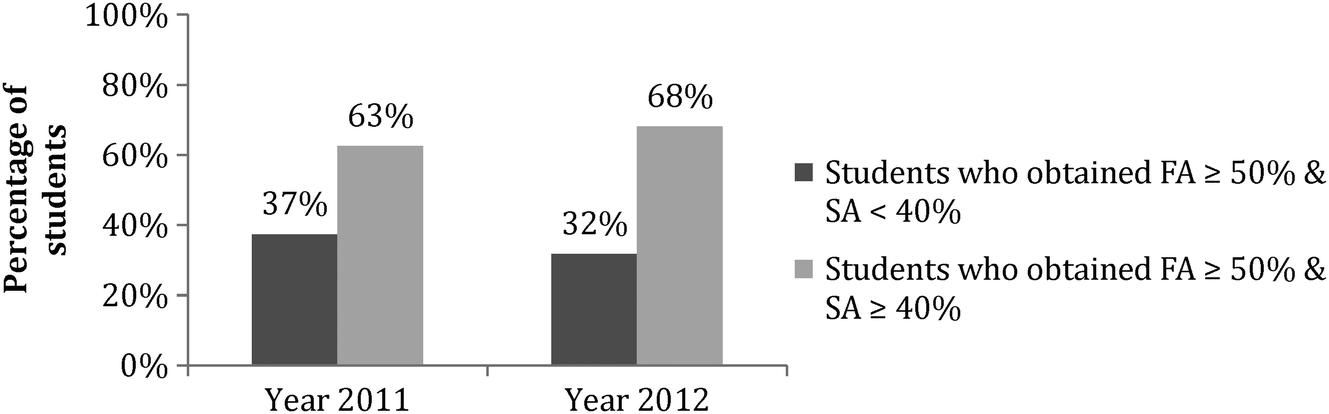 | ||
| Fig. 1 Students who obtained FA ≥ 50% & SA < 40% and FA ≥ 50% & SA ≥ 40%. | ||
First-year chemistry at the university consists of two modules which are basic requirements for all students who are registered for a first science degree in the Physical Sciences and Life Sciences streams, they are also prerequisites for most of the modules that are compulsory in this degree. In this connection, it would be interesting from an academic point of view on the one hand, and faculty management point of view on the other, to know whether or not the performance of first-year chemistry students in formative assessment can be used to predict their performance in the summative assessment, as well as to know the correlation strength between students' formative assessments and their summative assessments in a chemistry department at a traditional‡ South African university.
2. Background and theoretical framework
Over the past few years, assessment has become a very important topic in both secondary and tertiary education in South Africa to the extent that the performance of students does not only become a record to be content with but forms an integral part of the learning and teaching processes in schools and HEIs. In fact, there are HEIs (and few secondary schools) where Teaching Excellence awards are dependent on teaching portfolios and the pass rates of students in the subjects taught by the recipients.2.1 Formative and summative assessments
There are many views, not necessarily convergent, on what formative assessment is. Our understanding of formative assessment is as follows: a weighted mark obtained from a collection of predetermined assessment tasks. These tasks may include assignments, quizzes, projects and tests (theory, tutorials and or practicals). An assessment task is also considered to advance learning in so far as it provides information that a lecturer can use in assessing his/her teaching effectiveness. This form of assessment has been referred to as ‘assessment for learning’ by Sorenson (2000). Formative assessment should also assist students learn better upon receipt of assessment feedback, which helps the lecturer assess himself or herself and helps students assess themselves or one another. In agreement, Black and William (1998) argue that “… assessment becomes formative assessment when the evidence is actually used to adapt the teaching work to meet learning needs” and by improving performance in formative assessments academic standards are raised as well. In addition, Crumrine and Demers (2007) noted that “A useful arsenal of formative assessment tools becomes nothing more than a cluster of gimmicks if not used in a way to inform instruction”. In effect, this implies that not only should formative assessment help the student in exerting himself or herself in a module but “for assessment to be formative, it requires feedback which indicates the existence of a ‘gap’ between the actual level of the work being assessed and the required standard. It also requires an indication of how the work can be improved to reach the required standard” (Taras, 2005). A similar view is echoed by Osado et al. (2013) in the sense that “formative assessment provides a collaborative framework that generates useful feedback information that can be used by both learners and teachers”.In this study, we understand summative assessment to be taken at the end of the module, so it is expected to be based on and to cover all the topics outlined in a module: it is an end-of-the module examination. Unlike formative assessment, summative assessment is not used to inform learning by students but rather to inform the lecturer and the department whether or not the student has acquired enough knowledge to have passed the module and thereby declared competent. According to Taber (2003), summative assessments “are intended to test how well candidates know (can recall, apply and explain) their science”. In this study, we follow Ussher and Earl (2010) and Taras (2005) in that every “…process of assessment leads to summative assessment, that is, a judgement which encapsulates all the evidence up to a given point. This point is seen as a finality at the point of judgement”. For that reason, “summative assessments happen too far down the learning path to provide information” to the department for it to provide remedial interventions during the course of the teaching and learning of the module as is the case with formative assessment (see Garrison and Ehringhaus, 2007).
2.2 Topics covered in the modules
First-year chemistry at this institution comprises two modules (or courses) taken over two semesters: a semester is a six month-long period starting in January or July and ending with semester examinations in May/June or November/December, respectively. In the first semester, students take General Chemistry 1A in which a student is considered competent if they are conversant with the terminology used in chemistry, the periodic table, quantitative chemical relationships, thermo-chemistry, gases, colligative properties of solutions, acids and bases, chemical equilibria in acid or base systems, electrochemistry, the rates of reactions and thermodynamics.The second semester first-year chemistry module students take General Chemistry 1B and their competence is judged on them proving competence in the atomic and electronic structure, chemical bonding, intermolecular attractions and liquids and solids, alkanes, alkenes and alkynes, and alkyl halides, alcohols, aldehydes and ketones, acids and derivatives, aromatics, amines and conformational analysis.
3. Scope of the study
Teaching and Learning is a wide-ranging field, with a robust hypothetical and experiential base (Biggs and Tang, 2011), so this study influences primarily the assessment of teaching and learning in chemistry education. It also adds value to reported studies that explain the relationship between FA and SA (see for instance, Sorenson, 2000; Black et al., 2004; Taras, 2005). The study aims to determine whether or not the performance of first-year chemistry students in FA can be used to predict their performance in the SA in a chemistry department at a South African traditional university. (SA (Summative Assessment) is the final assessment of a module that takes place at the end of a semester.) The study also investigated what the overall pass rate was of students whose FA was at least 40%; determined whether or not the students whose FA fell between 40% and 49%, both inclusive, passed the module after their first ordinary examination; determined whether or not the students whose FA ranged from 50% to 74% passed the module after writing their first ordinary examination; as well as investigated whether or not those students whose FA were at least 75% (considered to the least final examination mark required for a distinction) retained their status during the first ordinary examination.4. Methodology
4.1 Research settings and student population
Marks for first-year chemistry major modules for the 2011 and 2012 academic years, obtained from the Department of chemistry at the university where this study was conducted, were used as secondary data for the analysis. These records were sourced from the chemistry lecturers offering the two modules through the Head of Department and there was agreement that neither the names of the lecturers nor those of the students enrolled for the two modules would be divulged. All variables included in the data are: FA marks with a weight of 100%; SA marks with a weight of 100%; average practical tests (AVRPT) marks with a weight of 50%; theory marks weighted at 50%; average semester tests (AVRSEMT) marks with a weight of 40%; average assignments and/or tutorial tests (AVRATT) marks with a weight of 10%. The following is the equation presenting how FA of each student was calculated:| FA = Theory mark + AVRPT mark |
Although the data indicates how many semester tests were written it does not specify how many practical tests, assignments and tutorial tests were written by students (see Table 1). The data show only the AVRPT, average assignments and/or tutorial tests (AVRATT) for every student.
| Year | Semester | Number of assessments | ||
|---|---|---|---|---|
| Semester tests | AVRPT | AVRATT | ||
| 2011 | 1st | 4 | 1 | 1 |
| 2nd | 4 | 1 | 1 | |
| 2012 | 1st | 3 | 1 | 1 |
| 2nd | 4 | 1 | 1 | |
4.2 Data collection and selection criteria
In order to obtain the final data to perform the analysis, the selection criteria (SC) require the student to have(a) written all semester tests;
(b) obtained at least a mark for AVRPT, obtained at least a mark for AVRATT and obtained a subminimum of 40%.
After implementing the selection criteria on the original secondary data with 1687 registrations, the data remained with 1519 registrations (see Table 2).
| Year | Semester | Number of registrations (before SC) | Number of registrations (after SC) |
|---|---|---|---|
| 2011 | 1st | 430 | 379 |
| 2nd | 416 | 375 | |
| 2012 | 1st | 417 | 396 |
| 2nd | 424 | 369 | |
| Total | 1687 | 1519 | |
5. Data analysis and results
5.1 Data examining
Descriptive statistics was used on the data for the analysis (see Table 3). As can be seen from table, SA indicated a very high standard deviation (13.153) with the mean (42.78) that is below 50%; when compared with FA marks, SA shows a higher variation with a lower mean value. Consequently, this seems to suggest inconsistency between FA and SA. A 0* minimum mark of AVRATT does not necessarily mean the value zero but a mark between 0 and 0.5, both exclusive. Based on the mean of the theory and AVRPT marks, seemingly these cohorts were performing better in the practicals than in the theory tests (that is, the semester tests and AVRATT).| Marks | N | Minimum | Maximum | Mean | Std. deviation |
|---|---|---|---|---|---|
| AVRSEMT (40%) | 1519 | 8 | 38 | 22.59 | 5.010 |
| AVRATT (10%) | 1519 | 0* | 5 | 2.71 | 0.755 |
| Theory (50%) | 1519 | 11 | 43 | 25.31 | 5.198 |
| AVRPT (50%) | 1519 | 15 | 47 | 32.20 | 4.528 |
| FA (100%) | 1519 | 40 | 85 | 57.25 | 8.157 |
| SA (100%) | 1519 | 8 | 80 | 42.78 | 13.153 |
5.2 Regression and correlation analysis
Although the results of students of the same institution, class or course are positively correlated because they share several unobserved factors, the main statistical technique for making proper adjustments while measuring uncertainty is Regression Analysis. The data was taken from first-year chemistry modules of 2011 and 2012 for 1st and 2nd semesters. These modules were taught by different lecturers, so the assumptions on variance-covariance structure that assume independence of observations will not be violated (Matilde et al., 2009). In order to investigate whether or not it is appropriate to use the first-year chemistry students' FA to predict their SA in a chemistry department at a South African traditional university, we employed both Simple and Multiple Linear Regression (SLR and MLR) analyses. These techniques are expected to produce a prediction function for forecasting the value of a response variable using predictor variable(s) (Graybill and Iyer, 1994). Another statistical method that was used is Correlation Analysis (CA); this will describe the relationship between the response and predictor variables in terms of both the strength of the relationship and the direction (see also Ho, 2006; Schwab, 2007). From the dataset of 1519, three groups were formed based on the predictor variable(s) as reflected in Table 4 below.| Groups | Response variable | Predictor variable(s) |
|---|---|---|
| Group 1 (G1) | SA | FA |
| Group 2 (G2) | SA | Theory and AVRPT |
| Group 3 (G3) | SA | AVRPT, AVRATT and AVRSEMT |
The datasets were then used to design 3 models all of which were performed at 95% confidence level. We designated them Model 1 of G1, Model 2 of G2 and Model 3 of G3.
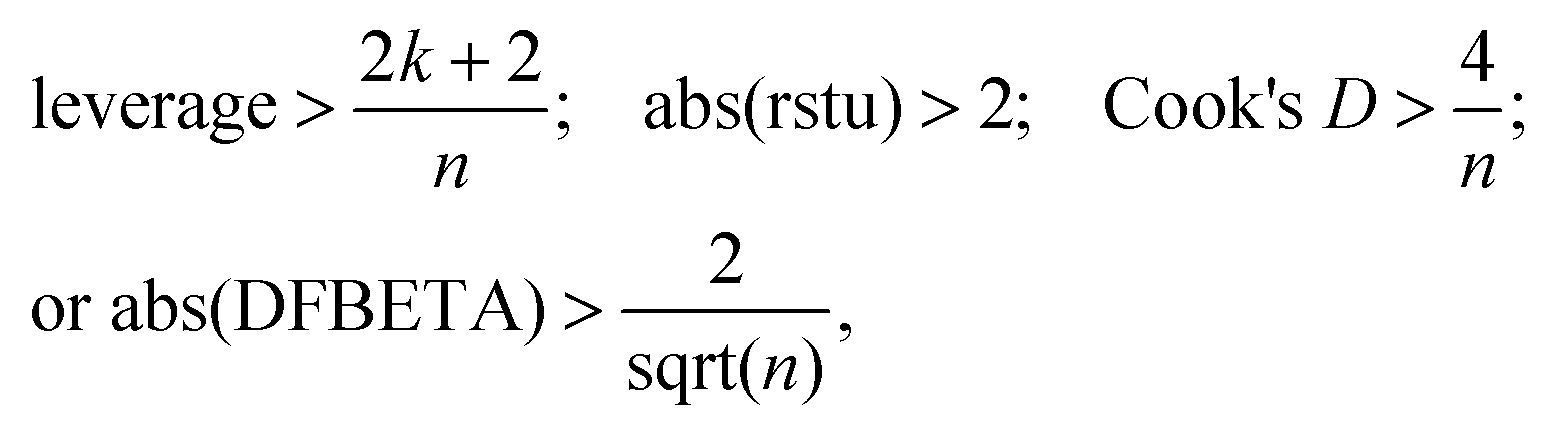
When performing this regression analysis technique, we performed regression diagnostics; where the relationships between the predictor variables and the response variable was found to be linear; the errors were also normally distributed; the error variance was found to be constant; the errors associated with one observation were not correlated with the errors of any other observation. Observations with large residuals, observation with an extreme value on a predictor variable, and influential§ observation were removed when performing regression diagnostics. The general rules of thumb that were used to investigate and omit the aforementioned observations are when the observation has:
 | ||
| Fig. 2 Scatterplot of SA by FA. | ||
| Model | R | R square | Adjusted R square | Std. error of the estimate |
|---|---|---|---|---|
| Model 1 of G1 | 0.674 | 0.454 | 0.454 | 8.922 |
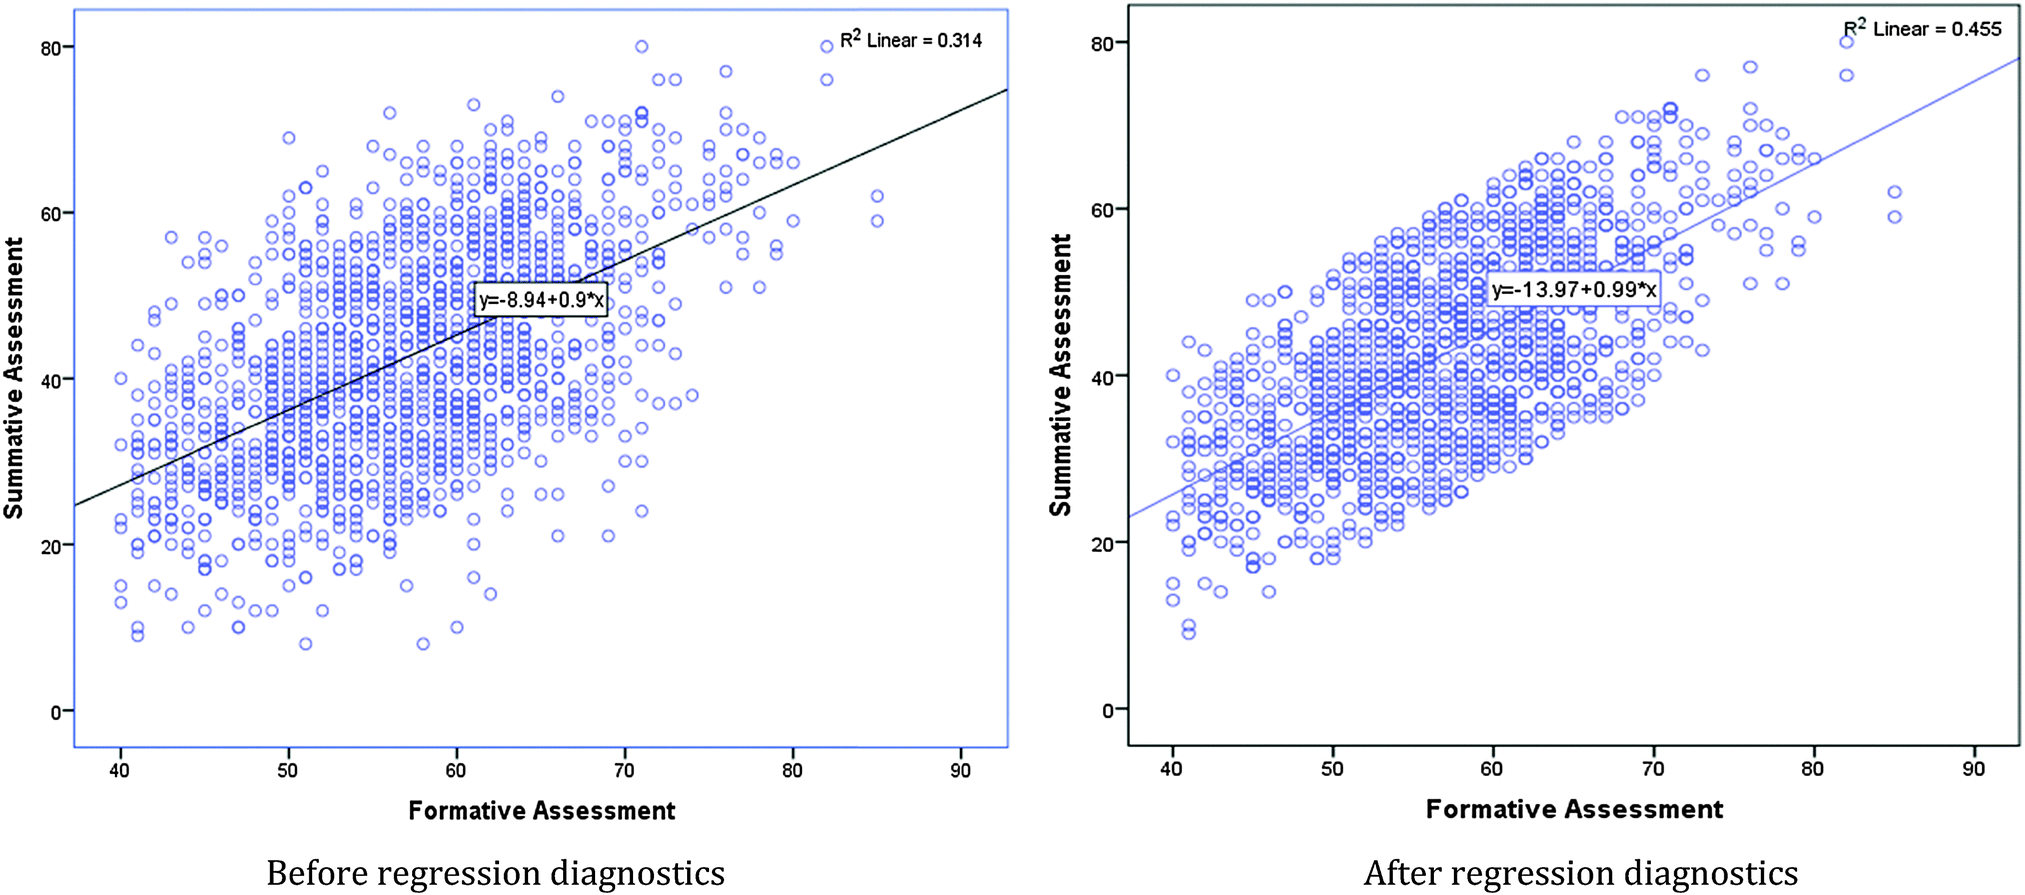
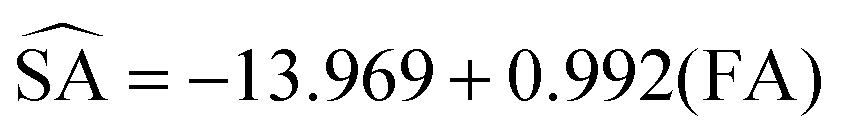
Regression analysis for Model 1 of G1 was performed with 1378 registrations. The model contains the variable FA mark with a multiple R of 0.674, revealing a strong positive relationship between FA and SA (see Table 5). The R2 of 0.454 (R2 = 0.6742) which means that the accuracy of predicting scores for the students' SA marks will be at approximately 45.4% if the prediction is based on scores for FA mark. The FA mark was found to be statistically significant with p-value less than 0.05 (see Sig. in Table 6); hence, for every additional one mark on the FA mark, the SA mark will increase by 0.992. The model that should be used to predict the SA at approximately 45.4% accuracy is eqn (1), where the FA mark of a student should be between 40% and 100%, both inclusive.
 | (1) |
| Model 1 of G1 | Unstandardized coefficients | Standardized coefficients | t | Sig. | |
|---|---|---|---|---|---|
| B | Std. error | Beta | |||
| Constant | −13.969 | 1.696 | −8.238 | 0.000 | |
| Formative mark | 0.992 | 0.029 | 0.674 | 33.869 | 0.000 |
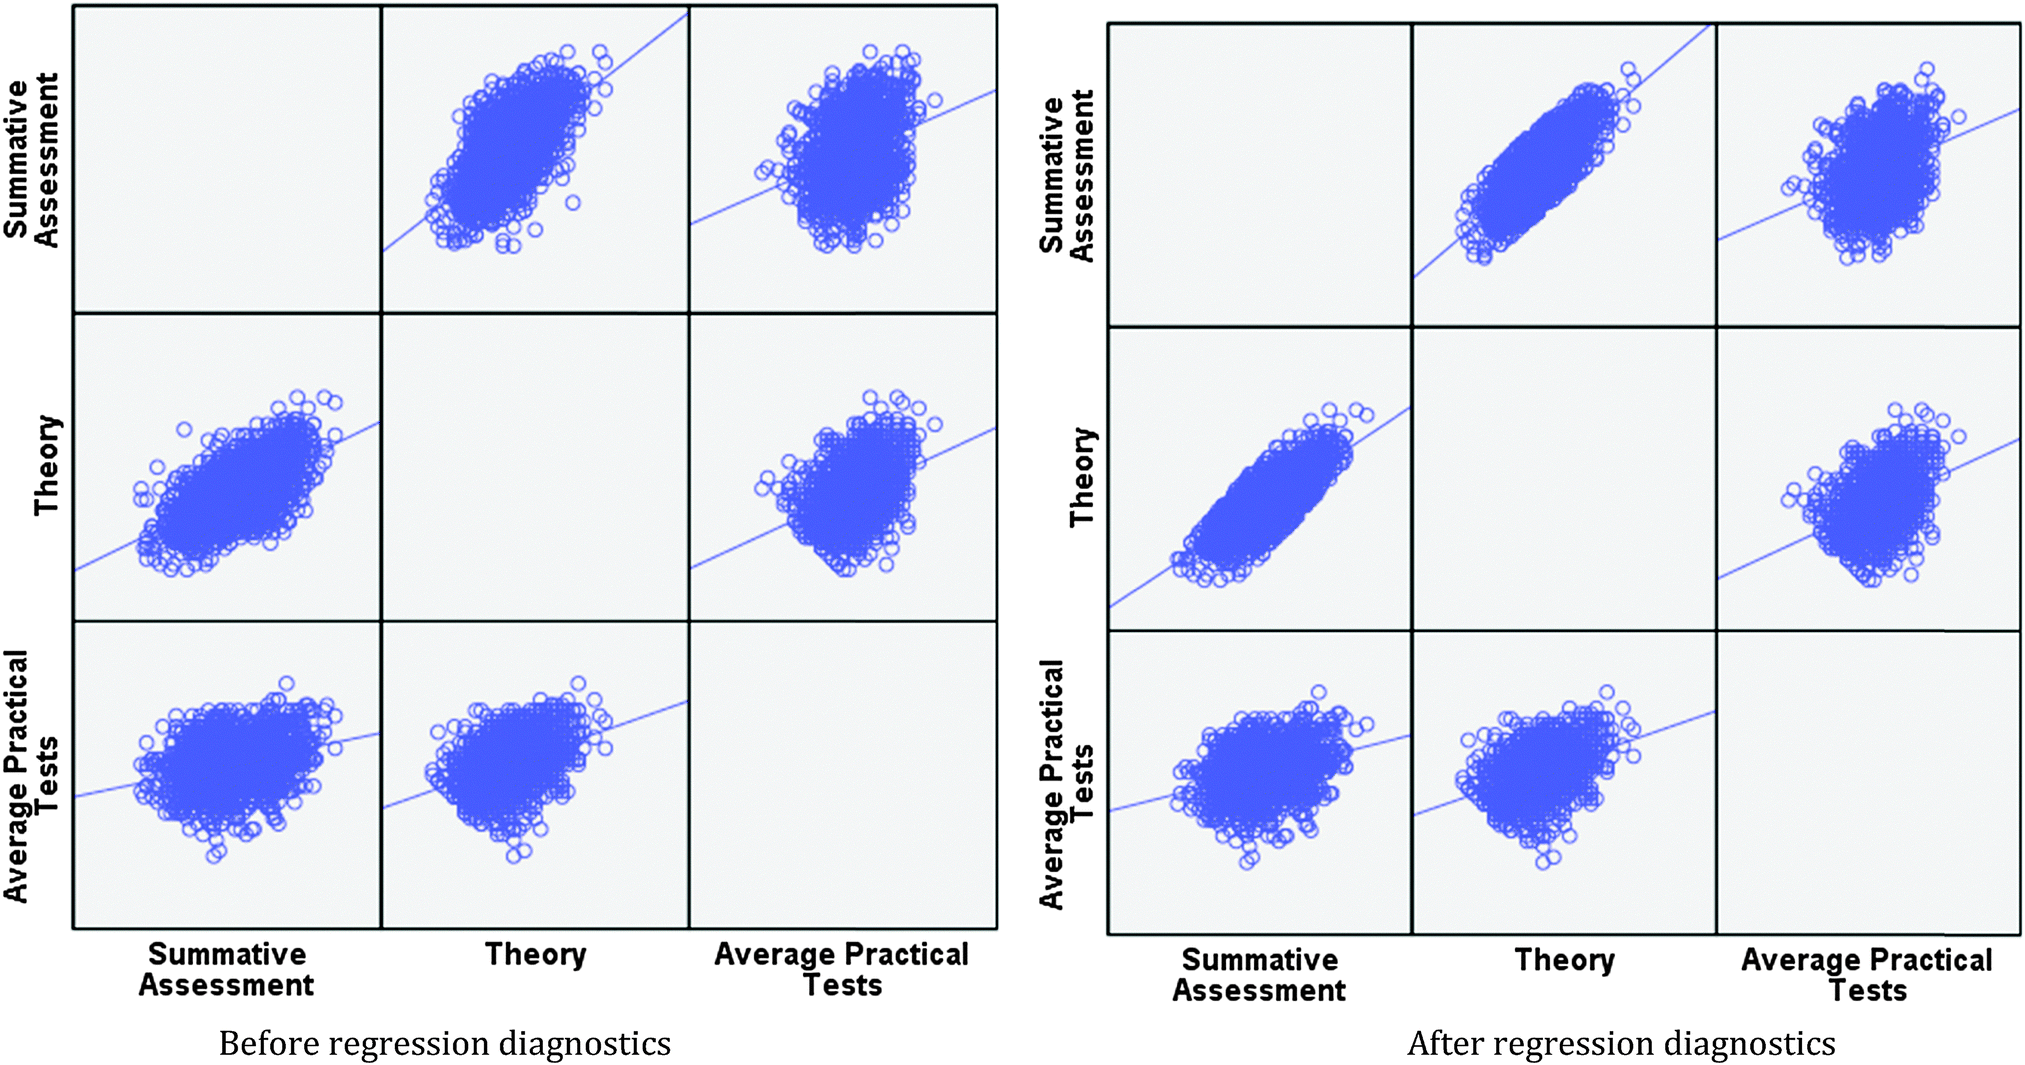 | ||
| Fig. 3 Matrix Scatterplot of SA by theory, AVRPT. | ||
From the test results we deduced that only the theory mark is significant at 0.05 significant level with a multiple R of 0.756; thereby revealing a strong positive relationship between theory and SA marks. The R2 of 0.571 which primarily means that the accuracy of predicting scores for the students' SA marks will improve by approximately 57.1% if the prediction is based on scores for theory marks. The theory marks were found to be statistically significant with a coefficient value of 1.7; thus inferring that for every one added mark on the theory mark, the SA mark will increase by 0.995. The test revealed that the coefficient of the average practicals mark is not significantly different from zero; so, it is not necessary to include this mark in the model. The model (prediction function) that should be used to predict the SA at approximately 57.1% accuracy is eqn (2), where theory mark of a student cannot exceed 50% (Tables 7 and 8).
 | (2) |
| Model | R | R square | Adjusted R square | Std. error of the estimate |
|---|---|---|---|---|
| Model 2 of G2 | 0.756 | 0.571 | 0.571 | 7.781 |
| Model 2 of G2 | Unstandardized coefficients | Standardized coefficients | t | Sig. | |
|---|---|---|---|---|---|
| B | Std. error | Beta | |||
| Constant | −1.175 | 1.047 | −1.123 | 0.262 | |
| Theory | 1.700 | 0.040 | 0.756 | 42.105 | 0.000 |
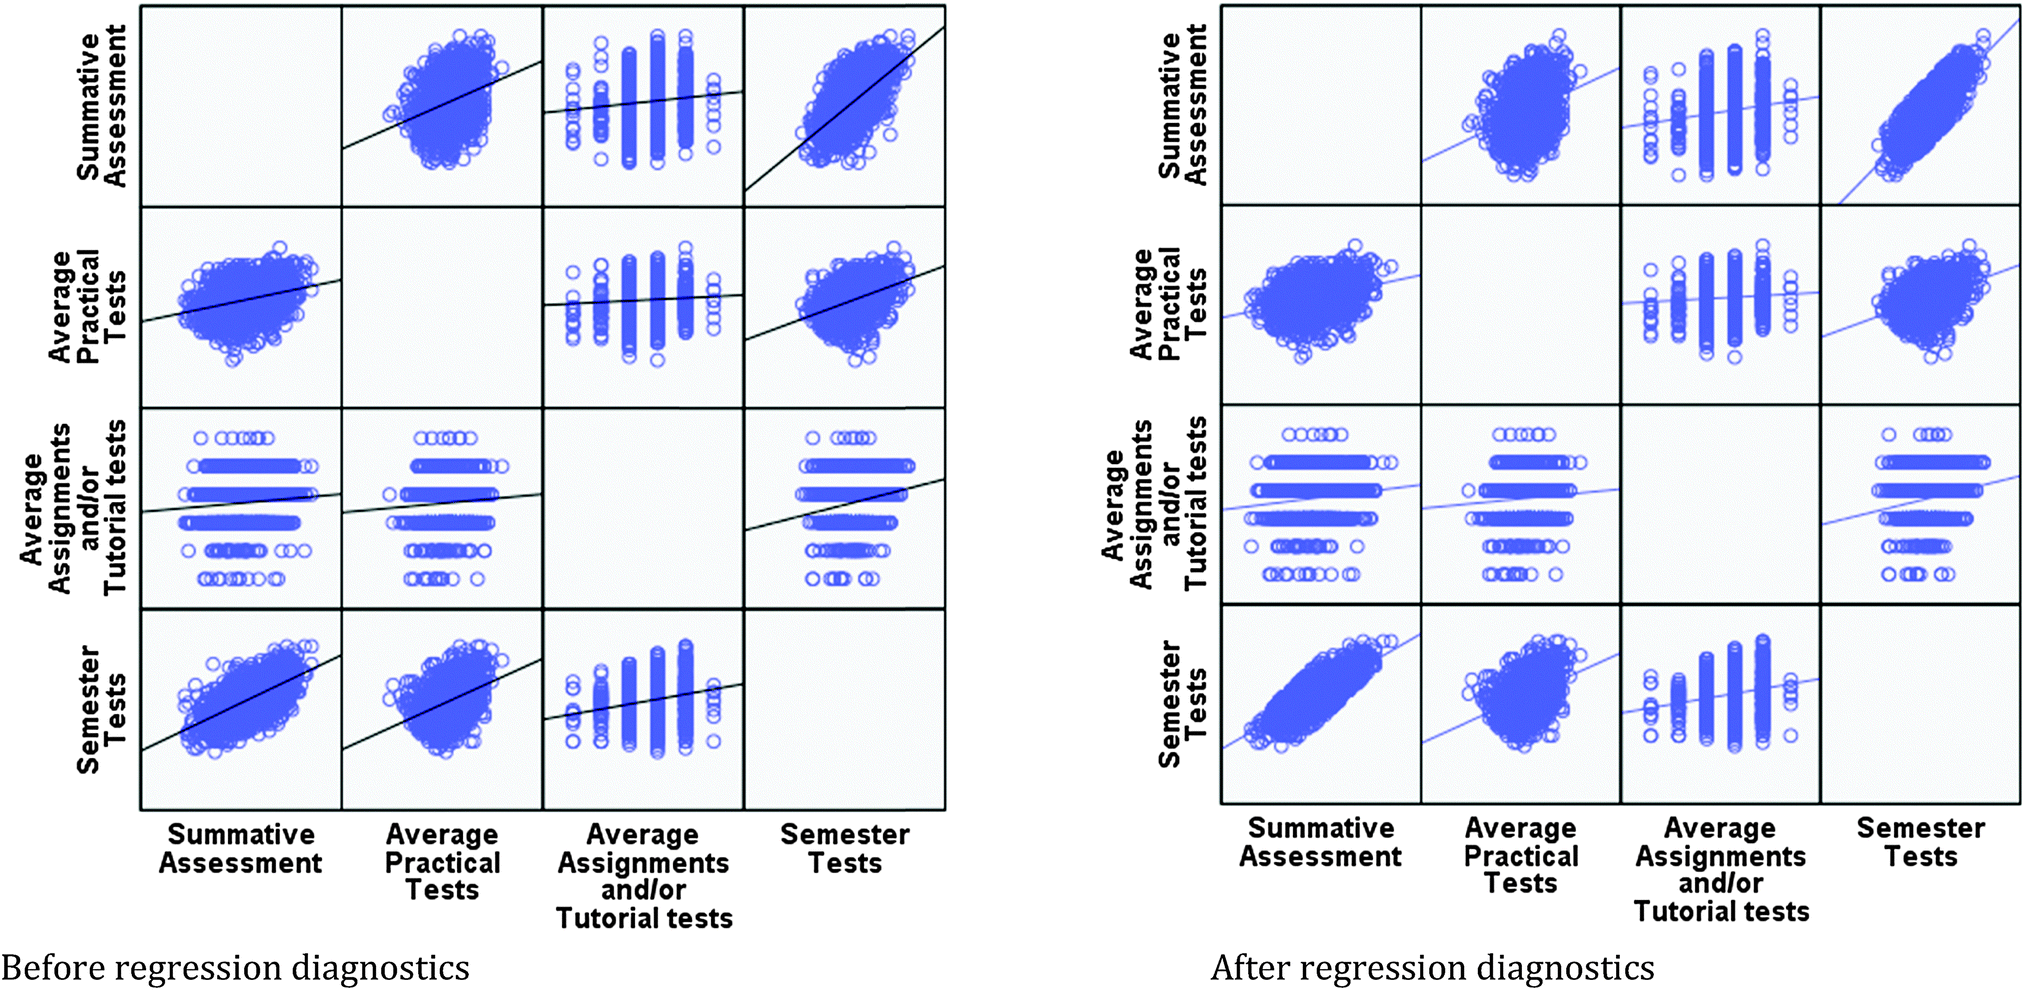 | ||
| Fig. 4 Matrix Scatterplot of SA by AVRPT, AVRATT and AVRSEMT. | ||
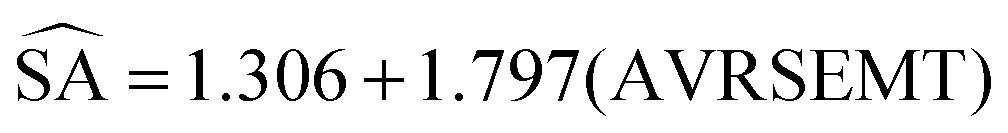
Remember that theory is the summation of AVRSEMT and AVRATT. After the use of three predictor variables in the dataset of G3 and performing the regression diagnostics (which left the dataset of G3 with 1316 observations) the model contained only one significant variables (AVRSEMT) with a multiple R of 0.771. This part of the analysis also used the stepwise procedure in the MLR analysis technique; hence the R2 of 0.594, suggesting that the accuracy of predicting scores for the students' SA marks will be approximately 59.4% if the prediction is based on scores for AVRSEMT only. The coefficient of 1.797 for AVRSEMT mark means that for every additional one mark on the AVRSEMT mark, the SA mark will increase by 1.797 when the AVRATT mark is held constant. It was also observed that the coefficient of the AVRATT and AVRPT are not significantly different from zero at 95% confidence level, implying that the two variables should be removed from the model. The final model (prediction function) that can be used to predict the SA at approximately 59.4% accuracy is eqn (3), where AVRSEMT cannot exceed 45% (Tables 9 and 10):
 | (3) |
| Model | R | R square | Adjusted R square | Std. error of the estimate |
|---|---|---|---|---|
| Model 3 of G3 | 0.771 | 0.594 | 0.594 | 7.554 |
| Model 3 of G3 | Unstandardized coefficients | Standardized coefficients | t | Sig. | |
|---|---|---|---|---|---|
| B | Std. error | Beta | |||
| Constant | 1.306 | 0.952 | 1.372 | 0.170 | |
| AVRSEMT | 1.797 | 0.041 | 0.771 | 43.876 | 0.000 |
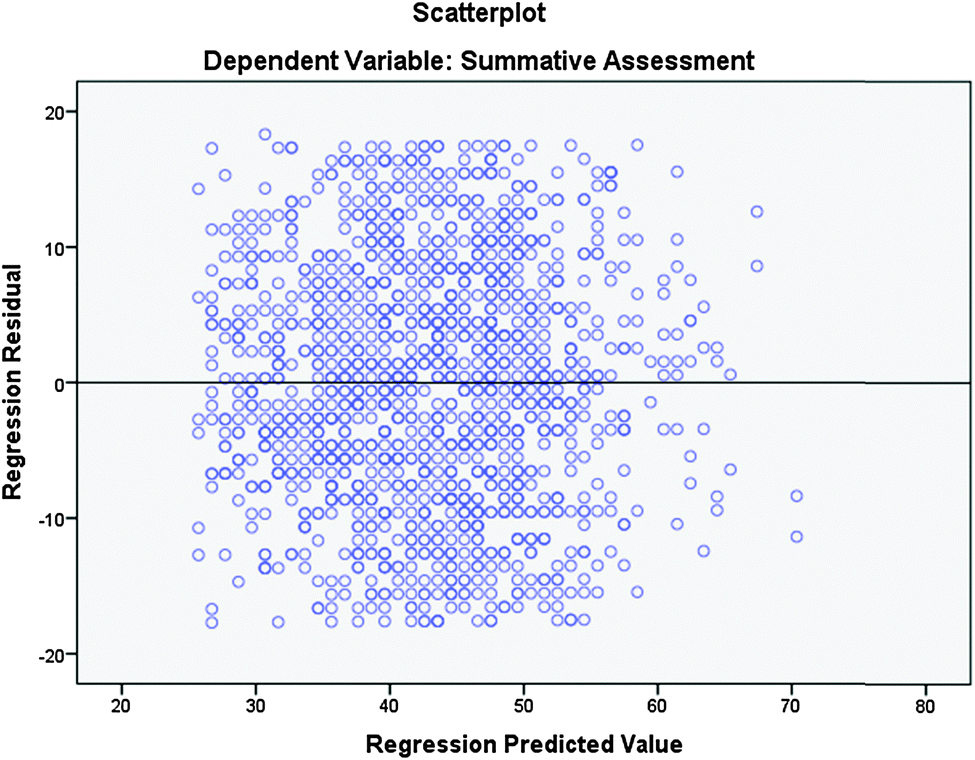
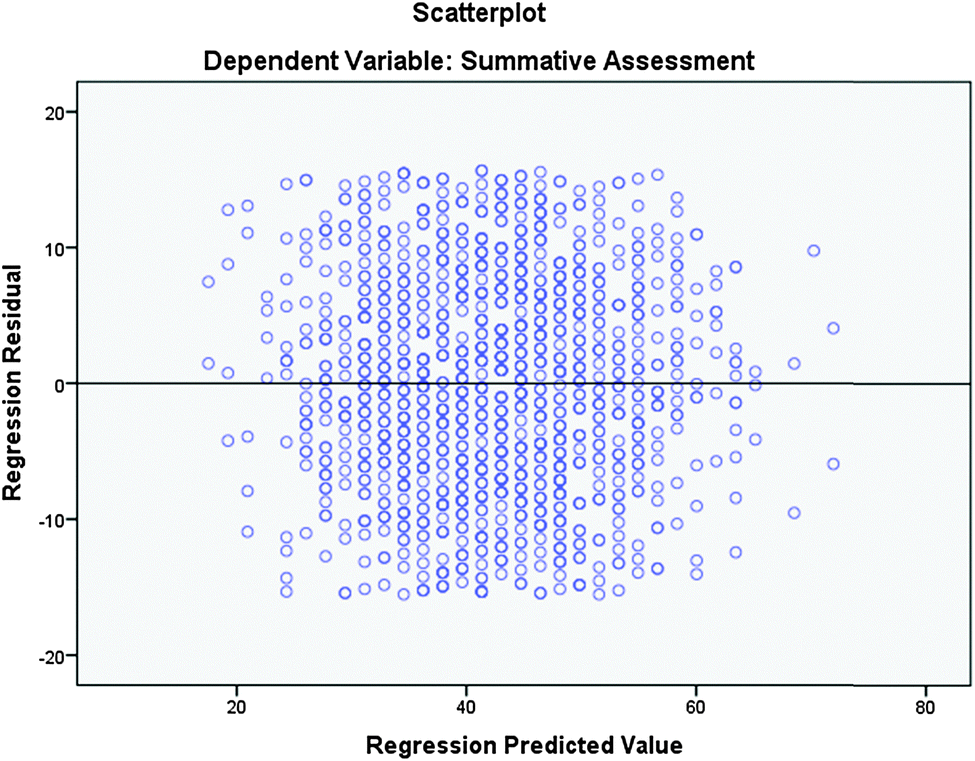
In Fig. 5–7, the scatterplot of regression residuals and regression predicted value, show to have a rectangular pattern that deduce a symmetrical pattern and that have a constant spread throughout the range. It is also observed that there is not much difference between the points on the scatterplot; however this might mean that the best model in this case is Model 3 of G3 since it has the highest R2 = 0.594.
 | ||
| Fig. 5 Residual plot for Model 1 of G1. | ||
 | ||
| Fig. 6 Residual plot for Model 2 of G2. | ||
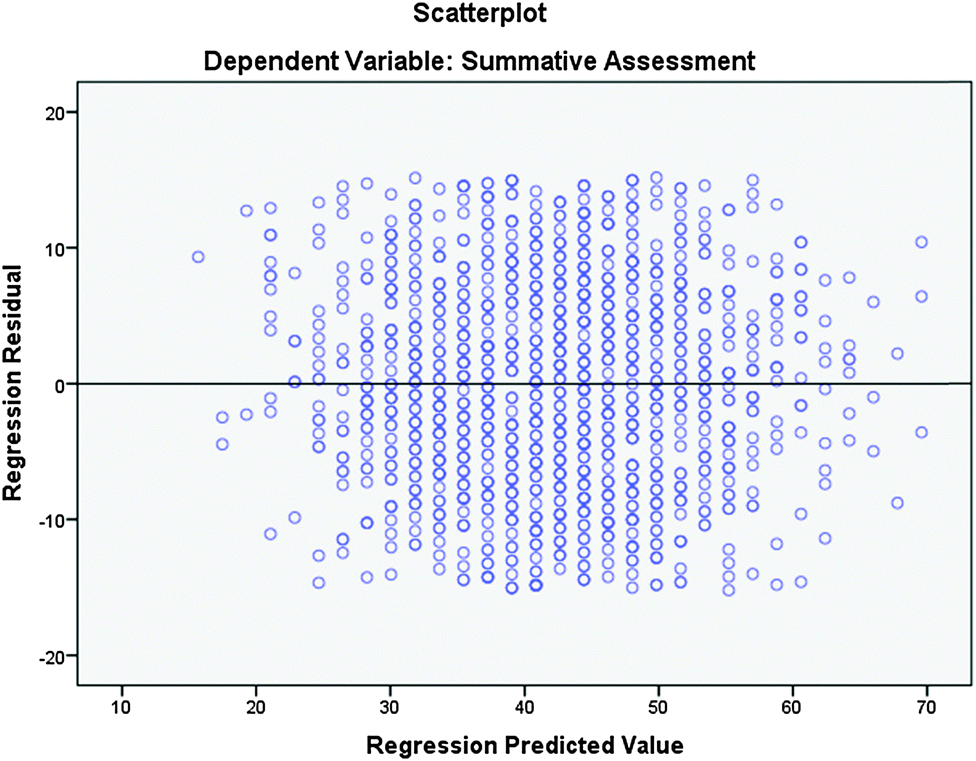 | ||
| Fig. 7 Residual plot for Model 3 of G3. | ||
5.3 Probability analysis
Probability is one other interesting analysis that has been a subject of discourse amongst philosophers, logicians, mathematicians, statisticians, physicists, and psychologists for many years (Bartoszynsk and Niewiadomska-Buga, 2007). Some scholars (see for instance, Ghahramani, 2005) insinuated that probability is a number between 0 and 1 that is associated with an event that is intended to represent its chance of occurring. Conditional probability is referred to as the probability of one event if another event occurred. In this study it is denoted by P(Results status/population of interest), where results status can be either fail (F), supplementary (S), pass (P) or pass with distinction (PD). The population of interest was obtained by categorising the students into Category 1 (C1) of 1519 students who have obtained FA ≥ 40%; Category 2 (C2) of 277 students who have obtained 40% ≤ FA ≤ 49%; Category 3 (C3) of 1208 students who have obtained 50% ≤ FA ≤ 74%; and Category 4 (C4) with 34 students who have obtained FA ≥ 75%.The results reveal that the chances of a student to failing; supplementing; passing and passing with distinction given that the student has qualified to sit for SA, is 0.24; 0.25; 0.5 and 0.01, respectively out of 1. It has also exposed that approximately half of the students who have obtained FA ≥ 40% have a chance of passing the module.
The results indicated that, when given that a student falls in C2 the probability of the student passing are 0.22 out of 1; proposing high chances (0.82 out of 1) of failing the module; P(S/C2) = 0.16; and surprisingly P(PD/C2) is zero out of 1. The students in C2 obtained the same or even lower SA marks when compared with the FA marks. Given that a student has obtained formative mark between 50% and 74% the probability of the student passing is 0.6, and this leaves more than quarter chances (0.4) of the remaining students from C3 to sit for supplementary or fail. The students falling in C4 have approximately 0.24 chances out of 1 to maintain a distinction final mark; of course, this also shows that the student from C4 has no chance of failing the module.
6. Discussion (and implications)
This study lends support to Harlen's findings (2005), namely that there is need for “synergy between formative and summative assessment requires that systems should be designed with these two purposes in mind and should include arrangements for using evidence for both purposes”. The study has confirmed that, to a certain extent, formative assessment does predict summative assessment. The fact that the majority of those who entered summative assessment with formative assessment marks of at least 50% passed the summative assessment, this department of chemistry has every reason to invest resources in their first-year chemistry students to assist them get at least 50% as a formative mark because them they know such students will pass the module.6.1 Discussion and implications based on the designed models
Model diagnostics methods were performed with some outlying observations detected, which were then removed from the data and the models were then fitted. All three models were found to be adequate and the best model, that is, Model 3 of G3, was chosen based on the prediction accuracy.• When using only FA marks as a predictor variable for SA marks, the FA marks was found to be significant at 0.05 confidence level with an R2 of 0.454, and a positive coefficient; hence Model 2 of G2 has prediction accuracy of 57.1%. Model 1 of G1 suggests that formative marks of students can indeed be used to predict the summative marks of students, taking in to account that the prediction accuracy is 45.6%. However, a prediction accuracy of 45.6% is not satisfactory enough for the department to rely on.
• When using both theory marks and practicals mark as predictor variables for SA marks, only theory marks were found to be significant at 0.05 confidence level with an R2 of 0.571, and a positive coefficient; hence Model 2 of G2 has prediction accuracy of 57.1%. In this particular model theory marks contribute 50% of the FA mark; a greater concern is on the rejected variable, average practicals marks which contribute similar weight as the theory mark. A weak relationship explored between the average practicals marks and SA marks points to the fact that summative assessments do not include module material that is done during practicals classes – and accordingly average practicals marks should not be used to predict SA marks of students in a 1st year chemistry class.
• When using both average semester test marks, average assignments and/or tutorial tests and practicals mark as predictor variables for SA marks, Only average semester test marks was found to be significant at 0.05 confidence level with an R2 of 0.594 and a positive coefficient; hence Model 3 of G3 has prediction accuracy of 59.4%. Based on the same reason why average practicals marks should not be used to predict the in Model 2 of G2, Model 3 of G3 indicates that only average semester tests marks can be used to predict SA marks of students in a 1st year chemistry class with nearly 60% level of accuracy.
It is certainly clear that Model 3 of G3 is the best model than the other two to use in predicting the SA marks of students in a 1st year chemistry class.
6.2 Discussion and implications based on the probability analysis
This analysis was performed in order to know students' chances of obtaining different results status given the category (based on FA mark) where the student falls.Students with a formative mark between 40% and 49% (inclusive) are highly likely, P(F/C2) = 0.82, to fail the module; hence the department of chemistry should consider arranging extra tutorials or providing assistance to students at risk or even other student interested during the study week. This might also reduce the chances of supplementary in C2 and C3. A continuation of a 0.22![[thin space (1/6-em)]](https://www.rsc.org/images/entities/char_2009.gif) :1 ratio for a student in C2 to pass the module, might lead to a determination of setting a minimum mark out of 100% for student to qualify to write summative assessment to 50%.
:1 ratio for a student in C2 to pass the module, might lead to a determination of setting a minimum mark out of 100% for student to qualify to write summative assessment to 50%.
6.3 Conclusion
The findings have important implications for heads of department, and directors of school; even more so, it can be useful to individual course instructors and students. However, the study implicitly questions the standard that the lecturers apply during FA against that used during SA. In view of the theoretical framework followed in the study, the authors are concerned that there did not seem to have any assessment feedback in any of the tests (theory and practicals) administered – which begs the question: what is the lecturers' understanding of formative assessment? Inevitably these questions need further investigation if the faculty in which these modules are administered wishes to intervene and improve the students' performance. The department has a responsibility to advocate for a balance between assessment of learning and assessment for learning – both of which require assessment feedback strategy if students are to benefit from any form of assessment and for the department to be confident that its academic offerings make the desired impact.References
- Bartoszynsk R. and Niewiadomska-Buga M., (2007), Probability and Statistical Inference, 2nd edn, New Jersey: John Wiley & Sons.
- Biggs J. and Tang C., (2011), Teaching for Quality Learning at University, 4th edn, New York: Two Penn Plaza.
- Black P. and William D., (1998), Inside the Black Box: Raising Standards Through Classroom assessment, Phi Delta Kappan, 139–148.
- Black P., Harrison C., Lee C., Marshall B. and William D., (2004), Assessment for Learning in the Classroom, Phi Delta Kappan, 86(1), 8–21.
- Crumrine T. and Demers C., (2007), Formative assessment: Redirecting the plan, Sci. Teach., 74(6), 64–68.
- Garrison C. and Ehringhaus M., (2007), Formative and Summative Assessments in the Classroom, Association for Middle Level Education, August 2013.
- Ghahramani S., (2005), Fundamentals of Probability with Stochastic Processes, 3rd edn, London: Pearson Education.
- Graybill A. F. and Iyer K. H., (1994), Regression Analysis: Concepts and Applications, 1st edn, Duxbury Pr.
- Harlen W., (2005), Teachers' summative practices and assessment for learning – tensions and synergies, Curriculum J., 16(2), 207–223.
- Ho R., (2006), Handbook of Univariate and Multivariate Data Analysis and Interpretation with SPSS, Boca Raton: Taylor & Francis Group.
- IDRE, (2005), Institute for Digital Research and Education, Statistics, University of California, http://www.ats.ucla.edu/stat/spss/webbooks/reg/chapter2/spssreg2.htm, accessed 11 December 2013.
- Matilde B., Paola M., Domenico P. and Luigi S., (2009), Statistical Methods for the Evaluation of Educational Services and Quality of Products, London: Springer.
- Osado A. G., Sánchez-Barba Merlo L. F. and Honrado Díaz del Campo M., (2013), Formative Assessment in Chemistry Course through feedback and feed-forward strategies, Proceedings of the 7th International Technology, Education and Development Conference, pp. 3852–3860.
- Schwab A. J., (2007), Course Materials. http://www.utexas.edu/courses/schwab/, accessed 1 June 2013.
- Sorenson P., (2000), Drowning in numbers? The need for formative assessment, in Sears J. and Sorenson P. (ed.), Issues in science teaching, London: Routledge Falmer, pp. 123–132.
- Taber K. S., (2003), Examining structure and context – questioning the nature and purpose of summative assessment, Sch. Sci. Rev., 85(311), 35–41.
- Taras M., (2005), Assessment – summative and formative – some theoretical reflections, Brit. J. Educ. Stud., 55(4), 466–478.
- Ussher B. and Earl K., (2010), ‘Summative’ and ‘Formative’: Confused by the Assessment Terms? New Zeal. J. Teach. Work, 7(1), 53–63.
Footnotes |
| † A subminimum is the least mark a student needs to obtain in the summative assessment, in addition to the minimum 50% required as a final examination mark, to be considered to have passed the module. |
| ‡ A traditional university (in South Africa) is one which offers theoretically-oriented university degrees. |
| § Observation is said to be influential if removing the observation substantially changes the estimate of coefficients. |
| This journal is © The Royal Society of Chemistry 2014 |