3D nitrogen-doped graphene/Co(OH)2-nanoplate composites for high-performance electrochemical pseudocapacitors

Hao Xie , Shaochun Tang*, Zilun Gong, Sascha Vongehr, Fei Fang, Min Li and Xiangkang Meng*
National Laboratory of Solid State Microstructures, College of Engineering and Applied Sciences, Institute of Materials Engineering, Nanjing University, Jiangsu, People's Republic of China. E-mail: tangsc@nju.edu.cn; mengxk@nju.edu.cn; Fax: +86 25 8359 5535; Tel: +86 25 8368 5585

Received 12th September 2014 , Accepted 3rd November 2014

First published on 3rd November 2014


Abstract

We report a simple hydrothermal synthesis of nanocomposites, constructed by 3D nitrogen-doped graphene (NG) networks with hexagonal Co(OH)2 nanoplates, which are optimized for applications as electrochemical pseudocapacitor materials. Single-crystalline Co(OH)2 plates are distributed homogeneously inside the conductive interconnected NG networks. The 71% Co(OH)2 weight content achieves a capacitance of 952 F g−1 at 1.0 A g−1, more than triple that of the pure NG and nearly four times that of Co(OH)2 plates; moreover, this value exceeds the recently reported values for 2D graphene/Co(OH)2 composites. Capacitance retention over 2000 cycles is still high as 95%. The improvements are attributed to the regular morphology of Co(OH)2 and the 3D porosity, which prevents the stacking of the Co(OH)2 plates as well as the composite, and the continuously connected pores and highly conductive NG networks, which facilitate electron and ion transport.

1. Introduction

The development of clean and efficient energy storage is urgent to address the rapidly increasing global energy needs with alternative energy.1 Supercapacitors are attractive due to their fast charging capability, high power density, and long cycle life.2,3 Transition metal oxides4–6 and hydroxides7–9 are the most promising electrode materials due to their high pseudo-capacitance, low-cost, and environmental compatibility. Among them, Co(OH)2 has a high theoretical capacitance (3460 F g−1), and the practical electrochemical performance depends considerably on the shape of the material's particles. Co(OH)2 nanostructures with regular shapes such as rods,10 needles,11 sheets,12 and flowers8 perform better than irregular ones. However, the pseudocapacitors based on such materials rely on faradaic redox reactions, and the active electrode materials are typically extremely insulating to support the fast electron transport required by high charging rates.13 An enhancement of performances via a combination with conductive materials is thus highly desired.

Graphene (G) is a flexible single-atom layer with a large specific surface area and high electrical conductivity.14,15 It is a promising supercapacitor electrode material, and has been demonstrated to be an ideal matrix for functional nanomaterials to improve the electrochemical performance.16,17 For example, the G/MnO2 composite exhibits a high capacitance even at fast charging rates and an energy density of 51 W h kg−1.18 2D G/Co(OH)2 with a specific capacitance of 972.5 F g−1 at 0.5 A g−1 was prepared by one-step refluxing.19 A simple and rapid one-pot process for synthesizing reduced graphene oxide/Co(OH)2 also led to enhanced electrochemical properties for supercapacitors.20 G/Co(OH)2, as a high performance anode material for lithium batteries, was prepared through a one-step hydrothermal method.21 Little work, however, has been focused on composite nanostructures with regularly shaped Co(OH)2. Co(OH)2 and Ni(OH)2 nanoplates on G-sheets exhibit 436 F g−1 (ref. 22) and 953 F g−1 (ref. 23), respectively, even at high current densities of around 50 A g−1, while retaining excellent cycling behaviours. The stacking of such 2D structures lowers the specific surface area. Although the 2D G/Co(OH)2 composites avoid the stacking of Co(OH)2 nanoplates and show a superior electrochemical performance, all these products are still mainly 2D graphene, and therefore the stacking of the composite is not avoided. Macroscopic G networks have their nanosheets folded into 3D architectures with a high specific surface area, suitable nano- or micropores and network-like connection.24,25 The sheets do not stack but still connect with each other, resulting in a conducting network for fast, multi-dimensional electron transport between the active materials and the charge collector, as well as ion transport through the pore network.26,27 In addition, nitrogen-doping enhances the electrochemical properties of graphene-based electrode materials significantly, because an incorporation of the heteroatom N can improve the electronic conductivity.28–30

Here, an advanced integrated composite material is designed by combining 3D N-doped graphene (NG) with hexagonal Co(OH)2 nanoplates, and synthesized via a simple hydrothermal method. Developing the procedure involved optimizing parameters such as graphene oxide (GO) precursor concentration and Co(OH)2 content, which were independently optimized while aiming for high porosity and high capacity, respectively. The Co(OH)2 rather stands randomly in the 3D networks than lying on the NG sheets, thus further increasing the specific surface area. Thus, these NG/Co(OH)2 composites exhibit a better pseudocapacitive performance than the previously reported Co(OH)2 and 2D G/Co(OH)2 composites. The capacitance retention is still 95% after 2000 cycles.

2. Experimental section

2.1 Synthesis of NG/Co(OH)2 composites

In the typical synthesis, a solution containing 0.04 M CoCl2·6H2O, 0.2 M C6H5Na3O7·2H2O, 0.15 M NaH2PO4·H2O, and 0.2 M NaOH was prepared by dissolving them one after another into 100 ml deionized water. The purple mixture was stirred in a 50 °C water bath for 30 min. 10 ml of the resulting grey solution was added into 40 ml of 2 mg ml−1 GO suspension, which can be synthesized by a modified Hummers method as described in the ESI. 500 μl of ethylenediamine was added under magnetic stirring for 15 min. The mixture was transferred to a 100 ml Teflon-lined autoclave. The hydrothermal reaction at 160 °C proceeded for 12 h. The products were purified by centrifugation from deionized water and dried in a freeze dryer for 7 h. For comparison, pure 3D porous GN networks and Co(OH)2 nanoplates were also prepared by nearly the same procedure but in the absence of undesired chemicals, i.e., the synthesis of NG used 50 ml of the GO suspension.

2.2 Characterizations

The products were characterized by X-ray diffraction (XRD) with a D/Max-RA X-ray diffractometer (Cu Kα = 1.5418 Å radiation) at 2° min−1. The valence states of elements were examined by X-ray photoelectron spectroscopy (XPS) in a Thermo VG Scientific MultiLab ESCA2000 system with a CLAM4 hemispherical analyzer at a base pressure below 3 × 10⁻¹⁰ mbar. The morphology and sizes of the products were analyzed by field-emission scanning electron microscopy (FE-SEM) on S-4800 (Hitachi) at 10 kV, and transmission electron microscopy (TEM), and selected area electron diffraction (SAED) on a JEM-2100 (JEOL) at an acceleration voltage of 200 kV. Energy dispersed X-ray spectroscopy (EDS) was performed on the same FE-SEM microscope. Fourier transform infrared (FTIR) spectra of KBr powder pressed pellets were recorded with a Varian 3100 FTIR spectrometer. Thermogravimetric analysis (TGA) was performed on a TGA/SDTA thermogravimetric analyzer from room temperature (r.t.) to 800 °C in air at a heating rate of 20 °C min−1.

2.3 Electrochemical measurements

The working electrodes were prepared by grinding the active materials, acetylene black and polytetrafluoroethylene (mass ratio 7[thin space (1/6-em)]:[thin space (1/6-em)]2[thin space (1/6-em)]:[thin space (1/6-em)]1). Then, the mixture was rolled into a film and pressed with 10 MPa onto the Ni foam. The effective area of the working electrode was 1 cm2, and the mass loading of the active material was about 2 mg. The measurements were performed at room temperature on a Metrohm Autolab 302N electrochemical workstation in a three-electrode system with a platinum foil counter electrode and an Ag/AgCl reference. The electrolyte used was 6 M KOH. Cyclic voltammetry (CV) scans were recorded from 0 to 0.5 V (vs. Ag/AgCl) at various scan rates. Specific capacitance was established via the integral under the CV curve calculated by the software using the formula SC = ∫idV/(2νmΔV), where ν is the scan rate, m the mass of the active material, and ΔV is the operating potential range. Galvanostatic charge–discharge (CD) cycle tests were carried out in the range of 0–0.3 V at various current densities. Capacitance retention was tested on a Land Battery Test System (Wuhan Kingnuo Electronic Company, China). The anode was the same as the above described working electrode, and the cathode was blank nickel foam. The current density and potential windows were the same as those in the galvanostatic measurements. The capacitance retention of a cycle equals its discharge time divided by the discharge time of the first cycle. In the electrical impedance spectroscopy (EIS) measurements, the AC amplitude was 5 mV, and the frequency ranged from 105 to 0.1 Hz.

3. Results and discussion

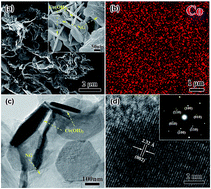
In order to obtain 3D NG networks, the concentration of the GO suspension in the reactions from GO to NG was optimized to achieve the recommended value (2 mg ml−1). The pure NG network is continuously connected (Fig. S1a). During the hydrothermal synthesis of the NG/Co(OH)2 composites, mixed solutions containing chemicals, necessary for both the Co(OH)2 nanoplates and the NG, were used. Fig. 1a shows an SEM image of the NG/Co(OH)2 obtained from a typical synthesis. The resulting 3D NG network in the NG/Co(OH)2 composite is not changed excessively. The composite has a 3D porous structure, with the NG also continuously connected. From the higher magnification (inset of Fig. 1a) of a particularly dense region of the Co(OH)2 nanoplates, it can be seen that they do not stack, but their presence makes a finer porous structure. Compared to pure Co(OH)2 nanoplates (Fig. S1b–d), the plates in the composite retain the hexagonal morphology, and their stacking is avoided. The edge lengths of hexagons are roughly 175 nm. They are about 10–15 nm thick. EDS elemental mapping of Co (Fig. 1b) reveals that the hexagons are homogeneously distributed throughout the composite. The TEM image (Fig. 1c) confirms that the plates are well-dispersed and randomly distributed. The lattice fringes visible in the HRTEM image (Fig. 1d), recorded from an edge of an individual Co(OH)2 plate, show that it is a single crystal. The inter-planar distance is measured to be 2.32 Å, which corresponds to the (002) planes of Co(OH)2. The SAED pattern (the inset) recorded from a single plate confirms its single-crystalline nature.
image file: c4ra10333e-f1.tif
Fig. 1 (a) SEM, (b) EDS-mapping of Co, and (c) TEM images of the typical NG/Co(OH)2 composite, and (d) a HRTEM of the Co(OH)2 hexagons. The inset of (a) magnifies a particularly dense accumulation of nanoplates in the 3D NG; and the inset of (d) is a SAED pattern recorded from a hexagon.

Fig. 2 shows the XRD patterns of pure NG (black curve), Co(OH)2 (magenta curve), and the NG/Co(OH)2 composites with Co(OH)2 contents of 54.5 wt% and 92.6 wt%. In the XRD pattern (blue curve) of the typical NG/Co(OH)2 composite, most of the diffraction peaks correspond to the crystal planes of brucite-like Co(OH)2 (JCPDS 30-0443). A broad and weak diffraction (marked by a green dashed circle) is observed at about 26.4° and assigned to be the (002) of graphene. The inter-layer spacing is calculated to be 3.42 Å, which is much lower than that of the precursor GO (8.02 Å), but slightly higher than that of natural graphite (3.37 Å).31 The characteristic GO peak at 11.03° (Fig. S2a) is not visible, indicating the complete conversion to graphene. No peaks from other phases are present. On increasing the Co(OH)2 content, the graphene signal in the XRD patterns weakens, while the Co(OH)2 peaks become stronger. The peak of graphene is not clearly identified at a high content of 92.6 wt%, which is due to the fact that the graphene signals are masked by Co(OH)2. The FTIR spectra (Fig. S2b and S3) and XPS analysis (Fig. S4) prove the presence of Co(OH)2, doping of N into the carbon matrix, as well as confirm the complete conversion of GO, which are all discussed in detail in the ESI.


image file: c4ra10333e-f2.tif
Fig. 2 XRD patterns of pure NG (black curve), Co(OH)2 (magenta curve), and the NG/Co(OH)2 composites with different Co(OH)2 contents.

TGA analysis was used in order to determine the Co(OH)2 content in the composites, which is controlled via the Co2+ concentration. The TGA curve (Fig. 3) of the typical composite shows an initial mass loss (stage I) due to the evaporation of water. The mass loss in stage II from 180 °C to the inflection point at 300 °C results from the dehydration of Co(OH)2 into Co3O4.32 The subsequent loss until 450 °C (stage III) results from the combustion of NG.22 The Co(OH)2 content in this composite is thus calculated to be 71.3 wt% of the dry NG/Co(OH)2 product (after stage I), namely according to the stage II loss, which is consistent with that based on the final remaining Co3O4.


image file: c4ra10333e-f3.tif
Fig. 3 TGA curve of the typical NG/Co(OH)2 composite recorded from room temperature to 800 °C.

The electrochemical performance of the NG/Co(OH)2 composites is highly dependent on the Co(OH)2 content. Fig. 4 shows the average capacitances of NG/Co(OH)2 composites with different Co(OH)2 contents, including 0 wt% (pure NG), low, optimal, high, and 100 wt% being for a sample of pure hexagonal nanoplates, all measured at various discharge current densities (nine samples with different contents were investigated). Moreover, the electrochemical performance of a physical mixture of NG and Co(OH)2 with 54.5 wt% Co(OH)2 was measured. The capacitance values of the NG/Co(OH)2 are all higher than those of pure NG, Co(OH)2 nanoplates and their physical mixture. All the capacitances decrease similarly with the current density; especially, the initial slightly lower slope at low Co(OH)2 contents may indicate the higher electrical conductivity due to NG. At the same Co(OH)2 percentage of 54.5 wt%, the specific capacitances of the NG/Co(OH)2 are all about 1.5 times higher than those of the mixture (comparing the black curve with the dark yellow one). At current densities higher than 4 A g−1, the decreasing rate of the physical mixture's capacitance with an increase in current density is faster than that of the NG/Co(OH)2. This is because simple physical mixing leads to a stacking of plates. The capacitance is maximal for 71.3 wt% Co(OH)2. Below that value, the content of active Co(OH)2 is not optimized; above that value, the Co(OH)2 plates become too numerous and start to stack together again, leading to a decreased electrochemical activity. The capacitance of the optimal NG/Co(OH)2 composite reaches 952.4 F g−1 at a current density of 1.0 A g−1, which is nearly four times that of bare Co(OH)2 nanoplates (250.0 F g−1) and NG networks (283.3 F g−1). It exceeds the recently reported values of 474 F g−1 (ref. 20) and 642.5 F g−1 (ref. 33) (all at 1.0 A g−1) for reduced graphene oxide/Co(OH)2 and Co(OH)2-nanowires/graphite composites, respectively. At 2.0 A g−1, the specific capacitance of our NG/Co(OH)2 is 847.5 F g−1, which is higher than those of the Co(OH)2/2D graphene sheet-on-sheet hybrid (622 F g−1)22 and the Co(OH)2 nanoflakes grown on ultrastable Y zeolite (650 F g−1).34 Furthermore, it is higher than that of Co(OH)2/graphene/Ni foam (693.8 F g−1) synthesized by radio-frequency plasma enhanced chemical vapor deposition.35 The superior performances may be due to the regular morphology of the Co(OH)2 particles, N-doping of G, and the 3D porosity, which prevents the stacking of the Co(OH)2 plates and the composite, as well as the optimized accessible large specific surface area and the hierarchical composite architecture. The capacity is still 686.2 F g−1 at ten times the current density, indicating a high 72% capacitance retention. The continuously connected pores and highly conductive NG networks facilitate electron and ion transport.36 Moreover, a synergistic effect between the different components of NG and Co(OH)2 plays a key role.


image file: c4ra10333e-f4.tif
Fig. 4 Specific capacitances of the NG/Co(OH)2 composites with different Co(OH)2 contents at various charge–discharge current densities. A physical mixture of NG and Co(OH)2 with 54.5 wt% Co(OH)2 is also provided for comparison.

The synergistic effect between NG and Co(OH)2 is suggested as follows: (1) both NG and Co(OH)2 are positive pseudo-capacitance materials,8,28–30 and can contribute to the capacitances of the hydrothermally synthesized NG/Co(OH)2 composites. The synergistic effect improves the capacitance, higher than each of them. (2) Combining NG and Co(OH)2 into composites during a hydrothermal reaction significantly improves the supercapacitive performance, which cannot be achieved by physical mixing or by adjusting the morphology and structure of pure NG and Co(OH)2. The synergy is similar to that in the hybrids of graphene and metal hydroxides.22,23 (3) The specific capacitance of NG/Co(OH)2 does not increase monotonously, but is optimized to be maximal at a Co(OH)2 percentage of 71.3 wt%. This indicates that the electrochemical performance of the NG/Co(OH)2 composites is highly composition-dependent, and is a reflection about the synergistic effect between them.

Fig. 5a shows the CV curves of the optimal NG/Co(OH)2 composite at scan rates from 5 to 100 mV s−1. The redox current peaks are attributed to the reversible reaction Co2+ ↔ Co4+, which results in a pseudocapacitive shape.37 Fig. 5b shows the corresponding specific capacitance values. The capacitance is still 475.6 F g−1 even at a high scan rate of 100 mV s−1, which is 64% of the capacity at 5 mV s−1 (740.4 F g−1). The improved rate performance can be attributed to the fact that a high specific surface area is favorable for the fast migration of OH ions in the electrolyte to the surface of both the Co(OH)2 sheets and NG. Fig. 5c shows the CD characteristics in a potential range of 0–0.4 V at various specific current densities. The shape of the curves indicates that the materials have a reversible charge–discharge capacitance. The galvanostatic discharge time at 1.0 A g−1 is up to 90 seconds, indicating a high capacitance, which is consistent with the CV results. To further understand the electrochemical performance characteristics, the EIS of the optimal NG/Co(OH)2 composite was analyzed using Nyquist plots. Fig. 5d shows the EIS of pure NG, Co(OH)2, and NG/Co(OH)2 composites with Co(OH)2 contents of 54.5, 71.3 and 92.6 wt%. Evidently, the EIS plot contains a partially overlapped semicircle and a straight sloping line. The semicircle at high frequencies is associated with faradaic charge-transfer resistance. The almost vertical line in the low frequency region is indicative of the rapid ion transport, which the porosity allows between the electrode and electrolyte, as well as through the latter.38 Through a fitting analysis of the Nyquist plot, the related Rct (see inset equivalent circuit) of the optimal NG/Co(OH)2 composite has the lowest value of 1.2 Ω. W is the Warburg impedance (the slope of the curves at a low frequency), and Rb is the bulk resistance of the electrochemical system, indicating the conductivity of the electrolyte and internal resistance of the electrode. The Rb values are determined by the point, where the semicircle intersects with the Z′ axis. The Rb values of the pure NG, Co(OH)2, 54.5 wt%, 71.3 wt%, and 92.6 wt% composites are 0.5 Ω, 0.8 Ω, 0.38 Ω, 0.42 Ω and 0.59 Ω, respectively. The optimal NG/Co(OH)2 composite has the lowest Rb value, which is consistent with that of specific capacitances. The low values of Rb and Rct are observed, because graphene is cross-linked by N to form a 3D network with an excellent conductivity, and the structure design prevents the staking of NG and plates.


image file: c4ra10333e-f5.tif
Fig. 5 (a) CV curves of the optimal NG/Co(OH)2 composite with 71.3 wt% Co(OH)2 at various scan rates, and (b) corresponding average specific capacitances, (c) galvanostatic charge–discharge curves at various current densities, and (d) EIS curves of pure NG, Co(OH)2, and NG/Co(OH)2 composites with different Co(OH)2 contents. Insets in (d) are the equivalent circuit and a magnified EIS.

The cycling stability was evaluated by repeating the CD test. Fig. 6 shows the capacitance retention for 2000 cycles at a current density of 1.0 A g−1. The inset shows the cycles from 1990 to 2000, revealing a very regular timing. The specific capacitance of the NG/Co(OH)2 electrode stays at 95% of the initial specific capacitance, proving the stable electrochemical properties in the range of 0–0.3 V.


image file: c4ra10333e-f6.tif
Fig. 6 Capacitance retention of the optimal NG/Co(OH)2 composite at 1.0 A g−1 over first 2000 cycles. The inset shows the galvanostatic charge and discharge curves from 1990 to 2000 cycles.

4. Conclusions

A novel 3D N-doped porous graphene network, supporting hexagonal Co(OH)2 nanoplates, has been prepared by a simple hydrothermal synthesis. The plates are distributed homogeneously, and such a structure prevents the staking of the nanoplates and GN. The novel composite exhibits a capacitive performance far better than the pure 3D GN or Co(OH)2 alone. After optimizing the Co(OH)2 content, the new composites show higher specific capacitances than the recently reported values for 2D graphene/Co(OH)2 composites, even at fast charging rates. The NG/Co(OH)2 composites exhibit an excellent capacitance retention of 95% over 2000 cycles. The superior performance is due to the regular morphology of Co(OH)2, the 3D porosity, which prevents the stacking of the Co(OH)2 plates, as well as the hierarchical architecture and highly conductive NG networks, which facilitate electron and ion transport.

Conflict of interest

The authors declare no competing financial interest.

Acknowledgements

The authors kindly acknowledge the joint support by the PAPD, the Fundamental Research Funds for the Central Universities, the National Natural Science Foundation of Jiangsu Province, the National Natural Science Foundation of China and the State Key Program for Basic Research of China.

References

  1. S. W. Lee, N. Yabuuchi, B. M. Gallant, S. Chen, B. S. Kim, P. T. Hammond and Y. Shao-Horn, Nat. Nanotechnol., 2010, 5, 531–537 CrossRef CAS PubMed.
  2. P. Simon and Y. Gogotsi, Nat. Mater., 2008, 7, 845–854 CrossRef CAS PubMed.
  3. J. R. Miller and P. Simon, Science, 2008, 321, 651–652 CrossRef CAS PubMed.
  4. X. Xia, J. Tu, Y. Zhang, X. Wang, C. Gu, X. B. Zhao and H. J. Fan, ACS Nano, 2012, 6, 5531–5538 CrossRef CAS PubMed.
  5. Y. M. Dai, S. C. Tang, S. Vongehr and X. K. Meng, ACS Sustainable Chem. Eng., 2014, 2, 692–698 CrossRef CAS.
  6. Y. Q. Zhang, X. H. Xia, J. P. Tu, Y. J. Mai, S. J. Shi, X. L. Wang and C. D. Gu, J. Power Sources, 2012, 199, 413–417 CrossRef CAS PubMed.
  7. V. Gupta, T. Kusahara, H. Toyama, S. Gupta and N. Miura, Electrochem. Commun., 2007, 9, 2315–2319 CrossRef CAS PubMed.
  8. S. C. Tang, S. Vongehr, Y. G. Wang, L. Chen and X. K. Meng, J. Solid State Chem., 2010, 183, 2166–2173 CrossRef CAS PubMed.
  9. Y. Shen, J. Yin, F. Gao, J. Wang, H. Pang and Q. Lu, Chem. Commun., 2010, 46, 6183–6185 RSC.
  10. J. T. Sampanthar and H. C. Zeng, J. Am. Chem. Soc., 2002, 124, 6668–6675 CrossRef CAS PubMed.
  11. L. Q. Zhang, A. K. Dutta, G. Jarero and P. Stroeve, Langmuir, 2000, 16, 7095–7100 CrossRef CAS.
  12. E. Hosono, S. Fujihara and I. Honma, J. Mater. Chem., 2005, 15, 1938–1945 RSC.
  13. Y. M. Dai, S. C. Tang, J. Q. Peng, H. Y. Chen, Z. X. Ba, Y. J. Ma and X. K. Meng, Mater. Lett., 2014, 130, 107–110 CrossRef CAS PubMed.
  14. D. Wang, D. Choi, J. Li, Z. Yang, Z. Nie, R. Kou, D. Hu, C. Wang, L. V. Saraf, J. Zhang, I. A. Aksay and J. Liu, ACS Nano, 2009, 3, 907–914 CrossRef CAS PubMed.
  15. K. Zhang, L. L. Zhang, X. S. Zhao and J. Wu, Chem. Mater., 2010, 22, 1392–1401 CrossRef CAS.
  16. J. X. Zhu, T. Zhu, X. Z. Zhou, Y. Y. Zhang, X. W. Lou, X. D. Chen, H. Zhang, H. H. Hng and Q. Y. Yan, Nanoscale, 2011, 3, 1084–1089 RSC.
  17. Z. S. Wu, W. C. Ren, L. Wen, L. B. Gao, J. P. Zhao, Z. P. Chen, G. M. Zhou, F. Li and H. M. Cheng, ACS Nano, 2010, 4, 3187–3194 CrossRef CAS PubMed.
  18. Z. Fan, J. Yan, T. Wei, L. Zhi, G. Ning, T. Li and F. Wei, Adv. Funct. Mater., 2011, 21, 2366–2375 CrossRef CAS.
  19. S. Chen, J. W. Zhu and X. Wang, J. Phys. Chem. C, 2010, 114, 11829–11834 CAS.
  20. Z. P. Li, J. Q. Wang, L. Y. Niu, J. F. Sun, P. W. Gong, W. Hong, L. M. Ma and S. G. Yang, J. Power Sources, 2014, 245, 224–231 CrossRef CAS PubMed.
  21. Y. S. He, D. W. Bai, X. W. Yang, J. Chen, X. Z. Liao and Z. F. Ma, Electrochem. Commun., 2010, 12, 570–573 CrossRef CAS PubMed.
  22. C. Y. Sun, Y. G. Zhu, T. J. Zhu, J. Xie, G. S. Cao and X. B. Zhao, J. Solid State Electrochem., 2013, 17, 1159–1165 CrossRef CAS PubMed.
  23. H. Wang, H. S. Casalongue, Y. Liang and H. Dai, J. Am. Chem. Soc., 2010, 132, 7472–7477 CrossRef CAS PubMed.
  24. X. H. Cao, Z. Y. Yin and H. Zhang, Energy Environ. Sci., 2014, 7, 1850–1865 CAS.
  25. Y. N. Meng, Y. Zhao, C. G. Hu, H. H. Cheng, Y. Hu, Z. P. Zhang, G. Q. Shi and L. T. Qu, Adv. Mater., 2013, 25, 2326–2331 CrossRef CAS PubMed.
  26. J. S. Lee, S. I. Kim, J. C. Yoon and J. H. Jang, ACS Nano, 2013, 7, 6047–6055 CrossRef CAS PubMed.
  27. Z. Niu, J. Chen, H. H. Hng, J. Ma and X. Chen, Adv. Mater., 2012, 24, 4144–4150 CrossRef CAS PubMed.
  28. D. W. Wang, Y. G. Min, Y. H. Yu and B. Peng, J. Colloid Interface Sci., 2014, 417, 270–277 CrossRef CAS PubMed.
  29. C. D. Wang, Y. G. Zhou, L. F. He, T. Ng, G. Hong, Q. H. Wu, F. Gao, C. S. Lee and W. J. Zhang, Nanoscale, 2013, 5, 600–605 RSC.
  30. T. Wang, L. X. Wang, D. L. Wu, W. Xia, H. Y. Zhao and D. Z. Jia, J. Mater. Chem. A, 2014, 2, 8352–8361 CAS.
  31. D. S. Genga, S. L. Yang, Y. Zhang, J. L. Yang, J. Liu, R. Y. Li, T. K. Sham, X. L. Sun, S. Y. Ye and S. N. Knights, Appl. Surf. Sci., 2011, 257, 9193–9919 CrossRef PubMed.
  32. C. Nethravathi, C. R. Rajamathi, M. Rajamathi, X. Wang, U. K. Gautam, D. Golberg and Y. Bando, ACS Nano, 2014, 8, 2755–2765 CrossRef CAS PubMed.
  33. J. Jiang, J. P. Liu, R. M. Ding, J. H. Zhu, Y. Y. Li, A. Z. Hu, X. Li and X. T. Huang, ACS Appl. Mater. Interfaces, 2011, 3, 99–103 CAS.
  34. Y. Y. Liang, L. Cao, L. B. Kong and H. L. Li, J. Power Sources, 2004, 136, 197–200 CrossRef CAS PubMed.
  35. C. M. Zhao, X. Wang, S. M. Wang, Y. Y. Wang, Y. X. Zhao and W. T. Zheng, Int. J. Hydrogen Energy, 2012, 37, 11846–11852 CrossRef CAS PubMed.
  36. L. L. Jiang and Z. J. Fan, Nanoscale, 2014, 6, 1922–1945 RSC.
  37. Z. P. Li, J. Q. Wang, L. Y. Niu, J. F. Sun, P. W. Gong, W. Hong, L. M. Ma and S. G. Yang, J. Power Sources, 2014, 245, 224–231 CrossRef CAS PubMed.
  38. L. Wan, J. W. Xiao, F. Xiao and S. Wang, ACS Appl. Mater. Interfaces, 2014, 6, 7735–7742 CAS.

Footnotes

Electronic supplementary information (ESI) available: Experimental details for the synthesis of the GO suspensions, SEM and TEM images of NG and Co(OH)2, XRD patterns of G, GO and NG, FTIR and XPS spectra of NG, GO Co(OH)2, and the NG/Co(OH)2 composites. See DOI: 10.1039/c4ra10333e
Hao Xie and Shaochun Tang contributed equally to this work.

This journal is © The Royal Society of Chemistry 2014
Click here to see how this site uses Cookies. View our privacy policy here.