An electrogenerated chemiluminescent biosensor based on a g-C3N4–hemin nanocomposite and hollow gold nanoparticles for the detection of lactate

Hongmei Chena, Xingrong Tanb, Juanjuan Zhanga, Qiyi Lua, Xin Oua, Yuan Ruo*a and Shihong Chen*a
aEducation Ministry Key Laboratory on Luminescence and Real-Time Analysis, College of Chemistry and Chemical Engineering, Southwest University, Chongqing 400715, China. E-mail: yuanruo@swu.edu.cn; cshong@swu.edu.cn; Fax: +86-23-68253172; Tel: +86-23-68252277
bDepartment of Endocrinology, 9th People's Hospital of Chongqing, Chongqing 400700, China

Received 4th September 2014 , Accepted 11th November 2014

First published on 11th November 2014


Abstract

In this article, a new electrochemiluminescent (ECL) biosensor based on a g-C3N4–hemin nanocomposite and hollow gold nanoparticles (HGNPs) was constructed to detect lactate. Firstly, the g-C3N4 nanosheets were prepared through ultrasonication-assisted liquid exfoliation of bulk g-C3N4, which was obtained through polymerizing melamine under 600 °C. Then, the nanocomposites of g-C3N4 nanosheets and hemin were prepared to modify a glassy carbon electrode. Subsequently, HGNPs were self-assembled onto the electrode for adsorbing lactate oxidase to achieve a lactate biosensor. Due to the excellent catalytic effect of g-C3N4–hemin and HGNPs on the luminol/H2O2 ECL system, the as-prepared biosensor exhibited a good response performance to lactate with a linear range of 1.7 × 10⁻⁸ to 5.0 × 10⁻⁴ M and a detection limit of 5.5 × 10⁻⁹ M. In addition, the prepared ECL biosensor exhibited satisfying reproducibility and stability. The g-C3N4–hemin nanocomposite might have great potential application in a luminol/H2O2 ECL system.

Introduction

Lactate is a product of the anaerobic metabolism of glucose. A high level of lactate in the blood will cause lactate poisoning. What's more, as a biomarker, lactate excreted in blood1 and in sweat2 could be used for monitoring various diseases, such as liver diseases,3 heart failure,1 drug toxicity,4 metabolic disorders,5 and mortality in ventilated infants.6 It is necessary to develop a sensitive, efficient, and reliable method to detect lactate because of the significance of lactate in clinical medicine,7 sports medicine,8 and food industry.9 Many techniques have been used to measure lactate concentration, such as high performance liquid chromatography,10 refractive index detection,11,12 and ultraviolet spectrophotometry.13 However, these techniques have some limitations such as cumbersome process, time consumption or cost effectiveness.

Recently, electrogenerated chemiluminescence (ECL) technique has been widely used in analytical chemistry,14,15 food safety fields,16 and immunoassay.17,18 When ECL technique was used in analytical detection, this analytical method exhibited low detection limit, simple instrumentation, low background signal and high sensitivity. Luminol, as a fluorophoreas, generates strong ECL signals in the presence of hydrogen peroxide (H2O2).19 Most oxidase (glucose oxidase, lactate oxidase, or cholesterol oxidase) would catalyze the oxidation of corresponding substrate to generate H2O2, which can enhance the ECL signals of luminol, thus achieving the detection of corresponding substrates. Currently, biosensors based on lactate oxidase (LOX) have been widely used for the determination of lactate in luminol/H2O2 ECL system. For example, Haghighi and partners fabricated a highly sensitive ECL biosensor using ZnO nanoparticles decorated multiwalled carbon nanotubes for detecting lactate in human blood plasma samples.20

Luminol generates strong ECL signals in alkaline media, and weak ECL signals in physiological pH conditions. However, most of the enzymes have good catalytic effects in physiological pH. This fact would limit the high sensitive detection in this system. Therefore, it needs to look for appropriate materials to catalyze substrate for signal amplification in physiological conditions. Gold nanoparticles (AuNP) have been widely used as catalysts in ECL reactions to enhance the sensitivity and expand new applications of AuNP in biosensor21 and diagnostics22 owing to the unique chemical and physical properties, including their functional versatility,23 biocompatibility,24 and low toxicity.25,26 As a unique shape of AuNP, hollow gold nanospheres (HGNPs) have attracted more attention for their tunable interior and exterior diameters. Compared with AuNP, the hollow structure of HGNPs allow more molecules to adsorb on the inside surface of the walls as well on the outside surface.27 Previous studies have proved that HGNPs are promising for chemical and biological sensing applications.

Recently, a novel metal-free graphite carbon nitride (g-C3N4) has attracted considerable attention and widely used in the fields such as catalysis, degradation and sensor,28–30 owing to the remarkable features including outstanding electronic and catalytic properties, luminescence performance and high thermal and chemical stability. However, the water-solubility of bulk g-C3N4 is poor, which limited its applications in aqueous solution. Fortunately, g-C3N4 nanosheets could broaden the application of g-C3N4 since nanosheets exhibit good water-solubility,31 coordination points to metal ion,32 and superior physicochemical properties, such as shorter photoinduced charger carriers transferring distance and higher surface-area-to-volume ratio. Tian and his co-workers firstly demonstrated that g-C3N4 nanosheets exhibited high electrocatalytic activity toward the reduction of H2O2, and further investigated its application for electrochemical glucose biosensing.33 In addition, the Fe–g-C3N4 hybrids were used to construct a non-enzyme glucose sensor for the determination of glucose with high stability and selectivity.34 All the facts indicated that the g-C3N4 would provide a promising application in the sensing system. However, up to now, to the best of our knowledge, g-C3N4 nanosheets have not been reported in luminol/H2O2 ECL system.

Inspired by above observation, our aim in this work is to integrate the g-C3N4, hemin and HGNPs to achieve a highly sensitive lactate biosensor. Firstly, g-C3N4 nanosheets serve as a carrier to combine with hemin by π–π stacking to form g-C3N4–hemin nanocomposite. Then, a lactate biosensor was constructed based on the combination of g-C3N4–hemin and HGNPs. Due to the fact that both g-C3N4–hemin nanocomposite and HGNPs could enhance the ECL intensity of luminol/H2O2 system, the prepared biosensor exhibited a low detection limit, good accuracy, and high sensitivity for the lactate. Details of the preparation, characterization, optimization of conditions and performance of biosensor were described as follows.

Experimental

Reagents and materials

Melamine (C3H6N3, 2,4,6-triamino-1,3,5-trazine, 99%), sodium citrate (Na3C6H5O7·2H2O), sodium borohydride (NaBH4), cobalt dichloride (CoCl2·6H2O), chitosan, lactate and LOX were obtained from Aladdin Ltd. (Shanghai, China). Gold chloride tetrahydrate (HAuCl4·4H2O) and hemin were obtained from Sigma Chemical Co. (St. Louis, MO, USA). 0.10 M phosphate-buffered saline (PBS) solutions with various pH were produced with 0.10 M Na2HPO4 and 0.10 M KH2PO4. The supporting electrolyte was 0.10 M KCl. Ultra pure water was used throughout the whole experimental process. All other chemicals were of analytical grade without further purification.

Apparatus

The ECL emission was monitored by a MPI-E electrochemical analyser (Xi'an Remax Analyse Instrument Co. Ltd, Xi'an, China) with the voltage of the photomultiplier tube (PMT) set at 800 V in the detection process. Cyclic voltammetry (CV) was performed with a CHI 600D electrochemical work station (Shanghai CH Instruments Co., China). The transmission electron microscopy (TEM) was carried out on TECNAI 10 (Philips Fei Co., Hillsboro). Fourier Transform Infrared spectroscopy (FT-IR) was performed on a Nexus 670 FT-IR spectrophotometer (Nicolet Instruments) using a KBr pellets. The topographs of different modified films were investigated with atomic force microscopy (AFM, MFD-3D, AR sylum Research). X-ray photoelectron spectroscopy (XPS) was carried out on Thermo ESCALAB 250 spectrometer (SID-Molecular). The crystal structure of the samples was investigated using powder X-ray diffraction (XRD) (Purkinje General InstrumentXD-3, Japan) with Cu Kα radiation (λ = 0.15406 nm). The morphologies and sizes of various nanomaterials were analyzed using a scanning electron microscopy (SEM) (SEM, S-4800, Hitachi, Japan) with an acceleration voltage of 10 kV.

Preparation of g-C3N4 nanosheets

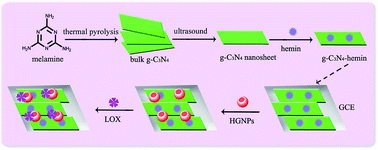
The bulk g-C3N4 was prepared by direct pyrolysis of melamine in the semiclosed system according to a previous reported method in the literature with a little modification.32 In detail, 20 g melamine was added into an alumina crucible and heated at 600 °C for 2 h under air condition with a ramp rate of about 3 °C min−1. The obtained yellow products were bulk g-C3N4. Then, 200 mg bulk g-C3N4 power was dispersed in 200 mL of ultra pure water with ultrasound. The obtained suspension was centrifuged at 5000 rpm to remove the residual unexfoliated g-C3N4. Then, the supernatant was dried in air to get g-C3N4 nanosheets. The corresponding synthesis process is shown in Scheme 1.
image file: c4ra09616a-s1.tif
Scheme 1 Preparation of g-C3N4–hemin composite and fabrication process of the biosensor.

Preparation of hollow gold nanoparticles (HGNPs)

HGNPs were synthesized according to the literature27 with some modification. The containers used in the synthesis process were cleaned using chromic acid solution. 200 μL of sodium citrate solution (0.10 M) was added into 50 mL of ultra pure water with rapid magnetic stirring under the nitrogen (N2) atmosphere. Following that, 200 μL of freshly made NaBH4 solution (1.0 M) was added. Subsequently, 100 μL CoCl2 solution (0.50 M) was added into above solution under stirring. The color of the solution changed from pale pink to gray. Finally, 150 μL HAuCl4 solution (0.10 M) was slowly added in drops. The color of the solution changed from dark brown to amaranth. The remaining cobalt nanoparticles left in the solution were oxidized under ambient conditions with rapid stirring for 1 h to obtain the HGNPs, which were collected by centrifugation and washed several times with ultra pure water. The resultant HGNPs were dispersed in 5 mL ultra pure water.

Fabrication of the biosensor

g-C3N4 nanosheets serve as a nanocarrier for hemin to achieve g-C3N4–hemin composite by π–π stacking. The details are as follows. First, 2 mg g-C3N4 and 2 mg hemin were dispersed in 1 mL pure water by stirring at 65 °C for 8 h. Then, the mixture was centrifuged several times at 12[thin space (1/6-em)]000 rpm to obtain g-C3N4–hemin composite, which were redispersed in 1.0 mL chitosan solution (0.2%) in ultrasound conditions for further use.

The glassy carbon electrode (GCE, ϕ = 4 mm) was polished cleanly with 0.3 and 0.05 μm alumina slurry, and then rinsed with ethanol and water by sonication, respectively. Then, 10 μL dispersion of g-C3N4–hemin was cast onto a pretreated GCE surface. After dried in the air, the electrode was soaked in HGNPs colloid solution for 10 h to self-assembly HGNPs. After that, 10 μL LOX was dropped on the surface of electrode to structure a lactate biosensor (noted as LOX/HGNPs/g-C3N4–hemin/GCE). The corresponding fabrication process of the biosensor is shown in Scheme 1.

Experimental determination

The electrochemical measurements (CV and EIS) were performed in 3.0 mL 5.0 mM ferricyanide solution. The ECL detection was performed in 3.0 mL PBS solution containing luminol. The whole measurement process was supported by a conventional three electrode system at room temperature. A modified glassy carbon electrode was used as working electrode, a platinum wire as the auxiliary electrode, and a saturated calomel electrode (SCE) as reference electrode for electrochemical measurements and Ag/AgCl (saturated KCl) as reference electrode for ECL detection. The ECL determination was based on the change in ECL intensity (ΔI = I0It). Herein, It and I0 are the ECL signals with and without lactate, respectively.

Previous reports35–37 have proved that the ECL of luminol in luminol/H2O2 system is related to various reactive oxygen species such as OH˙, O2˙, and other radical derivatives, which can oxidize luminol to generate the excited state. When the excited state fell to the ground state, and light was emitted. In our experiments, LOX modified on the biosensor would catalyze the oxidation of substrate lactate to generate H2O2, which further generated various reactive oxygen species (ROS). These ROS could oxidize luminol to produce the ECL signal. Under positive potential, with the help of g-C3N4–hemin composite, the luminol produced stronger ECL signals since both g-C3N4 and hemin could act as catalyst to enhance the ECL signal. The change of the ECL intensity was directly proportional to the concentration of lactate. The detection principle of the prepared biosensor is as follow.

image file: c4ra09616a-t1.tif

Luminol + H2O2 → 3-aminophetalate + N2 + hv

Results and discussion

The characterization of different nanomaterials

Fig. 1A shows the XRD patterns of bulk g-C3N4, g-C3N4 nanosheets, and g-C3N4–hemin nanocomposite. Bulk g-C3N4 (curve a) had two distinct diffraction peaks at 27.74° and 13.11°, which could be indexed for graphitic materials as the (002) and (100) peaks in JCPDS 87-1526.38 These results were in good agreement with the report in the literature.39,40 Compared with bulk g-C3N4, the g-C3N4 nanosheets (curve b) only showed a much weaker (002) peak at 27.74°, suggesting the exfoliation of bulk g-C3N4 after ultrasonication treatment. For the g-C3N4–hemin nanocomposite (curve c), a noticeably peak at 24°was noticed, which agreed with hemin.41 These observations indicated the formation of g-C3N4–hemin nanocomposite.
image file: c4ra09616a-f1.tif
Fig. 1 (A) XRD of (a) bulk g-C3N4, (b) g-C3N4 nanosheets, and (c) g-C3N4–hemin nanocomposite; (B) FT-IR spectra of (a) hemin, (b) g-C3N4 nanosheets, and (c) g-C3N4–hemin nanocomposite.

Fig. 1B shows the FT-IR spectra of hemin, g-C3N4 nanosheets, and g-C3N4–hemin nanocomposite. As shown in curve a, the strong sharp peaks at 1700 cm−1 and 3445 cm−1 were attributed to C[double bond, length as m-dash]O and –OH of hemin. For the IR spectrum of g-C3N4 nanosheets (curve b), the sharp peak at around 810 cm−1 was originated from heptazine ring system. The peaks in the region from 900 to 1800 cm−1 were attributed to either trigonal C–N(–C)–C (full condensation) or bridging C–NH–C units. The broad peaks between 3000 and 3600 cm−1 were contributed by N–H stretching. The peaks at 1150 cm−1 and 3073 cm−1 were observed in the IR spectrum of g-C3N4–hemin nanocomposite (curve c), which were attributed to CH and CH[double bond, length as m-dash]C of hemin. The peak at 810 cm−1 was observed, which was due to the g-C3N4. The strong sharp band of the carbonyl acid groups of hemin at 1700 cm−1 was disappeared and replaced by the carboxylate bands, vas at 1543 cm−1, due to the interactions of the carboxylic groups with basic ligands.

TEM was performed to characterize HGNPs, g-C3N4 nanosheets and g-C3N4–hemin composite. As shown in Fig. 2A, the hollow structure of HGNPs was clearly recognized in TEM image. The lamellar structure of nanosheets was clearly observed in the TEM image of g-C3N4 nanosheets (Fig. 2B). Compared with g-C3N4 nanosheets, the TEM image of g-C3N4–hemin composite (Fig. 2C) obviously changed and it presented an irregular, non-transparent and thicker flake structure, indicating the successful synthesis of g-C3N4 nanosheets and g-C3N4–hemin composite.


image file: c4ra09616a-f2.tif
Fig. 2 TEM images of (A) HGNPs, (B) g-C3N4 nanosheets and (C) g-C3N4–hemin composite.

The XPS spectra of g-C3N4 nanosheets and g-C3N4–hemin composite samples were measured to further confirm the successful synthesis of the g-C3N4–hemin composite. The XPS survey of g-C3N4 nanosheets sample (Fig. 3A) showed that the g-C3N4 nanosheets mainly composed of C and N elements, which was consistent with the C3N4 stoichiometry. The signal of O1s was observed, which may be due to the adsorption of oxygen during the progress of polymerization or preparation of ultrathin g-C3N4 nanosheets. Besides the C1s and N1s, the Cl2p peak at 199.2 eV and the Fe2p peak at 710.8 eV, which were due to hemin, were observed in the XPS survey of g-C3N4–hemin composite (Fig. 3B), indicating the successful synthesis of g-C3N4–hemin composite.


image file: c4ra09616a-f3.tif
Fig. 3 Wide scan survey of XPS spectra of (A) g-C3N4 nanosheets and (B) g-C3N4–hemin composite.

Characterization of the biosensor fabrication

The g-C3N4 nanosheets, g-C3N4–hemin, HGNPs/g-C3N4–hemin, and LOX/HGNPs/g-C3N4–hemin modified films were characterized by SEM. As shown in Fig. 4A, the nanosheet structure of g-C3N4 nanosheets was obviously observed. Fig. 4B exhibits the SEM image of g-C3N4–hemin nanocomposite modified film. The change in sheet structure indicated that g-C3N4–hemin nanocomposite was obtained. For the SEM image of HGNPs/g-C3N4–hemin (Fig. 4C), HGNPs were uniformly distributed on the whole surface of g-C3N4–hemin nanocomposite. The sizes of HGNPs were about 50–100 nm. Compared with Fig. 4C, the whole image became dimly in Fig. 4D, which was due to the nonconductive property of LOX coated on the HGNPs. The SEM images provided the proof of the successful synthesis of g-C3N4 nanosheets and g-C3N4–hemin composite, and the gradual modification of g-C3N4–hemin nanocomposite, HGNPs, and LOX on the electrode.
image file: c4ra09616a-f4.tif
Fig. 4 SEM images of (A) g-C3N4 nanosheets, (B) g-C3N4–hemin, (C) HGNPs/g-C3N4–hemin, and (D) LOX/HGNPs/g-C3N4–hemin modified films.

The AFM technique was also employed to confirm the fabrication process of the biosensor. The AFM images of g-C3N4 nanosheets, g-C3N4–hemin nanocomposite, HGNPs/g-C3N4–hemin, and LOX/HGNPs/g-C3N4–hemin modified films are shown in Fig. 5. Fig. 5A clearly revealed the nanosheet structure of g-C3N4 nanosheets. Furthermore, it was observed that g-C3N4 nanosheets were well-separated from each other. Compared with Fig. 5A, the AFM image of g-C3N4–hemin composite (Fig. 5B) clearly changed, and the sheet structure for g-C3N4 changed to a stacked sheet-like structure for g-C3N4–hemin with an increased thickness due to the modification of hemin on the g-C3N4 by π–π stacking. After HGNPs were modified on the g-C3N4–hemin composite, the spherical particles of HGNPs were obviously observed at the corresponding AFM image (Fig. 5C). The AFM image of LOX/HGNPs/g-C3N4–hemin became more smooth (Fig. 5D) with the modification of LOX on HGNPs/g-C3N4–hemin due to LOX filling the interstitial places between HGNPs and HGNPs, and HGNPs and g-C3N4–hemin, suggesting that LOX was successfully immobilized on the surface of HGNPs/g-C3N4–hemin. With the gradual modification of hemin, HGNPs, and LOX, the corresponding thickness gradually increased, indicating the fabrication process of the biosensor.


image file: c4ra09616a-f5.tif
Fig. 5 AFM images of (A) g-C3N4 nanosheets, (B) g-C3N4–hemin, (C) HGNPs/g-C3N4–hemin, and (D) LOX/HGNPs/g-C3N4–hemin modified films.

Electrochemical impedance spectroscopy (EIS) is also a useful tool for evaluating the interfacial changes of an electrode. The semicircle diameter of impedance spectrum equals the electron transfer resistance (Ret), which controls the electron transfer kinetics of the redox probe at the electrode interface. Fig. 6A presents the impedance spectrum of each modified stage in 5.0 mM K3Fe(CN)6/K4Fe(CN)6 (1[thin space (1/6-em)]:[thin space (1/6-em)]1). Compared with the bare GCE (Fig. 6A, curve a), the Nyquist semicircle of g-C3N4–hemin modified electrode (Fig. 6A, curve b) increased due to that the poor conductive properties of g-C3N4–hemin nanocomposite and chitosan would obstruct the electron transfer of the electrochemical probe. After the HGNPs were immobilized onto the electrode, the Nyquist semicircle further increased (Fig. 6A, curve c). The reason is as follows. On the one hand, HGNPs with large specific surface area and good conductivity would accelerate the electron transfer rate of the electrochemical probe. On the other hand, HGNPs with negative charge would reject [Fe(CN)6]3−/4− arriving at the electrode surface, which leaded to a decrease in the concentration of [Fe(CN)6]3−/4− on the electrode surface, thereby causing an increase in the Nyquist semicircle. The later dominated in the measurement process, therefore an increase in the Nyquist semicircle was observed. After the LOX was immobilized onto the electrode (Fig. 6A, curve d), the Nyquist semicircle further increased due to the hindrance caused by non-conductive LOX. The modification of the biosensor was also characterized by CV and the corresponding cyclic voltammograms were shown in Fig. 6B. As observed, with the gradual modification of g-C3N4–hemin nanocomposite, HGNPs, and LOX, the CV peak currents of the modified electrodes gradually reduced. The results of CV were consistent with those of EIS. The results of EIS and CV also proved that the enzyme LOX has been modified on the electrode.


image file: c4ra09616a-f6.tif
Fig. 6 (A) EIS and (B) CV characterization of (a) bare GCE, (b) g-C3N4–hemin/GCE, (c) HGNPs/g-C3N4–hemin/GCE, and (d) LOX/HGNPs/g-C3N4–hemin/GCE in 5.0 mM K3[Fe(CN)6]/K4[Fe(CN)6] (1[thin space (1/6-em)]:[thin space (1/6-em)]1). Scan rate: 50 mV s−1. The insert shows the amplified CV curves of (B).

Optimization of analytical conditions

The effect of the concentration of luminol, pH of PBS, and the incubating time of HGNPs and LOX on the intensity of ECL signal was studied to optimize the performance of the ECL biosensors for detecting lactate. As shown in Fig. S1A, the ECL signal intensity increased with the increase in the concentrations of luminol from 0.05 to 0.30 mM, and decreased slightly with the concentration of luminol exceeding 0.30 mM (Fig. S1A). Therefore, 0.30 mM was selected as the optimal concentration of luminol in this study.

To obtain a higher enzyme loading on the modified electrode, the incubating time of HGNPs was optimized since the quantity of LOX assembled onto the electrode depends on the quantity of HGNPs on the electrode. The influence of incubation time of HGNPs on the performance of the biosensor was investigated and the results are shown in Fig. S2B. ECL signal intensity increased with the increase in incubated time of HGNPs from 2 h to 10 h, and decreased slightly with the incubated time of HGNPs over 10 h. Thus, the incubation time of 10 h was selected for the biosensor fabrication.

The incubation time of LOX was optimized since the concentration of the LOX modified on the electrode was influenced by the incubation time of LOX. The influence of incubation time of LOX on the performance of the biosensor was investigated and the results are shown in Fig. S1C. As seen, the ECL signal intensity increased with the increase in incubated time of LOX from 2 h to 12 h, but increased slightly with the incubated time of LOX over 10 h. Thus, 10 h was chosen as the incubation time of LOX.

The pH as an important factor, affected the luminol's ECL signal and the enzymatic reactions for the following reasons. (1) The pH greatly influenced the ECL signal in luminol/H2O2 system. (2) The catalytic activity of LOX was affected by pH and the optimum pH for LOX activity was 6.0–7.0, and. The ECL signals were detected at the biosensor in PBS solutions with different pH, in the presence of 0.30 mM luminol and 0.028 mM lactate. The corresponding results are shown in Fig. S1D. The ECL intensity increased with the pH from 6.0 to 9.0 and decreased after pH 9.0 for the reason that alkaline conditions were favorable for luminol luminescence, but too high pH also affected the enzyme activity. We mainly studied the application of the biosensor in the actual detection, so physiological pH 7.4 was selected to be used in our experiments.

Performance of the biosensor

In order to investigate the effect of hemin, g-C3N4 and HGNPs on the luminol/H2O2 ECL system, a comparative test was performed using different modified electrodes under the scanning potential in range of 0.2–0.8 V. Fig. S2A shows the ECL behaviors of (a) bare GCE, (b) g-C3N4/GCE, (c) g-C3N4–hemin/GCE and (d) HGNPs/g-C3N4–hemin/GCE. As seen, compared with the control electrodes bare GCE, g-C3N4/GCE and g-C3N4–hemin/GCE, our prepared biosensor (HGNPs/g-C3N4–hemin/GCE) showed the maximum ECL intensity, indicating the promoting effect of g-C3N4, hemin and HGNPs on the ECL intensity in luminol/H2O2 system. The reasons may be as follows. (1) g-C3N4 nanosheets have outstanding electronic and catalytic properties and luminescence performance. (2) Hemin hold activity centre which could accelerate the electron transfer rate. (3) The HGNPs could amplify the ECL signal of luminol due to the good conductivity, large surface area, and excellent electroactivity for luminol. This control experiment suggested that hemin, g-C3N4 and HGNPs could directly enhance the ECL intensity of luminol/H2O2 system for the excellent catalytic performance.

In addition, it was reported that g-C3N4 nanosheets could generate strong ECL signal with various coreactant under the different potential. In order to investigate whether the g-C3N4 nanosheets have ECL response under our working potential (0.2–0.8 V), we studied the ECL response of g-C3N4 modified electrode in the range of −2.0–2.0 V. As seen in Fig. S2B, g-C3N4 nanosheets modified electrode indeed generated strong ECL signal under the potential in the range of −1.0–2.0 V and 1.0–2.0 V, respectively. Obviously, the ECL signal resulted from g-C3N4 don't interfere with our determination at the working potential (0.2–0.8 V).

Fig. 7A reveals the ECL behaviors of the biosensor for the determination of lactate under optimal experimental conditions. As seen, the ECL signal increased with the addition of lactate, which was ascribed to the fact that H2O2 produced by the catalysis of LOX can enhance the ECL signal of luminol. The curve a of Fig. 7B shows the linear relationship of the biosensor between the ECL signal intensity and the concentration of lactate. The linear range was from 1.7 × 10⁻⁸ to 5.0 × 10⁻⁴ M and the limit of detection (S/N = 3) was 5.5 × 10⁻⁹ M. The regression equation was I (a.u.) = 874.79 + 9.28 × 10³c (mM) with a correlation coefficient of 0.993. To compare the ECL performance of HGNPs and AuNPs modified electrodes, the control electrode LOX/AuNPs/g-C3N4–hemin with AuNPs was constructed and its response to lactate was investigated (curve b, Fig. 7B). The linear range from 1.4 × 10⁻⁵ M to 3.8 × 10⁻⁴ M and the limit of detection of 3.7 × 10⁻⁶ M were obtained. Obviously, the biosensor with HGNPs exhibited a higher sensitivity, wider linear range and lower detection limit than AuNPs modified electrode. This was due to that the hollow structure of HGNPs allow more LOX to adsorb on the inside surface of the walls as well on the outside surface.


image file: c4ra09616a-f7.tif
Fig. 7 (A) ECL responses of the biosensor to lactate with the concentrations of 0, 1.67 × 10⁻⁸, 3.33 × 10⁻⁷, 6.67 × 10⁻⁷, 1.17 × 10⁻⁶, 2.67 × 10⁻⁶, 4.33 × 10⁻⁶, 7.67 × 10⁻⁶, 1.27 × 10⁻⁵, 1.93 × 10⁻⁵, 2.77 × 10⁻⁵, 3.77 × 10⁻⁵, 5.43 × 10⁻⁵, 8.77 × 10⁻⁵, 1.38 × 10⁻⁴, 2.04 × 10⁻⁴, 2.88 × 10⁻⁴, 3.88 × 10⁻⁴, and 5.04 × 10⁻⁴ M (from bottom to top) in 0.10 M PBS (pH 7.4) containing 0.30 mM luminol. (B) Calibration curves of (a) LOX/HGNPs/g-C3N4–hemin/GCE and (b) LOX/AuNPs/g-C3N4–hemin/GCE.

In addition, the comparison between different detection methods for lactate was performed and the results are shown in ESI Table 1. As seen, our biosensor exhibited a lower detection limit and higher sensitivity, which was due to the following reasons. (1) both g-C3N4–hemin nanocomposite and HGNPs could enhance the ECL intensity of luminol/H2O2 system. (2) More LOX was immobilized for the hollow structure of HGNPs.

To assess the applicability of the biosensor, the lactate in real serum samples was tested using the biosensor. Serum samples were diluted with pH 7.4 PBS and the results are shown in Table 1. Compared with the UV-vis spectrophotometric enzyme kinetics in hospital, the prepared biosensors showed an acceptable result and the corresponding relative deviation was −8.0%, 9.1%, 12% and −7.9%, respectively, demonstrating the practicability of the sensing protocol.

Table 1 Analytical results of lactate in human serum samples
Samplea Lactate concentration tested by hospital (mM) Lactate concentration tested by tested by biosensorb (mM) Relative deviation
a The human serum sample from 9th People's Hospital of Chongqing, Chongqing.b Average of three determination ±SD, n = 4.
1 0.25 0.23 ± 0.02 8.0%
2 0.22 0.24 ± 0.01 9.1%
3 0.41 0.46 ± 0.04 12%
4 0.38 0.35 ± 0.01 −7.9%


The stability of the biosensor was also tested by monitoring its ECL response towards 0.028 mM lactate. The electrode was stored in 4 °C when not in use, the electrode was detected every two days. 20 days later, the response of the ECL biosensor decreased 8.9%, indicating an acceptable stability of the biosensor, as shown in Fig. S3. The interfering substances, such as dopamine (0.83 mM), uric acid (0.83 mM), ascorbic acid (0.83 mM) and glucose (0.83 mM) were tested and it was found that the change of ECL signal resulted from interfering substances was negligible, which indicated that the biosensor had a good anti-interference ability and good selectivity.

Conclusion

In summary, an ECL biosensor was constructed based on g-C3N4–hemin nanocomposite and HGNPs for the detection of lactate. g-C3N4 nanosheets exhibited an excellent catalytic effect on luminol/H2O2 ECL system, and hemin and HGNPs could further improve its ECL properties. The combination of g-C3N4–hemin nanocomposite and HGNPs might be an efficient and promising nanomaterial for ECL sensing. This study provided a new, economic, effective and sensitive method to detect lactate, thus exhibiting great potential application in clinic.

Acknowledgements

This work was financially supported by the NNSF of China (21075100, 21275119, 21105081), Ministry of Education of China (Project 708073), Research Fund for the Doctoral Program of Higher Education (RFDP) (20110182120010), Natural Science Foundation of Chongqing City (CSTC-2011BA7003, CSTC-2014JCYJA20005, CSTC-2010BB4121), State Key Laboratory of Silkworm Genome Biology (sklsgb2013012) and the Fundamental Research Funds for the Central Universities (XDJK2013A008, XDJK2013A027, XDJK2014A012), China.

Notes and references

  1. A. Loforte, A. Montalto, F. Ranocchi, P. L. Della Monica, G. Casali, A. Lappa, A. Menichetti, C. Contento and F. Musumeci, Artif. Organs, 2012, 36, E53–E61 CrossRef CAS.
  2. D. A. Sakharov, M. U. Shkurnikov, M. Y. Vagin, E. I. Yashina, A. A. Karyakin and A. G. Tonevitsky, Bull. Exp. Biol. Med., 2010, 150, 83–85 CrossRef CAS PubMed.
  3. G. Q. Zhou, L. L. Tang, Y. P. Mao, L. Chen, W. F. Li, Y. Sun, L. Z. Liu, L. Li, A. H. Lin and J. Ma, Int. J. Radiat. Oncol., Biol., Phys., 2012, 82, E359–E365 CrossRef CAS PubMed.
  4. S. V. Meethal and C. S. Atwood, Neurobiol. Aging, 2012, 33, 569–581 CrossRef PubMed.
  5. J. Tonini, A. S. Michallet, P. Flore, H. Nespoulet, J. L. Pepin, B. Wuyam, P. Levy and R. Tamisier, Respir. Physiol. Neurobiol., 2011, 179, 287–293 CrossRef PubMed.
  6. P. Labroo and Y. Cui, Biosens. Bioelectron., 2013, 41, 852–856 CrossRef CAS PubMed.
  7. N. Nesakumar, S. Sethuraman, U. M. Krishnan and J. B. B. Rayappan, J. Colloid Interface Sci., 2013, 410, 158–164 CrossRef CAS PubMed.
  8. N. G. Patel, A. Erlenkotter, K. Cammann and G.-C. Chemnitius, Sens. Actuators, B, 2000, 67, 134–141 CrossRef CAS.
  9. A. M. Herrero, T. Requena, A. J. Reviejo and J. M. Pingarron, Eur. Food Res. Technol., 2004, 219, 557–560 CrossRef PubMed.
  10. H. Henry, N. Marmy Conus, P. Steenhout, A. Beguin and O. Boulat, Biomed. Chromatogr., 2012, 26, 425–428 CrossRef CAS PubMed.
  11. N. Nesakumar, S. Sethuraman, U. M. Krishnan and J. B. B. Rayappan, J. Colloid Interface Sci., 2013, 410, 158–164 CrossRef CAS PubMed.
  12. F. K. Sartain, X. Yang and C. R. Lowe, Anal. Chem., 2006, 78, 5664–5670 CrossRef CAS PubMed.
  13. A. C. B. Dias, R. A. O. Silva and M. A. Z. Arruda, Microchem. J., 2010, 96, 151–156 CrossRef CAS PubMed.
  14. P. Bertoncello and R. J. Forster, Biosens. Bioelectron., 2009, 24, 3191–3200 CrossRef CAS PubMed.
  15. Y. Y. Su and Y. Lv, RSC Adv., 2014, 4, 29324–29339 RSC.
  16. V. R. Rivera, F. J. Gamez, W. K. Keener and M. A. Poli, Anal. Biochem., 2006, 353, 248–256 CrossRef CAS PubMed.
  17. L. Z. Hu and G. B. Xu, Chem. Soc. Rev., 2010, 39, 3275–3304 RSC.
  18. W. J. Fei, F. F. Chen, L. Sun, Q. H. Li, J. P. Yang and Y. Wu, Microchim. Acta, 2014, 181, 419–425 CrossRef CAS.
  19. Z. Y. Lin, J. H. Chen, Y. W. Chi, B. Qui, J. M. Lin and G. N. Chen, Electrochim. Acta, 2008, 53, 6464–6468 CrossRef CAS.
  20. B. Haghighi and S. Bozorgzadeh, Talanta, 2011, 85, 2189–2193 CrossRef CAS.
  21. M. M. Cheng, G. Cuda, Y. L. Bunimovich, M. Gaspari, J. R. Heath, H. D. Hill, C. A. Mirkin, A. J. Nijdam, R. Terracciano, T. Thundat and M. Ferrari, Curr. Opin. Chem. Biol., 2006, 10, 11–19 CrossRef CAS.
  22. N. L. Rosi and C. A. Mirkin, Chem. Rev., 2005, 105, 1547–1562 CrossRef CAS.
  23. A. C. Templeton, W. P. Wuelfing and R. W. Murray, Acc. Chem. Res., 2000, 33, 27–36 CrossRef CAS PubMed.
  24. R. Bhattacharya and P. Mukherjee, Adv. Drug Delivery Rev., 2008, 60, 1289–1306 CrossRef CAS PubMed.
  25. M. De, P. S. Ghosh and V. M. Rotello, Adv. Mater., 2008, 20, 4225–4241 CrossRef CAS.
  26. E. E. Connor, J. Mwamuka, A. Gole, C. J. Murphy and M. D. Wyatt, Small, 2005, 1, 325–327 CrossRef CAS PubMed.
  27. A. M. Schwartzberg, T. Y. Oshiro, J. Z. Zhang, T. Huser and C. E. Talley, Anal. Chem., 2006, 78, 4732–4736 CrossRef CAS PubMed.
  28. C. M. Cheng, Y. Huang, X. Q. Tian, B. Z. Zheng, Y. Li, H. Y. Yuan, D. Xiao, S. P. Xie and M. M. F. Choi, Anal. Chem., 2012, 84, 4754–4759 CrossRef CAS PubMed.
  29. Y. P. Li, J. Zhan, L. Y. Huang, H. Xu, H. M. Li, R. X. Zhang and S. L. Wu, RSC Adv., 2014, 4, 11831–11839 RSC.
  30. F. Goettmann, A. Fischer, M. Antonietti and A. Thomas, Angew. Chem., Int. Ed., 2006, 45, 4467–4471 CrossRef CAS PubMed.
  31. L. C. Chen, D. J. Huang, S. Y. Ren, T. Q. Dong, Y. W. Chi and G. N. Chen, Nanoscale, 2013, 5, 225–230 RSC.
  32. J. Q. Tian, Q. Liu, A. Asiri, A. O. Al-Youbi and X. P. Sun, Anal. Chem., 2013, 85, 5595–5599 CrossRef CAS PubMed.
  33. J. Q. Tian, Q. Liu, C. J. Ge, Z. C. Xing, A. M. Asiri, A. O. Al-Youbi and X. P. Sun, Nanoscale, 2013, 5, 8921–8924 RSC.
  34. J. Q. Tian, Q. Liu, A. M. Asiri, A. H. Qusti, A. O. Al-Youbi and X. P. Sun, Nanoscale, 2013, 5, 11604–11609 RSC.
  35. S. F. Li, X. M. Zhang, W. X. Du, Y. H. Ni and X. W. Wei, J. Phys. Chem. C, 2009, 113, 1046–1051 CAS.
  36. J. Wang, R. R. Zhao, M. Z. Xu and G. N. Chen, Electrochim. Acta, 2010, 56, 74–79 CrossRef CAS PubMed.
  37. H. Dai, Y. Y. Lin, G. F. Xu, L. S. Gong, C. P. Yang, X. L. Ma and G. N. Chen, Electrochim. Acta, 2012, 78, 508–514 CrossRef CAS PubMed.
  38. L. Ge, C. C. Han and J. Liu, J. Mater. Chem., 2012, 22, 11843–11850 RSC.
  39. X. C. Wang, K. Maeda, X. F. Chen, K. Takanabe, K. Domen, Y. D. Hou, X. Z. Fu and M. Antonietti, J. Am. Chem. Soc., 2009, 131, 1680–1681 CrossRef CAS PubMed.
  40. Q. J. Xiang, J. G. Yu and M. Jaroniec, Nanoscale, 2011, 3, 3670–3678 RSC.
  41. A. Paneque, J. F. Bertran, E. Reguera and H. Y. Madeira, Transition Met. Chem., 2001, 26, 76–80 CrossRef CAS.

Footnote

Electronic supplementary information (ESI) available. See DOI: 10.1039/c4ra09616a

This journal is © The Royal Society of Chemistry 2014
Click here to see how this site uses Cookies. View our privacy policy here.