Resonant detection of the signature of control of a resonance state lifetime using a pump–probe scheme

A. García-Vela
Instituto de Física Fundamental, Consejo Superior de Investigaciones Científicas, Serrano 123, 28006 Madrid, Spain. E-mail: garciavela@iff.csic.es

Received 5th September 2014 , Accepted 2nd October 2014

First published on 2nd October 2014


Abstract

Realistic wave packet simulations demonstrate that the signature of control of the survival probability and lifetime of a specific resonance state can be observed and probed in typical time-resolved pump–probe experiments. The main condition required is the existence of a resonant state having enough oscillator strength and overlapping essentially only with the target resonance subject to control. By selecting different resonant states, the effects of control on the different specific target resonances can be probed.

Introduction

The development of strategies to control molecular processes has become a very active field in the last few years.1,2 Among the different molecular processes that have been the subject of control are photodissociation,3–6 molecular reactions,7–9 radiationless transitions,10,11 and decoherence.12–14 The control strategies designed typically have a common basis, which is the manipulation of quantum interference effects by means of laser pulses in order to achieve a control target.

Recently, a scheme designed to control the lifetime of a resonance state has been proposed.15,16 The scheme takes advantage of the quantum interference effects that occur between overlapping resonances excited in a coherent superposition.3,15–18 The basis of the control scheme lies in the novel finding that the lifetime of an overlapping resonance is no longer an intrinsic property of the resonance state, as in the case of an isolated resonance, but instead it strongly depends on the amplitudes of the other overlapping resonances populated in the superposition.15 This effect thus allows one to control the survival probability and the associated lifetime of a specific resonance state by simply modifying with laser pulses the relative amplitudes of the excited resonances overlapping with the target resonance in the superposition prepared.

One of the most relevant aspects of the above control scheme is its experimental realization, probing the signature of interference. Thus, the goal of this work is to investigate whether a realistic and feasible pump–probe experiment can be designed and applied to detect the survival probability of the target resonance subject to control, revealing the signature and the effects of control.

Triatomic van der Waals (vdW) complexes of the type Br2–Ne present a variety of situations involving overlapping resonances. Therefore, they are very suitable systems to apply and test control schemes based on interference between overlapping resonances, for that purpose Br2–Ne has been chosen in previous work.15–18 In addition, the potential-energy surface available for Br2(B)–Ne appears to be realistic enough. Indeed, previous time-dependent calculations of the predissociation lifetime of the Br2(B, v′ = 16)–Ne ground resonance state (B and v′ denoting excited electronic and vibrational states of Br2, respectively) using this potential surface gave a value of ∼70 ps,15 while the corresponding lifetime obtained experimentally19 was 68 ± 3 ps. The good accuracy of the potential surface employed along with the three-dimensional wave packet methodology used make the theoretical model applied in the present simulations a quite realistic one.

In particular, it has been shown that the ground intermolecular resonance of the Br2(B, v′ = 27)–Ne complex mainly overlaps with a single vdW orbiting resonance located in the lower v′ − 1 = 26 vibrational manifold, above the Br2(B, v′ − 1) + Ne dissociation threshold.20–22 The situation of essentially only two overlapping resonances is the simplest one where we can apply the control scheme, which greatly facilitates the interpretation of the control effects. For this reason, in the present work, as in previous ones,15,16 the ground vdW resonance of Br2(B, v′ = 27)–Ne is chosen as the target resonance for lifetime control. Realistic 3D wave packet simulations of a time-resolved pump–probe experiment on the vibrational predissociation decay dynamics of this resonance have been carried out, applying the control scheme, and are reported.

Theoretical methodology

Upon laser excitation, Br2(B, v′ = 27)–Ne ← Br2(X, v′′ = 0)–Ne, the ground vdW resonance of Br2(B, v′ = 27)–Ne is populated. Then the resonance decays to the fragmentation continuum through vibrational predissociation, Br2(B, v′ = 27)–Ne → Br2(B, vf < v′) + Ne.20–24 The excitation spectrum of the Br2(B, v′ = 27)–Ne ground resonance is shown in Fig. 1. The spectrum displays a main peak located at −61.80 cm−1, associated with the v′ ground vdW resonance, and several other overlapping peaks, associated with the v′ − 1 orbiting resonances. The second most intense feature in the spectrum is a peak at −60.63 cm−1 that overlaps with the main peak. Previous simulations applying control schemes15,16 indicated that interference of the v′ ground resonance occurs with appreciable intensity only with the v′ − 1 orbiting resonance, associated with this secondary peak.
image file: c4ra09884f-f1.tif
Fig. 1 Calculated excitation spectrum associated with the ground vdW resonance of Br2(B, v′ = 27)–Ne. The energy axis is relative to the Br2(B, v′ = 27, j′ = 0) + Ne dissociation threshold.

The control scheme applied in this work involves a combination of two pump laser pulses (with Gaussian shape) to prepare a coherent superposition of the two overlapping resonances in the v′ and v′ − 1 manifolds. One pump pulse excites the v′ ground resonance and the other pulse excites the v′ − 1 orbiting resonance. This control scheme, described in detail elsewhere,16 will be briefly reviewed here. The pump laser electric field applied is

 
Epump(t) = A1e−(tt1)2/2σ2[thin space (1/6-em)]cos[thin space (1/6-em)]ω1t + A2e−(tt2)2/2σ2[thin space (1/6-em)]cos[thin space (1/6-em)]ω2t, (1)
where ω1 and ω2 are the photon frequencies required to excite the v′ and v′ − 1 resonances, respectively. The amplitudes A1 and A2 are small enough to correspond to the weak field regime. The temporal width of the two pump pulses (related to σ) is fwhm = 200 ps, which corresponds to a spectral width of fwhm = 0.15 cm−1. Thus, the bandwidths of the two pump pulses do not overlap and each pulse essentially excites a single resonance.

The electric field Epump(t) of eqn (1) creates a coherent superposition of the v′(ψ1) and v′ − 1(ψ2) resonances in the B state

 
ΦB(t) = a1(t)ψ1(t) + a2(t)ψ2(t), (2)
and the survival probability associated with ψ1 is
 
I1(t) = |〈ψ1|ΦB(t)〉|2 = |a1(t)〈ψ1|ψ1(t)〉 + a2(t)〈ψ1|ψ2(t)〉|2 = |a1(t)|2|〈ψ1|ψ1(t)〉|2 + |a2(t)|2|〈ψ1|ψ2(t)〉|2 + a1(t)a2(t)*〈ψ1|ψ1(t)〉〈ψ2(t)|ψ1〉 + a1(t)*a2(t)〈ψ1(t)|ψ1〉〈ψ1|ψ2(t)〉, (3)
where the term |a1(t)|2|〈ψ1|ψ1(t)〉|2 corresponds to the survival probability of an isolated, non-overlapping resonance. The last three terms are interference terms arising from two conditions simultaneously fulfilled, namely that resonances ψ1 and ψ2 overlap (〈ψ1|ψ2(t)〉 ≠ 0), and that the two resonances are simultaneously populated (a1(t) ≠ 0 and a2(t) ≠ 0). As long as the coefficients a1 and a2 can be systematically modified, the effects of the interference terms can be controlled in order to change the survival probability and lifetime of the system in resonance ψ1 (or ψ2).

As previously shown,16 varying the ratio A2/A1 between the amplitudes of the pulses, and the delay time Δt = t2t1 between the centers of the pulses, allows one to modify the a1(t) and a2(t) coefficients in a flexible way, making a high degree of control possible. The control scheme used in this work applies a field Epump(t) where A2 = A1 and Δt = 160 fs (t1 = 0 and t2 = 160 fs). By applying this field, an enhancement of the v′ ground resonance lifetime by a factor of three (from 23.5 to 75 ps) is achieved with respect to the situation when only the ψ1 resonance is excited with a single pulse in the field (i.e., A2 = 0 and a2(t) = 0 in eqn (1) and (2), respectively).16 It is noted that the overlapping regime displayed by the spectrum of Fig. 1 is not a strong one. In this situation, when the ψ1 resonance is excited with a narrow bandwidth pulse (e.g., with fwhm = 0.15 cm−1) in the absence of any population of ψ2 (i.e., A2 = 0 and therefore a2(t) = 0), what is prepared is essentially an isolated ψ1 resonance, since the contribution of the overlapping ψ2 resonance populated by the narrow bandwidth pulse is very small, rather negligible. The lifetime corresponding to the “isolated” ψ1 resonance, prepared in this way, is 23.5 ps.16

The Br2(B, v′)–Ne ← Br2(X, v′′ = 0)–Ne excitation and the subsequent predissociation dynamics of the complex were simulated using a three-dimensional wave packet method described in detail elsewhere.15,24 From a theoretical point of view, the survival probability I1(t) of the target resonance ψ1 can be obtained by computing the quantity I1(t) = |〈ψ1|ΦB(t)〉|2. Experimentally, however, measuring I1(t) involves detection of the time-dependent signal of the Br2(B)–Ne complex pumped to the ψ1 resonance with the field Epump(t). That detection typically requires further excitation of the system to a resonant state with a probe pulse. In real experiments this is actually done by exciting the Br2(B)–Ne complex to the E electronic state, Br2(E, v)–Ne ← Br2(B, v′)–Ne, from which a fluorescence signal is finally detected.23,25 Therefore, in order to simulate the real experimental detection of the time-resolved survival probability of ψ1, excitation to the E electronic state has to be included in the simulation, in addition to the X and B states. Correspondingly, the pump–probe scheme simulated in the present calculations consists of exciting the system to Br2(B)–Ne with Epump(t) (populating either both ψ1 and ψ2 resonances if A1 ≠ 0 and A2 ≠ 0, or only ψ1 if A2 = 0), followed by a further excitation to Br2(E,v)–Ne with a probe pulse, varying the delay time between the pump and the probe pulses.

The potential energy surfaces for the X and B electronic states of Br2–Ne have already been described.24 The potential surface of the E electronic state is modeled in a similar way as those of the X and B states as a sum of a Br–Br intramolecular potential plus an intermolecular vdW Br2(E)–Ne potential. The Br–Br intramolecular potential is represented by a Morse function with the parameters D = 34[thin space (1/6-em)]672.04 cm−1, re = 3.197 Å, and α = 0.327762 a0−1, obtained from the experimental data of ref. 26. Unfortunately, there is no Br2(E)–Ne intermolecular potential available, so the same Br2–Ne intermolecular potential of B is assumed for the E state.

The probe laser pulse used to excite the system to the E state is

 
image file: c4ra09884f-t1.tif(4)
where A3 = A1 = A2. Here, ω3 is the photon frequency required for the Br2(E, v = 6, n)–Ne ← Br2(B, v′ = 27, n′ = 0)–Ne transition between the Br2(B, v′ = 27)–Ne ground resonance and the different n resonance states of Br2(E, v = 6)–Ne, ω3 = (E(E, v=6)nE(B, v′=27)n′=0)/ℏ. The (E, v = 6) ← (B, v′ = 27) transition has been chosen because transitions to the (E, v = 6) and (E, v = 7) vibrational manifolds have been actually used experimentally23 to probe the time evolution of the Br2(B, v′, n′ = 0)–Ne signal. Thus, it is stressed that a realistic pump–probe experimental scheme, which has already been applied in real experiments to probe the time-resolved survival probability of Br2(B, v′)–Ne ground intermolecular resonances,23 is simulated in this work. The main difference between the pump–probe experiment carried out in ref. 23 and the present simulations is that in the experiment only a single resonance (the ground one ψ1) was populated in the Br2(B, v′)–Ne complex, while two overlapping resonances (ψ1 and ψ2) are simultaneously populated in Br2(B)–Ne in the present simulations.

The accuracy in the detection of the details of the resonance survival probability depends strongly upon the temporal resolution (the temporal width, related to σ3) of the probe pulse. Four different pulse widths have been applied, namely fwhm = 12.0, 6.0, 3.0, and 1.5 ps, corresponding to the spectral widths of fwhm = 2.5, 5.0, 10.0, and 20.0 cm−1, respectively. By varying the delay between the center of the probe pulse t3 and the initial time of the Epump(t) field, the time evolution of the ψ1 survival probability can be probed. Such a delay is increased by a constant amount of 40, 20, 10, and 5 ps for the above four different probe pulses, respectively. Once the amplitude of Br2(B)–Ne is excited to (E, v = 6), its further time evolution in the E potential surface is described by the Schrödinger equation.

Results and discussion

Due to the much longer time scale of predissociation as compared to the time duration of Eprobe(t), it is found that the fraction of the Br2(E, v = 6)–Ne population that predissociates to lower vf < v = 6 levels during the operation of the probe pulse is really small for the fwhm = 12.0 and 6 ps pulses and negligible for the fwhm = 3.0 and 1.5 ps pulses. This allows one to calculate the Br2(B)–Ne population pumped by Eprobe(t) to the E state by adding all the probability accumulated only in the (E, v = 6) manifold at the end of the probe pulse operation. Survival probabilities are obtained in this way by exciting the Br2(B)–Ne population to the (E, v = 6, n = 0) resonant state using the four probe pulses of different widths, and are shown in Fig. 2.
image file: c4ra09884f-f2.tif
Fig. 2 Survival probabilities calculated for four different widths of the probe pulse, using the (E, v = 6, n = 0) resonance as the resonant state. The curves have been normalized to the same quantity for the sake of comparison.

The survival probability I1(t), obtained for the B state using eqn (3), displays a structure of peaks separated by a constant amount of time of ∼27 ps,16 due to interference between the ψ1 and ψ2 resonances populated simultaneously by the Epump(t) field. The constant separation of ∼27 ps between the undulations of I1(t) is the corresponding amount in the time domain to the energy separation of ∼1.2 cm−1 between the ψ1 and ψ2 resonances (located at −61.80 and −60.63 cm−1, respectively, see Fig. 1). All the survival probabilities of Fig. 2 also display a structure produced by interference between both resonances, albeit with a very different degree of resolution which increases as the probe pulse width decreases, as expected. Indeed, the curves calculated with the fwhm = 12.0 and 6.0 ps pulses still display a poor structure with a few broad peaks with non-constant separations. For the fwhm = 3.0 ps pulse the structure becomes more defined with a typically nearly constant separation between the peaks of 29–31 ps, and for the fwhm = 1.5 ps pulse the structure is already well defined with the peaks separated by ∼27 ps. Thus, the curves of Fig. 2 show that the signature of interference between the resonances, which makes the control of a resonance lifetime possible, can be effectively detected and probed with the desired accuracy using the present pump–probe scheme, by applying a probe pulse with enough time resolution. Clearly, in general, the time resolution needed for the probe pulse will depend upon the energy separation between the overlapping resonances.

In Fig. 3, the survival probability obtained with the fwhm = 1.5 ps probe pulse is compared to the survival probability I1(t) = |〈ψ1|ΦB(t)〉|2 calculated using eqn (3). The two curves are practically indistinguishable, indicating that even the intensity of the interference peaks can be accurately detected if a probe pulse with enough time resolution is used. A lifetime τ associated to the two survival probabilities can be estimated by fitting the curves to the convolution function

 
image file: c4ra09884f-t2.tif(5)
with CC(t) being the laser cross-correlation curve and A an amplitude scaling parameter. From the fit, the lifetime associated with the two survival probabilities is estimated to be τ = 75 ps, the same as that previously found for the I1(t) = |〈ψ1|ΦB(t)〉|2 curve.16


image file: c4ra09884f-f3.tif
Fig. 3 Comparison of the survival probability calculated using eqn (3) and that probed using the fwhm = 1.5 ps probe pulse and the (E, v = 6, n = 0) resonant state. A fit to a convolution function between the Gaussian cross-correlation curve and the exponential decay is also shown. The curves have been normalized to the same quantity for the sake of comparison.

The matching of the two survival probabilities of Fig. 3 has a most important implication. The survival probability I1(t) = |〈ψ1|ΦB(t)〉|2 computed using eqn (3) is the one associated only with the Br2(B, v′ = 27)–Ne ground vdW resonance. The I2(t) = |〈ψ2|ΦB(t)〉|2 survival probability associated with the Br2(B, v′ − 1 = 26)–Ne orbiting resonance will have a different form

 
I2(t) = |〈ψ2|ΦB(t)〉|2 = |a2(t)|2|〈ψ2|ψ2(t)〉|2 + |a1(t)|2|〈ψ2|ψ1(t)〉|2 + a1(t)a2(t)*〈ψ2|ψ1(t)〉〈ψ2(t)|ψ2〉 + a1(t)*a2(t)〈ψ1(t)|ψ2〉〈ψ2|ψ2(t)〉, (6)
since the |a2(t)|2|〈ψ2|ψ2(t)〉|2 term and the three interference terms are different from the corresponding ones of I1(t) in eqn (3). Therefore, the excellent coincidence between the two survival probabilities of Fig. 3, calculated in the different B and E electronic states, implies that it is possible to detect and probe the survival probability associated with a single specific resonance (ψ1 in this case), without any significant contribution of the survival probabilities of other overlapping resonances (like ψ2). The requirement is that the resonant state reached with the probe pulse (the (E, v = 6, n = 0) resonance in this case) must have an appreciable overlap essentially only with the target resonance of interest, having a small or negligible overlap with the other overlapping resonances in order to filter or avoid their contribution to the survival probability probed. This point is analyzed in more detail in the following.

It is interesting now to investigate the effect of reaching other (E, v = 6, n > 0) resonances with the probe laser. Table 1 summarizes the energies of the first (E, v = 6, n) vdW resonances. The most relevant feature is that the n = 0 energy is separated by ∼18 cm−1 from the n = 1 energy, while the energy separation between the nearby n ≥ 1 resonances is much smaller (typically 1–2 cm−1). Therefore, with the spectral widths of the probe pulses used here, only a single resonance is reached when (E, v = 6, n = 0) is chosen as the resonant state, while several resonances are actually populated when any of the (E, v = 6, n > 0) resonances are chosen.

Table 1 Calculated Br2(E, v = 6, n)–Ne zeroth-order resonance energies En, relative to the Br2(E, v = 6, j = 0) + Ne dissociation threshold
n En (cm−1) n En (cm−1)
0 −63.94 7 −26.91
1 −45.96 8 −25.06
2 −39.79 9 −22.42
3 −35.51 10 −19.87
4 −32.22 11 −18.77
5 −30.94 12 −16.32
6 −29.12 13 −15.47


The survival probabilities obtained using the fwhm = 1.5 ps probe pulse to reach different (E, v = 6, n) resonant states are displayed in Fig. 4. The figure shows that by moving from n = 0 to n = 1 and 2, the intensity of the survival probability (very similar for n = 1 and 2) drops by a factor of ∼41. For n ≥ 3, the intensity of the curves gradually increases again. When the (E, v = 6, n = 0) resonance is chosen, only this state is populated by the probe laser and, in addition, the overlap between the (B, v′ = 27, n′ = 0) resonance and the (E, v = 6, n = 0) one is maximum, because the two ground resonance wave functions have a very similar shape, without nodes. On the other hand, the orbiting resonance ψ2, with several nodes, is expected to have a much smaller overlap with the (E, v = 6, n = 0) state. This explains the high intensity of the n = 0 survival probability in Fig. 4, and the practically complete coincidence of this curve with the I1(t) one obtained using eqn (3) (see Fig. 3), meaning that essentially only the ψ1 survival probability is detected when using (E, v = 6, n = 0).


image file: c4ra09884f-f4.tif
Fig. 4 Survival probabilities calculated using the fwhm = 1.5 ps probe pulse and different (E, v = 6, n) resonant states.

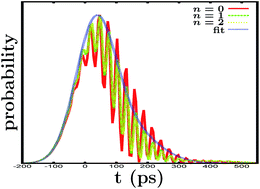
The dramatic decrease in intensity, found for the first (E, v = 6, n > 0) resonant states, appears to indicate that something different from the ψ1 survival probability is detected. The normalized survival probabilities of Fig. 5 show that when moving from n = 0 to n = 1 and 2, the intensity increases for shorter times t < 50 ps and decreases for longer times t > 50, leading to an effective reduction of the associated lifetime. By fitting the very similar n = 1 and 2 survival probabilities with a convolution function of the type of eqn (5) (see Fig. 5), a lifetime of τ = 40 ps is obtained. This lifetime is nearly half the 75 ps lifetime associated with the ψ1 survival probability probed for the n = 0 state.


image file: c4ra09884f-f5.tif
Fig. 5 Comparison of the survival probabilities obtained with the n = 0, 1, and 2 states, using the fwhm = 1.5 ps probe pulse, and a fitting function to the n = 1 and 2 curves. The curves are normalized to the same quantity.

As previously described,24 the ΦB(t) wave packet is expanded on the basis of the vibrational states of the Br2(B) diatomic subunit. This expansion of ΦB(t) is very well suited to carry out some test calculations that can provide additional information about which resonance (ψ1 or ψ2) is mostly contributing to the survival probabilities probed with the (E, v = 6, n) states when n = 0, 1, and 2. Indeed, instead of exciting the whole wave packet ΦB(t) to the (E, v = 6, n) resonant state with the probe pulse, one can excite only the ΦB(t) components associated either with the v′ or the v′ − 1 vibrational manifold, and obtain the corresponding v′ and v′ − 1 partial survival probabilities. In a zeroth order representation the ψ1 resonance corresponds to the v′ vibrational manifold, while ψ2 corresponds to the v′ − 1 manifold. Actually, (in a non-zeroth order representation) the two overlapping resonances have contributions to both v′ and v′ − 1 manifolds. However, for a weak overlapping regime as the present one, one can assume the zeroth order description to be good enough, which implies that the v′ and v′ − 1 partial survival probabilities would be associated with the ψ1 and ψ2 resonances, respectively. Thus, each partial survival probability would give an indication of the contribution of each resonance to the total survival probability probed with the different (E, v = 6, n) resonant states.

When the v′ and v′ − 1 partial survival probabilities are calculated using the (E, v = 6, n = 0) resonant state, it is found that the v′ partial survival probability practically matches the corresponding total survival probability, while the v′ − 1 partial survival probability is about three orders of magnitude smaller. This result further confirms the previous finding that the ψ1 resonance is the only one with significant overlap with the (E, v = 6, n = 0) resonant state. The v′ − 1 partial survival probability obtained in the case of (E, v = 6, n = 2) is displayed in Fig. 6 along with the corresponding total survival probability. They present the opposite behavior to that found for n = 0, with the v′ − 1 partial probability as the dominant contribution, which accounts for most of the intensity of the total survival probability. A similar result is found when the (E, v = 6, n = 1) resonant state is used. This result indicates that the n = 1 and 2 resonant states probe mostly the v′ − 1 components of the ΦB(t) wave packet, and only a small contribution of the v′ components. Correspondingly, the total survival probabilities detected with the (E, v = 6, n = 1, 2) resonant states would probe mainly the ψ2 resonance.


image file: c4ra09884f-f6.tif
Fig. 6 Total survival probability and partial survival probability corresponding to the v′ − 1 vibrational manifold of the ΦB(t) wave packet, obtained with the (E, v = 6, n = 2) resonant state, using the fwhm = 1.5 ps probe pulse. See the text for details.

On the other hand, simulations using the Epump(t) field with A1 = 0 (i.e., exciting only the resonance ψ2 under essentially isolated resonance conditions), produce a survival probability with an associated lifetime of τ = 13.5 ps. This lifetime is consistent with the width Γ = 0.42 cm−1, previously estimated for this resonance.22 It is noted that the lifetime τ = 40 ps associated with the n = 1 and 2 survival probabilities is nearly 3 times the lifetime τ = 13.5 ps of the ψ2 resonance (in the absence of the ψ1 population), which is the same for the lifetime τ = 75 ps of the n = 0 survival probability that is ∼3 times the ψ1 resonance lifetime of 23.5 ps (in the absence of the ψ2 population). This result further supports that the n = 1 and 2 survival probabilities would essentially correspond to the ψ2 resonance, due to a remarkably larger overlap of the (E, v = 6, n = 1, 2) states with the ψ2 wave function (expected to have several nodes) than with the ψ1 resonance.

The above results show that a suitable resonant state in terms of oscillator strength can be found in order to probe the survival probability and its associated control effects of a specific target resonance. In the present case, those resonant states are (E, v = 6, n = 0) to probe the signal of ψ1, and (E, v = 6, n = 1, 2) to probe the signal of the ψ2 resonance population. Experimental spectroscopic studies can be carried out for a general system in order to determine the most suitable resonant states to probe a specific target resonance.

Probing the survival probability by reaching the (E, v = 6, n ≥ 3) resonant states has also been explored. For n ≥ 3, the intensity of the survival probabilities obtained increases gradually and monotonically, becoming larger than the intensity of the curve found for n = 0, by a factor of ∼20 for n = 29 (the highest resonance of the (E, v = 6) vibrational manifold). Analysis in terms of the v′ and v′ − 1 partial survival probabilities shows that the intensity of the v′ partial survival probability vanishes fast, and the v′ − 1 partial survival probability becomes practically the same as the total survival probability (for n ≥ 11). Thus, as the n resonant state becomes higher, essentially only the v′ − 1 components of the ΦB(t) wave packet are probed. The large increase in intensity of the survival probability probed as n increases, suggests an increasing contribution of more and more asymptotic wave packet components describing the Br2(B, v′ − 1) + Ne products of the dissociation.

The normalized survival probabilities obtained with different (E, v = 6, n ≥ 3) resonant states are displayed in Fig. 7. As n increases, the behavior shown by the curves is a shift and a spreading towards longer times. This trend occurs rather slowly up to n ∼ 9, and becomes significantly more pronounced for higher n resonant states. For n ≥ 20, the survival probabilities detected seem to converge into the same, practically identical curve.


image file: c4ra09884f-f7.tif
Fig. 7 Survival probabilities calculated using the fwhm = 1.5 ps probe pulse and different (E, v = 6, n) resonant states. The curves have been normalized to the same quantity for the sake of comparison.

The behavior of the survival probabilities can be explained as follows. As the (E, v = 6, n) resonant states become higher in energy, the corresponding resonance wave functions become increasingly more spread out both in the radial and angular vdW modes, and sample larger regions of configuration space. As a result, the overlap between the (E, v = 6, n) states and the ΦB(t) wave packet becomes larger, mainly in the radial dissociation coordinate. This overlap occurs mainly with the v′ − 1 components of ΦB(t), populated after the Br2(B, v′)–Ne → Br2(B, v′ − 1) + Ne dissociation. An overlap with the vf < v′ − 1 components of ΦB(t) takes place to a much lesser extent because the population of these components is remarkably smaller. This explains that the total and the v′ − 1 partial survival probabilities become coincident as n increases. The population of the v′ − 1 components of ΦB(t) increases with time as the vibrational predissociation of the complex proceeds, and this is consistent with the monotonical increase of the survival probability with increasing n. In addition, as the ΦB(t) components probed by the increasingly higher (E, v = 6, n) states correspond to more and more separated Br2(B, vf < v′) + Ne products, it takes a longer time to populate these wave packet components, which causes the shifting of the survival probabilities to longer times. Thus, the (E, v = 6, n > 3) resonant states are suitable to probe the time evolution of the dissociating components of the wave packet.

Conclusions

In summary, this work shows for the first time that the signature and effects of control on the survival probability and lifetime of a specific overlapping resonance state can be probed in a typical time-resolved pump–probe experiment. The condition required is the existence of a resonant state having an appreciable overlap essentially only with the resonance probed, so that the contributions of the survival probability of other overlapping resonances can be avoided. Resonant states fulfilling these conditions are present in a variety of molecular and cluster systems, and can be found beforehand by means of spectroscopic studies.

It is also found that by choosing properly the resonant state reached with the probe pulse, it is possible to probe selectively different components of the wave packet prepared. In the present case, the lowest resonant state that can be reached within a given vibrational manifold allows one to probe the effects of control on the survival probability of one of the two overlapping resonances populated in the coherent superposition prepared, while the two first excited resonant states allow one to probe the survival probability of the other overlapping resonance. Resonant states higher in energy and more spread out in configuration space are suitable for probing the time evolution of the dissociating components of the wave packet.

Acknowledgements

This work was funded by the Spanish Ministerio de Ciencia e Innovación, Grant no. FIS2011-29596-C02-01, and the COST Action, Grant no. CM1002. The Centro de Supercomputación de Galicia (CESGA) is acknowledged for the use of its resources.

References

  1. S. A. Rice and M. Zhao, Optical Control of Molecular Dynamics, Wiley, New York, 2000 Search PubMed.
  2. M. Shapiro and P. Brumer, Principles of the Quantum Control of Molecular Processes, Wiley, New York, 2003 Search PubMed.
  3. M. Shapiro, J. Phys. Chem. A, 1998, 102, 9570 CrossRef CAS.
  4. P. Anfinrud, R. de Vivie-Riedle and V. Engel, Proc. Natl. Acad. Sci. U. S. A., 1999, 96, 8328 CrossRef CAS.
  5. E. Skovsen, M. Machholm, T. Ejdrup, J. Thϕgersen and H. Stapelfeldt, Phys. Rev. Lett., 2002, 89, 133004 CrossRef.
  6. C. Daniel, J. Full, L. González, C. Lupulescu, J. Manz, A. Merli, S. Vajda and L. Wöste, Science, 2003, 299, 536 CrossRef CAS PubMed.
  7. D. J. Tannor, R. Kosloff and S. Rice, J. Chem. Phys., 1986, 85, 5805 CrossRef CAS PubMed.
  8. R. J. Levis, G. M. Menkir and H. Rabitz, Science, 2001, 292, 709 CrossRef CAS PubMed.
  9. B. J. Sussman, D. Townsend, M. I. Ivanov and A. Stolow, Science, 2006, 314, 278 CrossRef CAS PubMed.
  10. O. Atabek, R. Lefebvre, M. Lepers, A. Jaouadi, O. Dulieu and V. Kokoouline, Phys. Rev. Lett., 2011, 106, 173002 CrossRef CAS.
  11. Z. Hu, S. Singha, Y. B. Zhao, G. E. Barry, T. Seideman and R. J. Gordon, J. Phys. Chem. Lett., 2012, 3, 2744 CrossRef CAS.
  12. M. P. A. Branderhorst, P. Londero, P. Wasylczyk, C. Brif, R. L. Kosut, H. Rabitz and I. A. Walmsley, Science, 2008, 320, 638 CrossRef CAS PubMed.
  13. M. Wellenhaupt, A. Assion, D. Liese, C. Sarpe-Tudoran, T. Baumert, S. Zamith, M. A. Boucheme, B. Girard, A. Flettner, U. Weichmann and G. Gerber, Phys. Rev. Lett., 2002, 89, 173001 CrossRef.
  14. H. Katsuki, H. Chiba, B. Girard, C. Meier and K. Ohmori, Science, 2006, 311, 1589 CrossRef CAS PubMed.
  15. A. García-Vela, J. Chem. Phys., 2012, 136, 134304 CrossRef PubMed.
  16. A. García-Vela, J. Phys. Chem. Lett., 2012, 3, 1941 CrossRef.
  17. A. García-Vela, Chem. Phys. Lett., 2013, 563, 30 CrossRef PubMed.
  18. A. García-Vela, J. Chem. Phys., 2013, 139, 134306 CrossRef PubMed.
  19. M. A. Taylor, J. M. Pio, W. E. van der Veer and K. C. Janda, J. Chem. Phys., 2010, 132, 104309 CrossRef PubMed.
  20. T. A. Stephenson and N. Halberstadt, J. Chem. Phys., 2000, 112, 2265 CrossRef CAS PubMed.
  21. A. García-Vela, J. Chem. Phys., 2007, 126, 124306 CrossRef PubMed.
  22. A. García-Vela, J. Chem. Phys., 2008, 129, 094307 CrossRef PubMed.
  23. J. A. Cabrera, C. R. Bieler, B. C. Olbricht, W. E. van der Veer and K. C. Janda, J. Chem. Phys., 2005, 123, 054311 CrossRef PubMed.
  24. A. García-Vela and K. C. Janda, J. Chem. Phys., 2006, 124, 034305 CrossRef PubMed.
  25. J. A. Cabrera, C. R. Bieler, N. McKinney, W. E. van der Veer, J. M. Pio and K. C. Janda, J. Chem. Phys., 2007, 127, 164309 CrossRef PubMed.
  26. T. Ishiwata, A. Tokunaga, T. Shinzawa and I. Tanaka, Bull. Chem. Soc. Jpn., 1984, 57, 1317 CrossRef CAS.

This journal is © The Royal Society of Chemistry 2014
Click here to see how this site uses Cookies. View our privacy policy here.