A novel ultra-thin catalyst layer based on wheat ear-like catalysts for polymer electrolyte membrane fuel cells

Changkun Zhangab, Hongmei Yu*a, Li Fuab, Yuan Gaoab, Jia Jiaab, Shangfeng Jiangab, Baolian Yia and Zhigang Shaoa
aFuel Cell System and Engineering Laboratory, Dalian National Laboratory for Clean Energy, Dalian Institute of Chemical Physics, Chinese Academy of Sciences, 457 Zhongshan Road, Dalian 116023, PR China. E-mail: hmyu@dicp.ac.cn
bUniversity of the Chinese Academy of Sciences, Beijing 100039, PR China

Received 4th September 2014 , Accepted 28th October 2014

First published on 29th October 2014


Abstract

Wheat ear-like catalysts were prepared on Co–OH–CO3 nanowires to design an ultra-thin catalyst layer (UTCL). Without any ionomers, the UTCL exhibited a maximum power density of 481 mW cm−2 at an ultra-low Pt loading of 43 μg cm−2Pt, resulting in a relatively high Pt utilization of 11.2 kW g−1Pt. It is expected that the nanostructured thin film materials will lead to further technological advancements in fuel cells and other applications.

Currently, extensive research has been carried out to realize the ultimate solution to the world energy demands. Great expectations are held for technologies such as fuel cells and lithium–air batteries that rely on electrochemical processes. Polymer electrolyte membrane fuel cells (PEMFCs) stand out as one of the most promising candidates, as they ensure clean energy under commercially viable operating conditions. However, high costs are still one of the major challenges for the commercialization of PEMFCs. In particular, one of the barriers is the high price and limited resource of platinum-based electrocatalysts which are widely used in PEMFCs.1 Numerous investigations have been carried out to improve the activity and durability of Pt for the oxygen reduction reaction (ORR) in PEMFCs.2,3 For instance, a series of binary Pt–M alloys with transition metals (M = Cr, Mn, Co, Ni) or the dealloying of some alloys of Pt, as well as the synthesis of platinum core–shell electrocatalysts, are routes to make Pt-based electrocatalysts more active than pure Pt electrocatalysts.4 An alternative strategy employed is to introduce 1D material such as Ag,5 Cu,6 and Ni7 nanowires (NWs) as the templates to form core–shell NW electrocatalysts. Supportless Pt and PtPd nanotubes templated from Ag NWs, as investigated by Yan and coworkers, showed a slightly higher mass activity and a 3.1 times higher specific activity than Pt/C.5 And PtPdCu and PtCu alloy nanoparticle nanotubes were fabricated by Li et al. using partially sacrificial Cu NWs as templates.6 Self-supporting, 1D, noble-metal-based materials may be potential materials to prevent aggregation or Ostwald ripening problems. However, it has been realized that the efficient utilization of Pt electrocatalysts in PEMFCs not only relies on the intrinsic catalytic activity of these electrocatalysts, but also strongly depends on the structure of the catalyst layer (CL) built up by the electrocatalysts.8 In the conventional CL, the 1D, supportless electrocatalysts or electrocatalysts on carbon powder have a disordered structure which hinders electron and proton transports, leading to a low Pt utilization efficiency. A unique nanostructured thin film (NSTF) electrode which consists of oriented nanometer-sized crystalline organic whiskers, can enhance the specific activity of the electrocatalysts.9,10 In this regard, an advanced CL that has high performance using ultra low platinum loading is in high demand for fuel cell applications. Middelman firstly proposed the ordered CL concept that was supposed to be able to maximize the utilization of catalysts and enhance the transport of reactants, electrons, and protons.11 Besides, carbon nanotubes (CNTs),12–14 carbon coated tin,15 TiO2 nanotube arrays16–18 and polypyrrole nanowires19 have been used to form an ordered CL.

Herein, we designed an ultra-thin catalyst layer (UTCL) with oriented 3D catalysts instead of conventional carbon based electrocatalysts. In the design, the key material is the 1D cobalt–hydroxide–carbonate (Co–OH–CO3) nanostructure. Co–OH–CO3 NWs are usually taken as the precursor of Co3O4 and have been successfully synthesized on a variety of substrates including transparent conducting glass, nickel foil, nickel foam, Ti, and Fe–Co–Ni alloy.20–22 In this work, we synthesized wheat ear-like structured electrocatalysts using Co–OH–CO3 NWs as the templates. The fabricated UTCL exhibited an enhanced performance at ultra-low Pt loading.

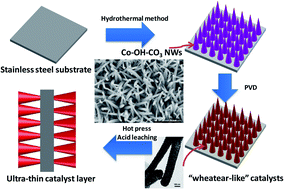
Fig. 1 schematically illustrates the fabrication process of UTCL for PEMFCs. In this method, a simple hydrothermal method was employed to synthesize Co–OH–CO3 NWs on a stainless steel substrate. Subsequently, Pd and Pt catalysts were deposited onto the Co–OH–CO3 NWs by a radio frequency (RF) magnetron sputtering system to form Co–OH–CO3–Pt and Co–OH–CO3–PdPt electrodes. Then the catalyst coated Co–OH–CO3 NW film was transferred completely from the stainless steel to both sides of a Nafion® membrane. Finally, the supportless Pt and PdPt catalysts were fabricated onto a Nafion® membrane via immersing the electrode into 50 mM H2SO4 solution to remove the Co–OH–CO3 NW template.


image file: c4ra09759a-f1.tif
Fig. 1 Illustration of the UTCL fabrication based on Co–OH–CO3 NWs.

The chemical reactions involved in the preparation process of Co–OH–CO3 NWs on stainless steel can be illustrated as follows:21

 
Co2+ + xF → CoFx(x−2)− (1)
 
H2NCONH2 + H2O → 2NH3 + CO2 (2)
 
CO2 + H2O → CO32− + 2H+ (3)
 
NH3·H2O → NH4+ + OH (4)
 
CoFx(x−2)− + 0.5(2 − y)CO32− + yOH + nH2O → Co(OH)y(CO3)0.5(2−y)·nH2O + xF (5)

At the beginning, Co2+ was coordinated with F to form CoFx(x−2)− in the homogeneous solution. As the temperature was ramped to 120 °C, the hydrolysis-precipitation process of urea took place at around 70 °C and a number of CO32− and OH were formed gradually, which could help to release Co2− slowly from CoFx(x−2)− in the solution. When the concentration of CO32− and OH anions in the solution increased, the further reaction led to the formation of a nucleus. The nucleus was prone to form on the stainless steel substrates’ surfaces rather than in the aqueous solution, F in the solution has played a crucial role throughout the preparation process.21,23

Fig. 2 shows the XRD patterns of the prepared Co–OH–CO3 and Co–OH–CO3–Pt samples. There are characteristic diffraction peaks of Co–OH–CO3 at 16.9°, 33.5° and 34.8°, which are assigned to the (020), (221) and (040) faces. The XRD patterns are consistent with the value in the standard card (JCPDS Card no. 048-0083). No other peaks of impurities are observed. Co–OH–CO3 NWs are rhombic oxide. The diffraction peaks at 39.7°, 46.7°, 68.1° and 81.9° are assigned to Pt (111), (200), (220) and (311) faces which indicates that the sputtered Pt catalysts are polycrystalline. Besides, the peaks of the stainless steel substrate are also detected.


image file: c4ra09759a-f2.tif
Fig. 2 The XRD patterns of Co–OH–CO3 and Co–OH–CO3–Pt.

Fig. 3a and 4a show the FESEM and TEM images of Co–OH–CO3 NWs. From the FESEM image, Co–OH–CO3 NWs were found directly grown on the stainless steel substrate. Gathered Co–OH–CO3 NWs with a relatively high density are obviously observed. From the TEM image of Co–OH–CO3 NWs in Fig. 4a, each nanowire exhibits a conical structure and the diameter is around 80 nm at the bottom, the single nanowire is about 4 μm along the length direction.


image file: c4ra09759a-f3.tif
Fig. 3 (a and b) FESEM images of Co–OH–CO3 NWs and the Co–OH–CO3–Pt electrode; (c and d) FESEM images of Co–OH–CO3–PdPt electrodes.

image file: c4ra09759a-f4.tif
Fig. 4 (a–c) TEM images of Co–OH–CO3 NWs, Co–OH–CO3–Pt and Co–OH–CO3–PdPt; (d) TEM image of Co–OH–CO3–PdPt after acid leaching.

Fig. 3b–d and 4b–d show the morphologies of Co–OH–CO3–Pt and Co–OH–CO3–PdPt electrodes. After sputtering deposition, the Co–OH–CO3 NWs are decorated with catalysts. Along with the catalyst loading increasing, the conical structure has changed to nanorods which can be found on the Co–OH–CO3–PdPt electrode (Fig. 3c) clearly with area number densities of 3 to 4 billion cm−2.

From the TEM images of the electrodes in Fig. 4b, Co–OH–CO3 NWs are decorated with 2–3 nm Pt catalysts after the sputtering deposition. The deposited catalysts grow as thin films on oriented Co–OH–CO3 NWs in Fig. 4b and c. From the XRD analysis, the sputter deposited thin film catalysts appear as polycrystalline layers. Along with the catalyst loading increasing, within the thin film catalysts, oriented small whiskers are formed on the Co–OH–CO3 NW sides. It can be seen that the catalyst small whiskers are oriented at an angle of about 68 ± 2° w.r.t. the whisker axis, which is similar with the angle between the (111) crystal planes in cubic lattices, namely 70.53°. According to the analysis in the SEM and TEM images of the Co–OH–CO3–PdPt electrode, the Co–OH–CO3–PdPt exhibits a “wheat ear-like” structure in which catalyst small whiskers could be taken as grains of wheat.

Fig. 4d shows the TEM image of the Co–OH–CO3–PdPt electrode after acid leaching in 50 mM H2SO4. It was found that Co–OH–CO3 was removed by acid, only <0.1% Co element could be tested by inductively coupled plasma atomic emission spectrometry (ICP-AES). The catalyst has changed to the hollow thin film structure that could be taken as transport of electrons in CL. Fig. 6 shows the SEM images of the prepared UTCL. The thickness of the prepared UTCL is about 300 nm.


image file: c4ra09759a-f5.tif
Fig. 5 X-ray photoelectron spectroscopy (XPS) spectra for Pt 4f of Co–OH–CO3–PdPt.

image file: c4ra09759a-f6.tif
Fig. 6 (a) SEM image of the Co–OH–CO3–PdPt electrode after transfer onto the Nafion®212 membrane; (b) SEM image of the UTCL based on the Co–OH–CO3–PdPt electrode.

Fig. 5 shows the Pt 4f XPS spectra for the Co–OH–CO3–PdPt electrode. The most intense peak (71.4 eV) of Pt 4f7/2 is assigned to metallic Pt(0). The second peak is assigned to Pt(II) as in PtO and Pt(OH)2, and the third one is assigned to Pt(IV). The binding energy of Pt 4f7/2 for Co–OH–CO3–PdPt was slightly shifted to the positive direction in comparison with that of the referenced bulk Pt(0) (70.9 eV). The slight shift in the bulk metallic Pt(0) to higher binding energies may be attributed to a significant contribution from the interaction between Pt catalysts and the support.

The UTCL exhibits a better performance than the CL without the acid leaching procedure. In Fig. S1, without acid leaching, the cell shows low performance, even after a 10 mA cm−2 activation for 24 h. On the other hand, the ionomer in the conventional CL serves as a binder and proton conductor, and it improved the catalyst utilization.24 Nevertheless, the ionomer was skipped for the UTCL in this study. In addition, although there were no ionomers in the UTCL, the performance did not decrease because of the thin film catalysts and short diffusion pathway of the thinner CL.

Fig. 7 shows the IV curves of membrane electrode assembly (MEA) based on different UTCLs. The maximum power density of the different MEAs based on Co–OH–CO3–Pt and Co–OH–CO3–PdPt electrodes are 298 and 337 mW cm−2, respectively. According to the cyclic voltammetry (CV) curves of the MEAs (Fig. S2), the electrochemical surface areas (ECSAs) of the catalysts are 54.6 m2 g−1Pt for Co–OH–CO3–Pt and 67.3 m2 g−1Pt+Pd for Co–OH–CO3–PdPt, respectively.


image file: c4ra09759a-f7.tif
Fig. 7 IV curves of the UTCL based on Co–OH–CO3–Pt and Co–OH–CO3–PdPt electrodes. (Testing conditions: active area 1 cm2, 65 °C; gas flow rate of H2/O2 was 15/70 sccm; H2/O2 gases were externally humidified at the dew point temperature of 65 °C. Pt and Pd loading are 43 and 24 μg cm−2.)

For comparison, an electrode with Pt catalysts directly sputtered onto a gas diffusion layer (GDL) also served as the anode and the cathode in a MEA. The SEM images of the GDL and GDL-Pt electrodes in Fig. S3 show that deposited Pt catalysts with a diameter of around 60 nm aggregated on the GDL. Although the Pt loading at GDL–Pt is 0.12 mg cm−2, which is 2.8 times higher than Co–OH–CO3–PdPt, the MEA based on the GDL–Pt electrode has a low performance, and the maximum power density is only 185 mW cm−2, as shown in Fig. S4. It is shown that the MEAs based on the UTCL at ultra-low Pt loading exhibit an enhanced performance.

The performance of the novel UTCL was compared with the traditional MEA further. Fig. 8a shows the IV curves of the UTCL and traditional MEA. The maximum power of the UTCL can reach 8.9 kW g−1Pt, which is about 2.5 times the traditional MEA. Taking into account the meso-scale structure of the novel CL without any ionomers, it is suggested that ionomers might not be indispensable for the MEA with UTCL. The maximum power density of the UTCL is 481 mW cm−2, as shown in Fig. 8b, corresponding to an overall specific power of 11.2 kW g−1Pt, which compares favourably to the performance of commercially available MEA.


image file: c4ra09759a-f8.tif
Fig. 8 (a) IV curves of the UTCL based on the Co–OH–CO3–PdPt electrode and traditional MEA at 0.05 MPa; (b) IV curves of the UTCL based on the Co–OH–CO3–PdPt electrode at 0.1 MPa. (Test conditions: active area 5 cm2, 65 °C; the gas flow rate of H2/O2 was 60/200 sccm; H2/O2 gases were externally humidified at the dew point temperature of 65 °C, respectively. Pt and Pd loadings are 43 and 24 μg cm−2 for the Co–OH–CO3–PdPt electrode; Pt loading is 150 μg cm−2 for the traditional MEA.)

Conclusions

In summary, an UTCL with an oriented 3D wheat ear-like structure catalysts was designed using Co–OH–CO3 NWs as the templates. Without ionomers as proton conductors, the fabricated UTCL exhibited enhanced performance at ultra-low Pt loading. The UTCL displayed a maximum power density of 481 mW cm−2 with a Pt loading of 43 μg cm−2Pt, resulting in a relatively high Pt utilization of 11.2 kW g−1Pt. The results in this work provide convincing evidence that nanostructured thin film catalysts are promising for the application of fuel cells and other energy devices.

Experimental section

The synthesis of Co–OH–CO3 NWs was based on a hydrothermal method. The solution was prepared by dissolving 1.5 mM of Co(NO3)2, 3 mM NH4F and 7.5 mM of CO(NH2)2 in distilled water. Then this solution was transferred into a Teflon-lined stainless steel autoclave liner. The stainless steel substrate was immersed into the reaction solution. The liner was sealed in a stainless steel autoclave and maintained at 120 °C for 5 h and then cooled to room temperature. The samples were collected and rinsed with distilled water several times.

The catalysts were deposited on Co–OH–CO3 NWs using the radio frequency (RF) sputtering method. The RF sputtering process was performed with a radio frequency magnetron sputtering system. During the sputtering process, the input power for the sputter cathode was 120 W and the Ar gas pressure was 0.8 Pa. For the Co–OH–CO3–Pt electrode, the samples were subject to the Pt plasma directly. For the Co–OH–CO3–PdPt electrode, Pd catalysts were firstly deposited onto Co–OH–CO3 NWs, and then Pt catalysts were deposited. The loading of Pd and Pt are the same for all samples. For comparison, Pt nanoparticles were also deposited onto one side of the gas diffusion layer (GDL) directly and Pt loading was 0.12 mg cm−2.

The electrodes were hot-pressed onto both sides of a Nafion® membrane. And then the UTCLs were prepared by immersing the electrodes into 50 mM H2SO4 for 5 h to remove Co–OH–CO3. The membrane electrode assembly (MEA) was pressed at 140 °C, 0.25 MPa for 1 min. For the traditional MEA, 40% Pt–C catalysts (John Matthey, JM) were brushed onto the GDL with Pt loading at 150 μg cm−2, and the Nafion® ionomer loading is the same as carbon.

The morphology of the samples was characterized by field emission scanning electron microscopy (FESEM, Hitachi S-4800) and transmission electron microscopy (TEM, JEM2010-HR, 120 KV). The phase and composition of the samples were investigated via X-ray diffraction (XRD, Bruker, D8 ADVANCE) with a Cu Kα radiation (λ = 1.5418 Å). The catalyst loadings of the electrodes were measured by inductively coupled plasma atomic emission spectrometry (ICP-AES) on Leeman Plasma-Spec-I equipment. X-ray Photoelectron Spectroscopy (XPS, Thermo Scientific ESCA Lab250 Xi spectrometer) with Al Kα radiation in twin anode. For the XPS spectra, the binding energy was calibrated using the C 1s photoelectron peak at 284.6 eV as the reference.

During the fuel cell test, the cell temperature was 65 °C and the humidification temperature was 65/65 °C for H2/O2. A KFM 2030 Impedance Meter (Kikusui, Japan) was used for the test of the IV curves. The electrochemical surface area (ECSA) of the MEAs was evaluated by CV curves. Before CV measurements, the cathode of the fuel cell was purged by N2 until the cell voltage was below 0.1 V and the CV curves were measured at a scan rate of 50 mV s−1.

Acknowledgements

This work was financially supported by the National Basic Research Program of China (973 program no. 2012CB215500), the National High Technology Research and Development Program of China (863 Program no. 2012AA052002), and the National Natural Science Foundations of China (no. 21176234, no. 2087614).

Notes and references

  1. E. A. Ticianelli, C. R. Derouin, A. Redondo and S. Srinivasan, J. Electrochem. Soc., 1988, 135, 2209 CrossRef CAS PubMed.
  2. W. Yuan, Y. Tang, X. Yang and Z. Wan, Appl. Energy, 2012, 94, 309 CrossRef CAS PubMed.
  3. H. Zhang and P. K. Shen, Chem. Rev., 2012, 112, 2780 CrossRef CAS PubMed.
  4. Z. Liu, L. Ma, J. Zhang, K. Hongsirikarn and J. G. Goodwin, Catal. Rev. Sci. Eng., 2013, 55, 255 CAS.
  5. Z. Chen, M. Waje, W. Li and Y. Yan, Angew. Chem., Int. Ed., 2007, 46, 4060 CrossRef CAS PubMed.
  6. H.-H. Li, C.-H. Cui, S. Zhao, H.-B. Yao, M.-R. Gao, F.-J. Fan and S.-H. Yu, Adv. Energy Mater., 2012, 2, 1182 CrossRef CAS.
  7. C.-H. Cui, H.-H. Li and S.-H. Yu, Chem. Sci., 2011, 2, 1611 RSC.
  8. A. Ohma, T. Mashio, K. Sato, H. Iden, Y. Ono, K. Sakai, K. Akizuki, S. Takaichi and K. Shinohara, Electrochim. Acta, 2011, 56, 10832 CrossRef CAS PubMed.
  9. M. K. Debe, J. Electrochem. Soc., 2013, 160, F522 CrossRef CAS PubMed.
  10. M. K. Debe, Handb. Fuel Cells, 2003, 3, 576 Search PubMed.
  11. E. Middelman, Fuel Cells Bull., 2002, 2002, 9 CrossRef.
  12. Z. Q. Tian, S. H. Lim, C. K. Poh, Z. Tang, Z. Xia, Z. Luo, P. K. Shen, D. Chua, Y. P. Feng, Z. Shen and J. Lin, Adv. Energy Mater., 2011, 1, 1205 CrossRef CAS.
  13. W. Zhang, A. I. Minett, M. Gao, J. Zhao, J. M. Razal, G. G. Wallace, T. Romeo and J. Chen, Adv. Energy Mater., 2011, 1, 671 CrossRef CAS.
  14. W. Zhang, J. Chen, A. I. Minett, G. F. Swiegers, C. O. Too and G. G. Wallace, Chem. Commun., 2010, 46, 4824 RSC.
  15. M. S. Saha, R. Li, M. Cai and X. Sun, J. Power Sources, 2008, 185, 1079 CrossRef CAS PubMed.
  16. C. Zhang, H. Yu, Y. Li, Y. Gao, Y. Zhao, W. Song, Z. Shao and B. Yi, ChemSusChem, 2013, 6, 659 CrossRef CAS PubMed.
  17. C. Zhang, H. Yu, Y. Li, W. Song, B. Yi and Z. Shao, Electrochim. Acta, 2012, 80, 1 CrossRef CAS PubMed.
  18. C. Zhang, H. Yu, Y. Li, L. Fu, Y. Gao, W. Song, Z. Shao and B. Yi, Nanoscale, 2013, 5, 6834 RSC.
  19. Z. X. Xia, S. L. Wang, Y. J. Li, L. H. Jiang, H. Sun, S. Zhu, D. S. Su and G. Q. Sun, J. Mater. Chem. A, 2013, 1, 491 CAS.
  20. J. Jiang, J. Liu, R. Ding, J. Zhu, Y. Li, A. Hu, X. Li and X. Huang, ACS Appl. Mater. Interfaces, 2011, 3, 99 CAS.
  21. X. Xia, J. Tu, Y. Zhang, X. Wang, C. Gu, X. Zhao and H. Fan, ACS Nano, 2012, 6, 5531 CrossRef CAS PubMed.
  22. X. Xia, J. Tu, Y. Zhang, J. Chen, X. Wang, C. Gu, C. Guan, J. Luo and H. J. Fan, Chem. Mater., 2012, 24, 3793 CrossRef CAS.
  23. J. Jiang, J. P. Liu, X. T. Huang, Y. Y. Li, R. M. Ding, X. X. Ji, Y. Y. Hu, Q. B. Chi and Z. H. Zhu, Cryst. Growth Des., 2010, 10, 70 CAS.
  24. S. G. M. S. Wilson, J. Appl. Electrochem., 1992, 22, 7 CrossRef.

Footnote

Electronic supplementary information (ESI) available. See DOI: 10.1039/c4ra09759a

This journal is © The Royal Society of Chemistry 2014
Click here to see how this site uses Cookies. View our privacy policy here.