 Open Access Article
Comparison of acidic site quantification methods for a series of nanoscopic aluminum hydroxide fluorides†
Felix
Hemmann
ab,
Christian
Jaeger
b and
Erhard
Kemnitz
*a
aHumboldt-Universität zu Berlin, Department of Chemistry, Brook - Taylor - Str. 2, D - 12489 Berlin, Germany. E-mail: felix.hemmann@bam.de; erhard.kemnitz@chemie.hu-berlin.de
bBAM Federal Institute for Materials Research and Testing, Division 1, Richard Willstaetter Str. 11, D-12489 Berlin, Germany. E-mail: christian.jaeger@bam.de
First published on 3rd November 2014
Abstract
Quantitative determination of acidic surface sites is highly important for the characterization of solid acids because the activity of a catalyst is often related to the concentration of these sites. A recently developed method using 15N Nuclear Magnetic Resonance spectroscopy (NMR) for the quantification of acidic Lewis and Brønsted sites has been tested for a series of nanoscopic aluminum hydroxide fluorides. Comparison with other methods for the quantitative determination of acidic sites shows that this 15N NMR quantification method is a promising technique for the comprehensive investigation of acidic sites. Three different acidic sites, one Brønsted and two Lewis sites, can be distinguished by their 15N chemical shifts of pyridine and simultaneously quantified under conditions corresponding to catalytic reaction conditions. Determination of the individual concentrations of acidic sites allows further insight into the catalytic process. It was found that the concentration of Brønsted sites correlates with catalyzed conversion of citronellal to isopulegol in the investigated series of catalysts. Additionally, investigations indicate that one of the Lewis sites become blocked during the reaction of citronellal.
1. Introduction
Solid acids are a widely used class of catalysts for petrochemical processes. Related to the concepts of green chemistry of avoiding waste and toxic by-products, solid acidic catalysts become increasingly important for the production of fine, specialty and pharmaceutical chemicals.1–3 The catalytic activity of these catalysts is related to acidic Lewis (LS) and/or Brønsted (BS) sites on their surfaces, and the Turnover Frequency (TOF) of a reaction can often be related to the concentration of these acidic sites. Therefore, the quantitative determination of acidic sites and the ratio between different Lewis and Brønsted sites are highly important for the characterization of solid acids.The most common method to determine concentrations of acidic sites is Temperature Programmed Desorption (TPD) of a basic probe molecule, mostly ammonia.4–6 There are many reasons why TPD is often used: quantification results are reproducible, the implementation of the experiment is simple, and acidic sites of different acid strength can be distinguished. In principle, also the acid strength of acidic sites can be determined by TPD. However, it is often not clear how ammonia is adsorbed at a surface, and different kinds of adsorption sites (Lewis and Brønsted sites) can be hardly distinguished. Juskelis et al.7 showed that ammonia even adsorbs on calcium oxide, a solid base, probably due to weak Lewis acidic calcium sites. Furthermore, it has been reported4,6 that the heat of desorption and thereby the determination of the acid strength is not straightforward as the desorption temperature depends on the ratio of sample weight and flow rate of the carrier gas. Gorte et al.4,5,8 proposed the application of alkyl amines as probe molecules in contrast to ammonia. Alkyl amines, which are protonated by Brønsted sites, decompose by Hofmann elimination into ammonia and an olefin. Due to the decomposition of the alkyl amine, Brønsted sites can be easily distinguished from Lewis sites and quantified.
However, the temperature treatment during TPD experiments, which is necessary for desorption or the Hofmann elimination, can be a serious disadvantage in the quantification of acidic sites. In particular, for catalysts that are active at moderate temperatures,9–12 the temperature treatment can lead to dehydroxylation and dehydration and, therefore, decomposition or at least alteration of the catalyst.
In order to avoid the temperature treatment during the quantification of acidic sites, other methods including titration methods as catalyst poisoning13,14 and microcalorimetry,15,16 X-ray photoelectron,17,18 Fourier Transformed Infrared (FTIR)19–23 or Nuclear Magnetic Resonance (NMR)24–28 spectroscopy have been used to determine numbers of Lewis and Brønsted acidic sites in solids using different probe molecules.4,5 Especially solid state NMR is a unique technique for the characterization of solid acids and excellent reviews have been published from Brunner and Pfeifer,24 Jiang et al.25 and Zheng et al.26
Pyridine is an often used probe molecule in FTIR as well as in solid state NMR spectroscopy because it can be used qualitatively to distinguish Lewis and Brønsted sites and also quantitatively to determine concentrations of acidic sites. While qualitative results can be obtained easily with both methods, quantitative investigations are often difficult. In FTIR spectroscopy the determination of molar extinction coefficient is challenging,29,30 and in NMR studies mostly cross polarization and titration of pyridine is applied.31–34
The use of cross polarization can lead to large errors since the intensity of signals strongly depends on the efficiency of cross polarization. We recently reported a time-optimized technique, which uses 15N single pulse spectra for the quantification of acidic sites with pyridine.27 The aim of the present article is to show the advantages of this 15N NMR technique in comparison with other quantification methods such as FTIR spectroscopy, Partially Catalyst Poisoning (PCP) and NH3-TPD.
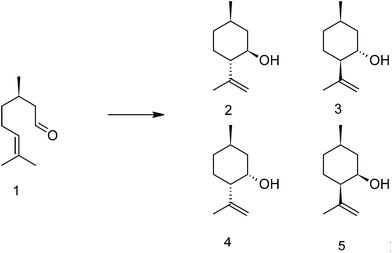
The four quantification methods were tested for a series of aluminum hydroxide fluoride catalysts. This series of uniform catalysts was chosen to ensure that the acid strengths of the acidic sites are about the same in each catalyst while the concentration of acidic sites can differ between them. To use of catalysts with acidic sites of about the same acid strengths is important to ensure that the sites can be quantified with the same sensitivity in all catalysts. Aluminum hydroxide fluorides were synthesized according to the fluorolytic sol–gel synthesis35 and further assigned to AlF45, AlF57, AlF75 and AlF87 corresponding to the concentration of the aqueous hydrofluoric acid used in the synthesis. They show bi-acidic properties (Lewis and Brønsted sites) and are catalytically active in the cyclization of citronellal to isopulegol (Scheme 1) at low temperature.36 This reaction requires the presence of both, Lewis and Brønsted acidic sites on the surface.37 Aluminum hydroxide fluorides are mesoporous materials, which exhibit high surface areas and particle sizes in the nanoscale range.11 Previous studies using 27Al und 19F NMR11,12 had shown that samples synthesized with a stoichiometric amount of HF (F![[thin space (1/6-em)]](https://www.rsc.org/images/entities/char_2009.gif) :
:![[thin space (1/6-em)]](https://www.rsc.org/images/entities/char_2009.gif) Al = 3) consist of aluminum atoms that are octahedrally coordinated by mostly fluorine with a small amount of OH groups which are introduced due to the presence of different amount of water in the HF. Thus, by varying the water content of the HF employed in the synthesis the F to OH ratio can be tuned, and consequently also the ratio of Lewis to Brønsted sites changes.
Al = 3) consist of aluminum atoms that are octahedrally coordinated by mostly fluorine with a small amount of OH groups which are introduced due to the presence of different amount of water in the HF. Thus, by varying the water content of the HF employed in the synthesis the F to OH ratio can be tuned, and consequently also the ratio of Lewis to Brønsted sites changes.
Concentrations of acidic sites obtained by the four quantification methods NH3-TPD, PCP, FTIR and NMR spectroscopy were correlate with the catalytic activity of the catalyst samples in the cyclization of citronellal to isopulegol. For this purpose, TOFs were calculated.
2. Experimental
2.1. Preparation of the catalysts
Aluminum isopropoxide (7.3 g, 36 mmol) was dissolved in 150 ml dry tetrahydrofuran. Then, aqueous hydrofluoric acid (in four different concentrations 45, 57, 75 and 87 wt%) was slowly added in molar ratios Al![[thin space (1/6-em)]](https://www.rsc.org/images/entities/char_2009.gif) :
:![[thin space (1/6-em)]](https://www.rsc.org/images/entities/char_2009.gif) F = 1
F = 1![[thin space (1/6-em)]](https://www.rsc.org/images/entities/char_2009.gif) :
:![[thin space (1/6-em)]](https://www.rsc.org/images/entities/char_2009.gif) 3 whilst stirring at room temperature. Concentration of the hydrofluoric acid was checked by titration. The resulting sol was further stirred for 6 h followed by the removal of the solvent, formed isopropanol and water under reduced pressure. The final product was dried at 423 K under vacuum for 2 h. To avoid changes of the sample and adsorption of water, it was transferred in Schlenk flasks immediately into a glove box and stored there.
3 whilst stirring at room temperature. Concentration of the hydrofluoric acid was checked by titration. The resulting sol was further stirred for 6 h followed by the removal of the solvent, formed isopropanol and water under reduced pressure. The final product was dried at 423 K under vacuum for 2 h. To avoid changes of the sample and adsorption of water, it was transferred in Schlenk flasks immediately into a glove box and stored there.
The samples are assigned as AlFC whereby C indicates the wt% of the used hydrofluoric acid.
2.2. NH3-TPD experiments
For the temperature programmed desorption of ammonia (NH3-TPD) the samples were pretreated at 573 K for 2 h. Afterwards, ammonia was adsorbed onto the surface of the samples at 393 K. Ammonia desorption was monitored during TPD (10 K min−1 up to 573 K) by FTIR detection of the band at 930 cm−1 (FTIR system 2000, Perkin-Elmer). The total amount of desorbed ammonia was determined by reaction with a diluted solution of sulfuric acid and titration with sodium hydroxide.2.3. BET experiments
Surface area measurements were performed on a Micromeretics ASAP 2020 at 77 K by adsorption and desorption of nitrogen. Before the measurement, the solids were degassed at 423 K and 5 × 10⁻⁵ mbar for twelve hours. Isotherms were processed by the Brunauer–Emmett–Teller method (BET).2.4. Catalyst testing and PCP experiments
For the carbonyl-ene-reaction of citronellal to isopulegol 20 mg of catalyst was weighed in a centrifuge tube and pretreated at 423 K for 2 h in vacuum. Afterwards, freshly prepared educt mixture (3.0 ml toluene, 0.3 ml (1.6 mmol) citronellal, 0.15 ml undecane (internal standard)) was added. For the Partially Catalysts Poisoning experiments (PCP) some μl of pyridine were added, additionally. The reaction was performed for 6 h at 353 K and 600 rpm in an Eppendorf Thermomixer comfort. The resulting mixture was cooled down, the catalysts were separated with a syringe filter and the reaction mixture was analyzed by gas chromatography. For further information see ref. 36. The calculation of the concentrations of acidic sites is described in the ESI.†2.5. FTIR experiments
For the FTIR experiments about 10–15 mg of sample was pressed in a self-supporting disc in air. The disc was placed in a quartz cell equipped with KBr windows. Before starting adsorption and FTIR analysis the samples were heat treated at 423 K in vacuum for 2 h. After that samples were cooled to room temperature. Addition of known increments of probe molecule pyridine in the cell was possible via a calibrated volume connected to the quartz cell. Pressure of the probe molecule was controlled by a pressure gauge. FTIR spectra were taken at room temperature on a Nicolet iS10 FTIR spectrometer of Thermo Fisher Scientific Inc. Data analysis was performed with the spectrometer software Omnic 8.1. Presented spectra are difference spectra, i.e., the spectrum recorded before adsorption of pyridine was subtracted from spectra taken with pyridine adsorption.2.6. NMR experiments
For the NMR measurements, 250 mg of the sample was weighted in a Schlenk flask, pretreated at 423 K for 2 h in vacuum followed by adsorption of 15N-pyridine by exposing the sample to gas-phase saturated with 15N-pyridine (15N enrichment 98%) for 1 h. After that, the sample was evacuated for 1 h at room temperature. Rotors for magic angle sample spinning (MAS) NMR experiments were carefully filled in the glove box to avoid adsorption of water. The rotors were filled with a mixture of 200 mg of sample and 40 mg of NH4Cl (15N enrichment 7%) as internal standard for the quantitative measurements.Solid-state NMR experiments were performed on a Bruker Avance 600 spectrometer (14.1 T). All experiments were carried out at room temperature using a 7 mm magic angle sample-spinning (MAS) probe for solid-state NMR experiments. Proton decoupling was carried out with a 15° two pulse phase modulation (TPPM) sequence.38 Data analysis was performed with the software TopSpin 2.1 (and 3.0). DmFit was used for line fits.39
15N MAS NMR spectra were recorded using the EASY method40 for removing acoustic ringing at a Larmor frequency of 60.8 MHz. The MAS frequency was 6 kHz. The 15N 90° pulse length was 6.2 μs. The repetition time was set to 70 s. 15N chemical shifts (δ) are reported relative to CH3NO2 with NH4Cl as the secondary standard (δ = −341 ppm).41
Finally, 1H–15N CPMAS (cross-polarization with magic angle sample spinning) experiments are needed for the determination of the T1 correction factors of the time optimized 15N MAS NMR spectra using the Torchia method.42 Details are described elsewhere.27 The sample spinning frequency was 6 kHz and spectra were recorded using a 1H 90° pulse length of 6.5 μs, a contact time of 2 ms, and a repetition time of 3 s. The 15N spin lock field was held constant while the 1H spin lock field was ramped down to 50% of its initial value.
3. Results and discussion
3.1. Catalytic performance in the cyclization of citronellal
The reaction of citronellal to isopulegol was used to test the activity of the catalysts. Measured conversions of citronellal (1) and selectivities to isopulegols (sum of 2, 3, 4 and 5, Scheme 1) after 6 h reaction are shown in Table 1. The conversions of citronellal increase from AlF45 to AlF75 and decrease again for AlF87, whereas the selectivity to isopulegols is about 55–70% and increases slightly from AlF45 to AlF87. Selectivity to the desired diastereoisomer of isopulegol (2) was over 60% for all samples.| Sample | Conversion of citronellal [%] | Selectivity to isopulegol [%] | TOF [mmol g−1 h−1] | BET surface area [m2 g−1] |
|---|---|---|---|---|
| AlF45 | 15 | 56 | 1.5 ± 0.1 | 53 |
| AlF57 | 51 | 66 | 3.8 ± 0.6 | 174 |
| AlF75 | 83 | 64 | 9.6 ± 0.8 | 275 |
| AlF87 | 71 | 72 | 6.7 ± 0.8 | 503 |
For further understanding of the catalytic process, turnover frequencies (TOF) were calculated for each catalyst, in particular, for sample AlF75 which shows the highest catalytic activity. Fig. 1 shows the conversion of citronellal after various reaction times; two different phases of reaction can be distinguished and are further assigned to start phase and reaction under stable-state conditions. In the beginning of the reaction catalysts are highly active and show high TOFs. Their catalytic activities, however, decrease during the reaction in this start phase. The reason for the high activity in the beginning of the reaction might be speculated is a fast reaction of citronellal at highly active acidic sites forming isopulegol and/or other by-products which in turn do not desorb, and thus block these sites. After about one hour of reaction all highly active sites are blocked and the activity of the catalyst is stable demonstrated by constant TOFs respectively a constant slope of conversion of citronellal, stable-state conditions are achieved. Remaining acidic sites are truly catalytically active.
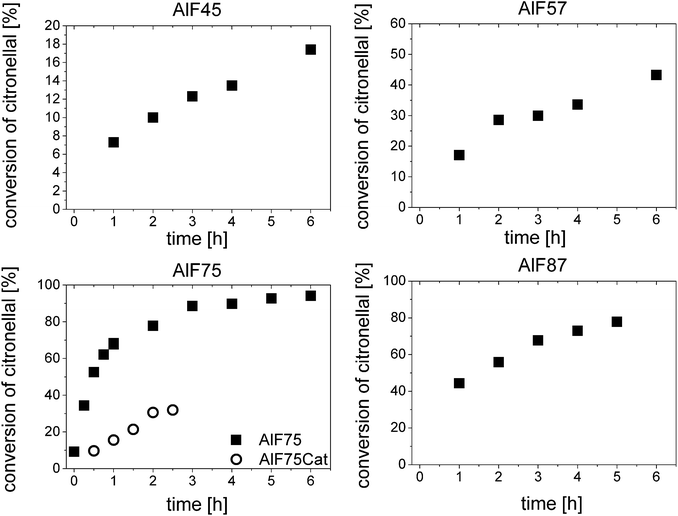 | ||
| Fig. 1 Conversion of citronellal at various reaction times for the four aluminum hydroxide fluoride samples and for AlF75 after pretreatment with a solution of citronellal, AlF75Cat (dots). | ||
Thus the question arises, whether internal or external diffusion of citronellal and its reaction products or reactions at the acidic sites, as adsorption, reaction or desorption, are rate-determining for the reaction. Yadav et al.43 showed that internal diffusion of citronellal and its reaction products is not rate-determining even when large particles (37–150 μm) with small pores (<1.5 nm) were used. Hence, internal diffusion should also not be an issue in case of the investigated nanoscopic aluminum hydroxide fluorides.
External diffusion was investigated by detecting the conversion of citronellal at different agitation rates for the two samples AlF75 and AlF87 (see Fig. 1 in the ESI†). Conversions of citronellal were detected after 3 h of reaction to ensure that the reaction runs under stable reaction conditions. These investigations show that conversions do not change if the agitation rate is increased from 600 rpm to 750 rpm. This shows that external diffusion is not rate-determining at an agitation rate of 600 rpm.
As internal and external diffusion can be ruled out as rate-determining steps, the reaction rate must be determined by processes in which acidic sites are involved.
If approximately all citronellal is consumed at a conversion level above 90%, TOF becomes close to zero. At this high conversion level of citronellal, reactions at acidic sites are probably no longer rate-determining for the reaction but other factors, e.g. the low concentration of citronellal or high concentration of reaction products, which may also interact with the acidic sites, become rate-determining.
For the samples AlF45, AlF57 and AlF87 TOFs can be simply calculated from the conversion of citronellal at different reaction times under stable-state conditions as shown in Fig. 1 and linear fitting of these plots (further calculation of TOF is described in the ESI†). For sample AlF75 only few data points are available under stable-state conditions. Therefore, AlF75 was pretreated with the reaction mixture. After filtering off the initial reaction mixture, fresh reaction mixture was added and catalytic testing was started. Due to this pretreatment the first reaction phase could be avoided and stable activity is obtained for the TOF calculation. Determined TOFs are listed in Table 1; they increase from sample AlF45 to AlF75 and decrease for sample AlF87.
3.2. Bulk characterization: XRD and BET surface area measurements
X-ray diffraction (XRD) and nitrogen sorption measurements are common methods for the characterization of solid samples. Typical for the fluorolytic sol–gel process, the synthesis of aluminum hydroxide fluorides leads to highly disordered, nanoscaled, X-ray amorphous compounds.11,12 The results of the BET measurements are shown in Table 1. The surface areas increase from AlF45 to AlF87.3.3. Quantification of acidic sites
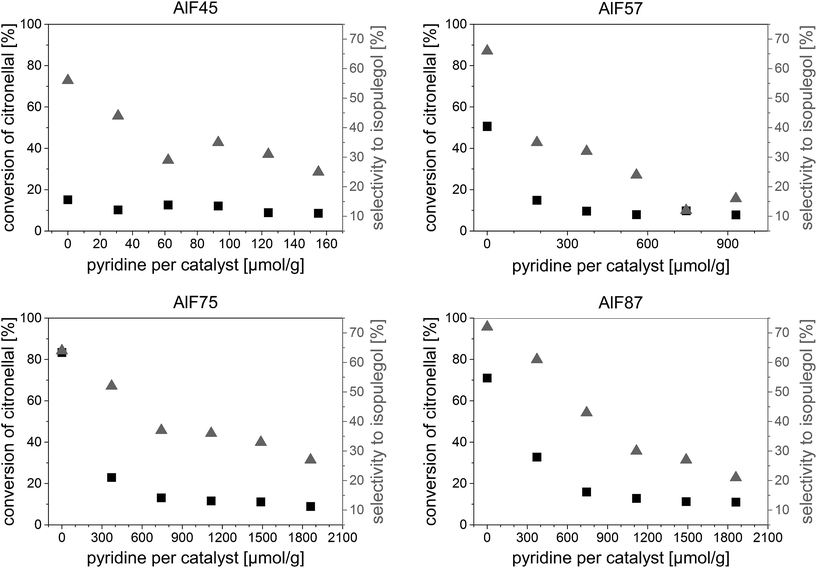 | ||
| Fig. 3 Conversion of citronellal and selectivity to isopulegols versus the added amount of pyridine for the four aluminum hydroxide fluoride samples. | ||
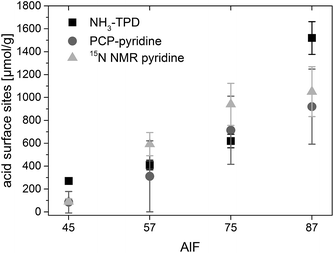
Base activity lies in the range of 7–16% conversion of citronellal and 10–35% selectivity to isopulegol and is caused by the fact that an equilibrium is established wherein pyridine molecules bound to weak acidic sites can be replaced by citronellal.44 Hence, with a certain probability, citronellal can displace pyridine from an acidic surface site and react to isopulegol or other by-products. The initial phase in which the conversion and selectivity drop with the added amount of pyridine and the base activity are observed for all samples. After linear fitting of these phases, concentration of acidic sites is calculated at the intersection. The determined concentrations of acidic sites, shown in Fig. 2, show the same trend in the series of catalysts as concentrations of acidic sites determined by NH3-TPD. For two of the samples (AlF45 and AlF87) concentrations of acidic sites determined by PCP are lower as those determined by NH3-TPD. Probably, the reason for that is that NH3 is smaller compared to pyridine and can enter into smaller pores.
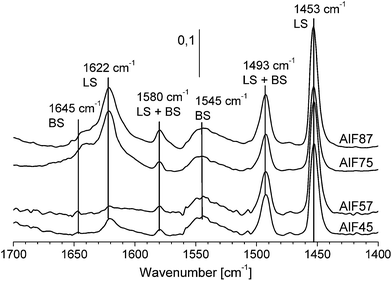
Spectra of the aluminum hydroxide fluorides before pyridine adsorption show broad signals between 1800 and 1350 cm−1 assigned to hydroxyl groups which form hydrogen bond with surrounding fluorides.45,46 We assume that disturbances of these broad signals occur upon the interaction of pyridine with hydroxyl groups at the surface (see FTIR spectra before and after pyridine adsorption Fig. 4 in the ESI†). These disturbances can lead to negative signals in the difference spectra and, therefore, to the unexpected adsorption behavior. Hence, precise determination of molar extinction coefficients was impossible for these samples. Using molar extinction coefficients from the literature is not recommended because, as Selli and Forni29 have shown, a large spread of molar extinction coefficients can be found. Thus, quantitative determination of acidic sites was not possible by FTIR spectroscopy due to the lack of molar extinction coefficients.
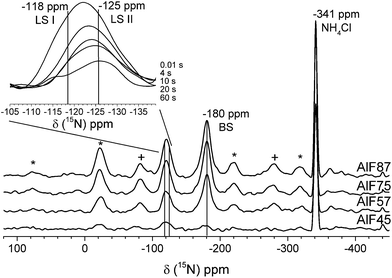
Usually, quantitative determination of these NMR signals would be performed by 15N qNMR spectra recorded after a single 90° pulse ensuring that the repetition delay of the experiment is at least five times the longest spin–lattice relaxation time T1 of these resonances. However, even using 15N labeled pyridine molecules T1 measurements based on saturation or inversion recovery techniques are very time-consuming. Hence, a time saving method for determination of concentrations of acidic sites that has been recently reported was applied.27 This method includes the determination of T1 values of each resonance by a method introduced by Torchia.42 The Torchia method uses cross-polarization for signal enhancement and spectra after different waiting delays to determine T1 values. The insert in Fig. 5 shows the Torchia spectra of sample AlF87. As can be seen, the resonance at −120 ppm consists of two lines! This is found for all four samples. The two signals represent pyridine molecules at two different Lewis acidic sites, which differ in their 15N chemical shift (i.e. the acid strength of the Lewis site) and – most importantly – in their 15N T1 values. These two sites are further assigned to LS I (−118 ppm) and LS II (at −125 ppm). Even by careful examination of the FTIR spectra (see Fig. 3 of the stepwise pyridine adsorption in the ESI†) these two Lewis sites cannot be distinguished by FTIR spectroscopy.
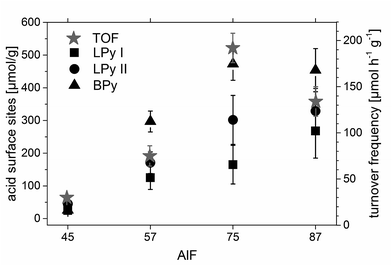
The concentration of each acidic sites can be calculated by comparison of the signal area of each line to the internal standard NH4Cl (for the calculation see ESI†). The concentrations of all acidic sites are plotted in Fig. 6. The sum of these individual concentrations of acidic site determined by 15N NMR compares well to the total concentration of acidic sites determined by PCP and NH3-TPD, as shown in Fig. 2.
3.4. Comparison of the quantification methods
As has been concluded in Chapter 3.1. the determined TOFs depend on reaction steps where acidic sites are involved. Thus, TOFs are influenced by the concentration of acidic surface sites. This means that a higher concentration of available acidic sites at which a reactant can adsorb and react will result in higher TOF numbers.Fig. 2 shows a comparison of concentration of all acidic sites for the four samples determined by NH3-TPD, PCP and 15N NMR with pyridine as probe molecule. Surprisingly, the concentration of acidic sites determined by NH3-TPD is equal or even smaller for two of the samples (AlF57 and AlF75) than the concentrations determined by PCP and 15N NMR using pyridine. Commonly a larger quantity of acidic sites is expected using ammonia as probe molecule compared to pyridine, because ammonia is smaller and can enter into smaller pores. There are two reasons why less acidic sites were detected with NH3-TPD. To avoid changes in the samples during the ammonia desorption, the samples were calcined at 573 K before ammonia was adsorbed for the TPD measurements. This already causes dehydroxylation/dehydration of the samples and thus loss of acidic sites or conversion from Brønsted into Lewis sites is expected.11,12 This is evidenced by the poor catalytic activity of the samples after calcination at 573 K (Table 2 in the ESI†). Second, samples were heated up to 573 K for ammonia desorption only. Therefore, it is possible that strong acidic sites were not detected with TPD because ammonia may still remain at strong acidic sites at 573 K.12 Probably due to these reasons smaller concentrations of acidic sites are measured by NH3-TPD than are actually present in the samples. Hence, NH3-TPD shows the lowest error in the quantification of acidic sites of about 10%, but is most doubtful for this kind of samples.
Additionally, pyridine as a larger molecule is better comparable with citronellal and isopulegol and therefore a more suitable probe molecule than ammonia for the catalyzed reactions. In comparison to PCP, quantification of acidic sites by 15N NMR with pyridine has two advantages. On the one hand, various acidic sites, Brønsted and even different Lewis sites, can be distinguished and quantified. On the other hand, the error of the quantification is smaller with 15N NMR spectroscopy being about 25% compared to PCP with up to 110%. The reason for the large error in PCP measurements is probably the complex reaction of citronellal to isopulegol. Determined conversions and selectivities for the reaction of citronellal show a certain error which leads to errors in the PCP measurements. Furthermore, concentration of acidic sites determined by PCP is smaller for each sample than concentration determined by 15N NMR. The reaction of citronellal to isopulegol requires Lewis and Brønsted sites,37 therefore, it may be that the base activity of a catalyst is reached in the PCP measurement before all acidic sites are saturated with pyridine.
3.5. Comparison of the concentrations of acidic sites with TOF
Previous studies by Fuentes et al.47 and Chuah et al.37 concluded that the amount of accessible Brønsted sites47 and the presence of both Lewis and Brønsted sites37 are essential for the catalytic activity of a catalyst in the reaction of citronellal to isopulegol.Hence, individual concentrations of acidic sites of the aluminum hydroxide fluoride samples were compared with the calculated TOFs (see Chapter 3.1.). The comparison reveals that TOFs and the concentration of Brønsted acid sites show the same trend (Fig. 6). This is in agreement with the findings of Fuentes et al.47 that the concentration of accessible BS determines the reaction rate of the conversion of citronellal, probably as long as a sufficient amount of LS is present in the sample. Usually, TOFs are normalized by the catalyst's surface area or catalytic site concentration. However, this normalization does not consider any distribution of e.g. strength and/or topology of surface sites involved in a reaction. Thus, one always should be aware that TOF normalization carries a certain uncertainty. Especially, for a reaction that requires multiple acidic sites, as the reaction of citronellal to isopulegol for which Chuah et al.37 have shown that LS and BS are crucial.
TOFs normalized by the concentration of Brønsted sites are mostly the same for all samples. This indicates that the concentration of Brønsted sites is crucial for the reaction and all Brønsted sites are of the same acid strength in the samples. Only the TOF normalized by the Brønsted sites of sample AlF45 is higher than the other TOFs, probably due to the fact that this sample shows only small conversion in the range of the base activity of the catalyst (see Chapter 3.3.2.). Interestingly, TOFs normalized by the concentration of all acidic sites (determined by NH3-TPD, PCP and 15N NMR) are also of about the same dimension for the four samples. This is due to the fact that nearly half of all acidic sites in the samples are Brønsted sites. All normalized TOFs are listed in ESI Table 1.†
3.6. 15N NMR experiments after various pretreatments of the catalyst
Bailey et al.48 showed by calculating the structure and corresponding energies of several α-AlF3 surfaces that surfaces, which exhibit strong Lewis acid sites, can be converted to less acidic surfaces. Indeed, investigation by 15N NMR of an AlF75 sample, which was stored for one year in a glovebox, shows a change in the concentrations of acidic sites compared to a freshly prepared AlF75 sample. Note that the stored sample shows a catalytic performance (conversion of citronellal and selectivity to isopulegol) which is comparable with a freshly prepared sample. Table 2 lists the concentration of acidic sites of the freshly prepared AlF75 sample and that stored for one year in a glovebox AlF75 Gb. While the concentration of Lewis sites LS I and that of Brønsted sites remain the same, the concentration of the second kind of Lewis sites LS II is reduced by half in sample AlF75 Gb. Probably these Lewis sites are lost due to rearrangements of the catalyst's surface over time.| Sample | LS I [μmol g−1] | LS II [μmol g−1] | BS [μmol g−1] |
|---|---|---|---|
| AlF75 | 165 ± 59 | 302 ± 75 | 473 ± 50 |
| AlF75 Gb | 170 ± 40 | 125 ± 30 | 463 ± 35 |
| AlF75Cat | 94 ± 25 | 65 ± 15 | 211 ± 18 |
Additionally, Table 2 lists the concentration of acidic sites of another sample AlF75Cat. This sample was prepared to investigate which acidic sites become blocked in the start phase of the catalytic reaction (see Chapter 3.1.). For that purpose, sample AlF75Gb was treated with a solution of citronellal at 353 K for two hours. After this pretreatment the solution was filtered off and the sample was dried at 353 K in vacuum for 2 h. After adsorption of labeled 15N-pyridine, AlF75Cat was investigated by 15N NMR. This investigation shows two interesting changes in the sample. While the chemical shift of all sites remain the same, the spin–lattice relaxation T1 of the pyridine molecules at LS II changes from about 70 s to 30 s. This is indicative for a change in the environment around these sites. Furthermore, comparison of quantitative results of AlF75Cat with AlF75 Gb shows that the concentrations of all three acidic sites decrease by about half after the treatment with citronellal. There are two reasons for the drop in concentration of acidic sites per gram catalyst. Most importantly some acidic sites are blocked in the reaction of citronellal and are, therefore, no longer accessible for pyridine. Furthermore, molecules which do not desorb from the catalyst at 353 K increase the weight of the catalyst, and thereby, decrease the concentration of acidic sites per gram. Due to the fact that all acidic sites become blocked equally, it is not possible to decide which kind or combination of acidic site is responsible for the high activity of the catalysts at the beginning of the reaction of citronellal.
However, there are two findings which indicate that Lewis sites LS II have only minor influence and probably become blocked during the catalytic reaction. The first observation is that a decrease in the concentration of Lewis sites LS II (compare sample AlF75 and AlF75Gb) does not influence the catalytic performance of the sample, and secondly, the pretreatment with citronellal effects most significantly these sites, the spin–lattice relaxation time T1 of pyridine molecules adsorbed at these sites is reduced after the pretreatment.
4. Conclusions
The present study shows that 15N NMR spectroscopy is a suitable method to determine concentrations of acidic sites on solid surfaces. Three different acidic sites, assigned as two Lewis and one Brønsted site, can be distinguished and quantified in the series of investigated aluminum hydroxide fluorides by 15N NMR spectroscopy. In total, four different methods were tested and compared for the quantification of acidic surface sites on this series of catalysts. Three methods, PCP and 15N NMR spectroscopy with pyridine as probe molecule as well as TPD with ammonia as probe molecule, determine concentrations of acidic sites in the same order of magnitude and show the same trend in the investigated series of catalysts (Fig. 2). In contrast to TPD, these concentrations of acidic sites can be determined with PCP and 15N NMR at conditions comparable to those used for catalysis. Therefore, PCP and 15N NMR are more reliable because changes of the catalyst, due to the temperature treatment in TPD measurements, can be avoided. Comparing these two methods, 15N NMR is more suitable for the quantification because the error is smaller than with PCP, and importantly enough, various acidic sites can be distinguished. Quantitative determination of acidic sites by FTIR spectroscopy, which is also a suitable method to distinguish Lewis and Brønsted sites, was not possible because molar extinction coefficients could not be determined.The reaction of citronellal to isopulegol was used to test the catalytic activity of the four investigated catalyst samples. The reaction shows two activity phases with different TOFs: a start phase with high TOF that decreases during the reaction probably because some acidic sites become blocked. After about one hour of reaction a second phase is reached with stable reaction conditions and constant TOF.
Comparison of TOFs with concentrations of acidic sites shows that the concentration of Brønsted sites, determined by 15N NMR, and TOF correlate well to each other exhibiting the same trend in the investigated series of catalysts. Hence, the concentration of acidic Brønsted sites seems to be a crucial factor for the reaction of citronellal to isopulegol in this series of catalyst.
Two different Lewis sites can be distinguished by 15N NMR in the samples. Our investigations of the samples after various pretreatments show that one of these two kinds of Lewis sites probably becomes blocked during the start phase of the reaction of citronellal to isopulegol and, therefore, has a minor impact on the reaction of citronellal.
Acknowledgements
The authors thank Anna Maria Mücke for her help with the graphical abstract.Notes and references
- A. Corma and H. García, Chem. Rev., 2003, 103, 4307, DOI:10.1021/cr030680z
.
- J. H. Clark, Acc. Chem. Res., 2002, 35, 791, DOI:10.1021/ar010072a
.
- L. Rao, Resonance, 2007, 12, 30, DOI:10.1007/s12045-007-0102-6
.
- W. E. Farneth and R. J. Gorte, Chem. Rev., 1995, 95, 635, DOI:10.1021/cr00035a007
.
- R. J. Gorte, Catal. Lett., 1999, 62, 1, DOI:10.1023/a:1019010013989
.
- M. Niwa and N. Katada, Chem. Rec., 2013, 13, 455, DOI:10.1002/tcr.201300009
.
- M. V. Juskelis, J. P. Slanga, T. G. Roberie and A. W. Peters, J. Catal., 1992, 138, 391, DOI:10.1016/0021-9517(92)90032-d
.
- O. Kresnawahjuesa, R. J. Gorte, D. de Oliveira and L. Y. Lau, Catal. Lett., 2002, 82, 155, DOI:10.1023/a:1020514911456
.
- X. Qia, M. Watanabea, T. M. Aidaa and R. L. Smith Jr, Catal. Commun., 2009, 10, 1771, DOI:10.1016/j.catcom.2009.05.029
.
- S. Wuttke, S. M. Coman, G. Scholz, H. Kirmse, A. Vimont, M. Daturi, S. L. M. Schroeder and E. Kemnitz, Materials. Chem. Eur. J., 2008, 14, 11488, DOI:10.1002/chem.200801702
.
- C. Stosiek, G. Scholz, G. Eltanany, R. Bertram and E. Kemnitz, Chem. Mater., 2008, 20, 5687, DOI:10.1021/cm801236v
.
- C. Stosiek, G. Scholz, S. L. M. Schroeder and E. Kemnitz, Chem. Mater., 2010, 22, 2347, DOI:10.1021/cm903573a
.
- R. Rudham and A. I. J. Spiers, J. Chem. Soc., Faraday Trans., 1997, 93, 1445, 10.1039/a607615g
.
- J. D. Danforth, J. Phys. Chem., 1954, 58, 1030, DOI:10.1021/j150521a023
.
- S. B. Sharma, B. L. Meyers, D. T. Chen, J. Miller and J. A. Dumesic, Appl. Catal., A, 1993, 102, 253, DOI:10.1016/0926-860x(93)80232-f
.
- A. Auroux, Top. Catal., 2002, 19, 205, DOI:10.1023/a:1015367708955
.
- C. Guimon, A. Zouiten, A. Boreave, G. Pfister-Guillouzo, P. Schulz, F. Fitoussi and C. Quet, J. Chem. Soc., Faraday Trans., 1994, 90, 3461, 10.1039/ft9949003461
.
- C. Guimon, A. Boreave and G. Pfister-Guillouzo, Surf. Interface Anal., 1994, 22, 407, DOI:10.1002/sia.740220188
.
- C. A. Emeis, J. Catal., 1993, 141, 347, DOI:10.1006/jcat.1993.1145
.
- I. S. Pieta, M. Ishaq, R. P. K. Wells and J. A. Anderson, Appl. Catal., A, 2010, 390, 127, DOI:10.1016/j.apcata.2010.10.001
.
- A. Platon and W. J. Thomson, Ind. Eng. Chem. Res., 2003, 42, 5988, DOI:10.1021/ie030343g
.
- J. A. Lercher, C. Gründling and G. Eder-Mirth, Catal. Today, 1996, 27, 353, DOI:10.1016/0920-5861(95)00248-0
.
- T. S. Glazneva, N. S. Kotsarenko and E. A. Paukshtis, Kinet. Catal., 2008, 49, 859, DOI:10.1134/s0023158408060104
.
-
E. Brunner, H. Pfeifer, NMR Spectroscopic Techniques for Determining Acidity and Basicity Acidity and Basicity, Springer, Berlin, Heidelberg, 2008, Vol. 6, DOI:10.1007/3829_2007_016
.
- Y. Jiang, J. Huang, W. Dai and M. Hunger, Solid State Nucl. Magn. Reson., 2011, 39, 116, DOI:10.1016/j.ssnmr.2011.03.007
.
- A. Zheng, S.-J. Huang, S.-B. Liu and F. Deng, Phys. Chem. Chem. Phys., 2011, 13, 14889, 10.1039/c1cp20417c
.
- F. Hemmann, G. Scholz, K. Scheurell, E. Kemnitz and C. Jaeger, J. Phys. Chem. C, 2012, 116, 10580, DOI:10.1021/jp212045w
.
- Z. Wang, J. M. Heising and A. Clearfield, J. Am. Chem. Soc., 2003, 125, 10375, DOI:10.1021/ja030226c
.
- E. Selli and L. Forni, Microporous Mesoporous Mater., 1999, 31, 129, DOI:10.1016/s1387-1811(99)00063-3
.
- C. Morterra, G. Magnacca and V. Bolis, Catal. Today, 2001, 70, 43, DOI:10.1016/s0920-5861(01)00406-0
.
- P. D. Majors and P. D. Ellis, J. Am. Chem. Soc., 1987, 109, 1648–1653, DOI:10.1021/ja00240a008
.
- J. F. Haw, I.-S. Chuang, B. L. Hawking and G. E. Maciel, J. Am. Chem. Soc., 1983, 105, 7206–7207, DOI:10.1021/ja00362a051
.
- J. F. Haw, J. Zhang, K. Shimizu, T. N. Venkatraman, D.-P. Luigi, W. Song, D. H. Barich and J. B. Nicholas, J. Am. Chem. Soc., 2000, 122, 12561, DOI:10.1021/ja0027721
.
- A. A. Gurinov, Y. A. Rozhkova, A. Zukal, J. Čejka and I. G. Shenderovich, Langmuir, 2011, 27, 12115, DOI:10.1021/la2017566
.
- S. Rüdiger and E. Kemnitz, Dalton Trans., 2008, 9, 1117, 10.1039/b716483a
.
-
K. Teinz, Ph.D. thesis, Humboldt-Universität zu Berlin, Berlin, Germany, 2012
.
- G. K. Chuah, S. H. Liu, S. Jaenicke and L. J. Harrison, J. Catal., 2001, 200, 352, DOI:10.1006/jcat.2001.3208
.
- A. E. Bennett, C. M. Rienstra, M. Auger, K. V. Lakshmi and R. G. Griffin, J. Chem. Phys., 1995, 103, 6951, DOI:10.1063/1.470372
.
- D. Massiot, F. Fayon, M. Capron, I. King, S. Le Calvé, B. Alonso, J. O. Durand, B. Bujoli, Z. Gan and G. Hoatson, Magn. Reson. Chem., 2002, 40, 70, DOI:10.1002/mrc.984
.
- C. Jaeger and F. Hemmann, Solid State Nucl. Magn. Reson., 2013, 57–58, 22, DOI:10.1016/j.ssnmr.2013.11.002
.
-
D. M. Grant and R. K. Harris, Encyclopedia of Nuclear Magnetic Resonance, John Wiley & Sons Ltd., Chichester, U.K., 1996, vol. 5, p. 3247 Search PubMed
.
- D. A. Torchia, J. Magn. Reson., 1978, 30, 613, DOI:10.1016/0022-2364(78)90288-3
.
- G. D. Yadav and J. J. Nair, Langmuir, 2000, 16(9), 4072, DOI:10.1021/la9911178
.
- F. Hemmann, I. Agirrezabal-Telleria, E. Kemnitz and C. Jaeger, J. Phys. Chem. C, 2013, 117, 14710, DOI:10.1021/jp405213x
.
- G. M. Chaban and R. B. Gerber, Spectrochim. Acta, Part A, 2002, 58, 887, DOI:10.1016/s1386-1425(01)00676-x
.
- I. Gennick, K. M. Harmon and J. Hartwig, Inorg. Chem., 1977, 16, 2241, DOI:10.1021/ic50175a018
.
- A. M. Fuentes, J. Magraner, C. de las Pozas and R. Rogque-Malherbe, Appl. Catal., 1989, 47, 367, DOI:10.1016/s0166-9834(00)83242-x
.
- C. L. Bailey, S. Mukhopadhyay, A. Wander, B. G. Searle and N. M. Harrison, J. Phys. Chem. C, 2009, 113, 4976, DOI:10.1021/jp810719h
.
Footnote |
| † Electronic supplementary information (ESI) available. See DOI: 10.1039/c4ra09477h |
| This journal is © The Royal Society of Chemistry 2014 |

