Bioinspired synthesis of mesoporous ZrO2 nanomaterials with elevated defluoridation performance in agarose gels
Dong Yanga,
Yuanbing Lia,
Yuangui Wanga and
Zhongyi Jiang*bc
aDepartment of Biochemical Engineering and Key Laboratory of Systems Bioengineering of Ministry of Education, School of Chemical Engineering and Technology, Tianjin University, Tianjin 30072, China
bKey Laboratory for Green Technology of Ministry of Education, School of Chemical Engineering and Technology, Tianjin University, Tianjin 300072, China. E-mail: zhyjiang@tju.edu.cn; Fax: +86 22 2350 0086; Tel: +86 22 2350 0086
cCollaborative Innovation Center of Chemical Science and Engineering (Tianjin), Tianjin 300072, China
First published on 30th September 2014
Abstract
Mesoporous ZrO2 nanomaterials were synthesized in an agarose gel medium by a bioinspired approach, and their adsorption capacity for the fluoride anion was also evaluated. The obtained ZrO2 samples after calcination at 600 °C for 2 h are primarily composed of tetragonal nanocrystals about 11.8 nm in size. Moreover, the samples possess bimodal mesopores about 3.5 nm and 5.9 nm in diameter, which are generated by removing the agarose gel fibers embedded in the ZrO2 particles during their growth process. The pore volume and specific surface area of mesoporous ZrO2 nanomaterials are 0.091 cm3 g−1 and 40.14 m2 g−1, respectively, which increase with the increase of gel concentration, while decrease with the increase of initial ZrOCl2 concentration. The ZrO2 samples synthesized in agarose gel show a higher fluoride adsorption capacity than those synthesized in the aqueous solution by the same method. This study may provide a broader insight into the bioinspired synthesis of metal oxides in hydrogel medium under mild conditions.
1. Introduction
Recently, much effort has been devoted to the bioinspired synthesis of inorganic nanomaterials in hydrogel, because such medium is regarded as a popular matrix for imitating the biomineralization processes.1–3 The hydrogel creates a tunable and stable diffusion-dominated mass transport environment for the nucleation and growth of inorganic nanomaterials, in which the morphology, structure and physico-chemical properties of the resultant materials can be well controlled.4–6 In particular, the gel fibers can be incorporated into inorganic single crystals by manipulating both gel mechanical strength and crystal growth kinetics, rendering a new approach for the synthesis of inorganic materials with mesopores.1Till now, a wide variety of inorganic crystals, such as CaCO3,7,8 hydroxyapatite,9 CaC2O4 10 and calcium tartrate tetrahydrate,11 have been prepared within various types of hydrogels. Moreover, the nanotubes12 and porous monoliths13–20 of metal oxides including TiO2, SiO2, ZrO2, Nb2O5, and SnO2, have also been synthesized by using different types of hydrogels as templates. In our previous study, hollow TiO2 nanospheres with bimodal mesopores about 3.8 and 5.5 nm in size have been firstly prepared by using an agarose gel as the medium,21 which exhibits the different morphology and microstructure from their counterpart prepared in the aqueous solution under identical conditions. It is speculated that a spherical composite formed by protamine and agarose molecules may take a crucial role in their formation, and the mesopores may be formed through removing the agarose gel fibers embedded in the shell of hollow TiO2 nanospheres during their nucleation and growth. However, this bioinspired method needs extend to other metal oxides, and the formation mechanism of metal oxides in the gel medium also needs to be further elucidated.
Zirconia nanomaterials have gained their popularity during the past few decades due to their distinctive properties containing thermodynamical stability, corrosion resistance, high refractive index, dielectric constant and mechanical strength, which have been utilized as catalyst and catalyst carrier, absorbent, photocatalyst, memory device and dense ceramics etc.22–27 To date, various physical and chemical strategies have been adopted to prepare ZrO2 nanomaterials, e.g., the sol–gel method,28 forced hydrolysis,29,30 hydrothermal method,31 modified emulsion precipitation,32 combustion synthesis33 and electric explosion of wires.34 However, these conventional physical and chemical methods often involve the extremely harsh conditions, such as high temperature, inflammable organic solvents and high energy heating. Therefore, it is still a challenge for preparing ZrO2 nanomaterials by a green, efficient, facile, generic method.
In this study, porous ZrO2 particles are prepared by using ZrOCl2 and NH4OH as the reactants in agarose gels. The agarose, a natural neutral polysaccharide, is chosen as the gel medium, because it is easily available and commonly acts as the model hydrogel in the synthesis of inorganic materials. ZrOCl2 and NH4OH are chosen as the reactants because of their low cost and easy scale-up for industrial application. Furthermore, the defluoridation performance of resultant ZrO2 particles is evaluated. This study may be useful for an intensive understanding about bioinspired metal oxides synthesis in the hydrogel medium.
2. Experimental
2.1 Chemicals
Zirconium oxychloride (ZrOCl2·8H2O) and ammonium hydroxide (NH4OH) were purchased from Tianjin Guangfu Company. Agarose was supplied by Gene Tech. Co. (Shanghai) with a gel strength of 750 g cm−2 under 1 wt% gel concentration. A 100 mg L−1 fluoride ion stock solution was prepared by dissolving 0.221 g NaF in 1000 mL of deionized water. All other chemicals were of analytical grade, and used without further purification. Deionized water was used in all experiments.2.2 Synthesis of ZrO2 samples in agarose gels
The detailed synthetic method is as follows: 1 g of agarose powder was dissolved in 100 mL water, and then heated to 85–90 °C with vigorous stirring until all the powder dissolved completely. The hot agarose solution was poured into a Petri dish at room temperature until the hydrogel formed completely. The cooled agarose gel was cut into cubic pieces about 1 cm3 in volume, which were soaked in a 100 mL ZrOCl2 solution (0.05 mol L−1) to incubate for 4 h at room temperature. Then, the gel pieces were washed, and immersed into a 2.5 wt% NH4OH solution for 4 h to induce the ZrO2 precipitation. Thereafter, the gel pieces containing ZrO2 precipitates were rinsed with deionized water till the pH of the washing water is near 7, followed by freeze-drying to get agarose–ZrO2 composites. After these composites were calcined at different temperatures in air for 2 h, ZrO2 samples were obtained finally. They are denoted as “ZrO2–AG-Y” (Y = 400, 600 and 800), where AG and Y represent the agarose gel and calcination temperature in Celsius degree, respectively. For comparison, ZrO2 materials were also prepared by the same procedure in an aqueous solution, and designated as ZrO2–W, where W represents the water.2.3 Characterization
The X-ray powder diffraction (XRD) patterns were obtained by a Philips X-Pertpro diffractometer using Cu Kα radiation at a scan rate of 4° min−1 with an accelerating voltage of 40 kV and a current of 40 mA, which is used to determine the crystallographic information of ZrO2 samples. Transmission electron microscope (TEM) observation was measured on a JEM-100CX II instrument. High resolution transmission electron microscopy (HRTEM) was performed on a Tecnai G2 F-20 instrument. Thermogravimetric/derivative thermogravimetric analysis (TG-DTG) was conducted on a STA 449F3 (Netzsch) thermogravimetric analyzer at a heating rate of 10 °C min−1 under N2 flow of 30 mL min−1 from room temperature to 800 °C. The BET specific surface area of ZrO2 samples were evaluated by N2 adsorption–desorption isotherm measurements performed at 77 K on a Tri-Star 3000 gas adsorption analyzer. Prior to measurements, the samples were pretreated at 100 °C for 2 h. The infrared (IR) spectra of ZrO2 samples (1 wt% in KBr) were carried out in the 400–4000 cm−1 region with a resolution of 4 cm−1 for each spectrum on a Nicolet-560 Fourier transform infrared (FT-IR) spectrometer.2.4 Defluoridation performance of ZrO2 samples
 | (1) |
3. Results and discussion
3.1 Characterization of ZrO2 samples
When the agarose gel pieces containing ZrOCl2 were immersed into the NH4OH solution, some white substance produces inside the gels within a few minutes. Furthermore, its amount increases with prolonging the immersion time gradually. However, the reaction rate is much lower than that in the aqueous solution, which can be attributed to the diffusion inhibition of agarose gel for the reactants.8 The produced agarose gel–ZrO2 composites cannot be dissolved in hot water about 90 °C like agarose gel/TiO2 composites,21 indicating that ZrO2 binds strongly with the agarose gel. After the agarose gels were removed by calcination at high temperature, white ZrO2 powders were obtained. From Fig. 1a, it can be clearly observed that ZrO2–AG-600 comprises uniformly quasi-spherical nanoparticles about 10 nm in size. The corresponding HRTEM image directly shows the clear lattice fringes with lattice spacing of 0.3 nm, which is indexed to the (111) plane of tetragonal ZrO2.36,37 In comparison, ZrO2–W-600 (Fig. 1b) exhibits a monolithic structure, which may be formed via the fusion of ZrO2 particles at high temperature.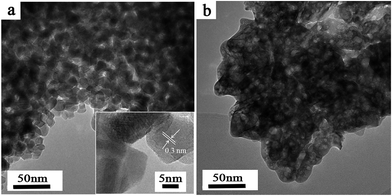 | ||
| Fig. 1 Typical TEM images of ZrO2–AG-600 (a) and ZrO2–W-600 (b). The inset of (a) is a HRTEM image of ZrO2–AG-600. | ||
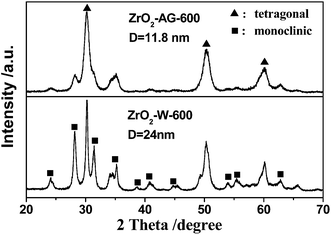
The XRD technique was employed to characterize the crystal structure of ZrO2 products after calcination at high temperature. The diffraction patterns in Fig. 2 clearly display that both of ZrO2–AG-600 and ZrO2–W-600 are mixtures of monoclinic phase (JCPDS no. 88-2390) and tetragonal phase (JCPDS no. 80-0965). ZrO2–AG-600 exhibits high diffraction peaks at 30°, 50° and 60°, which correspond to the diffractions of the (111), (112) and (211) plane of tetragonal phase, respectively. Comparatively, there are sharp diffraction peaks at 28.3° and 31.5° in the XRD spectrum of ZrO2–W-600, which belong to the (−111) and (111) plane of monoclinic phase, respectively. The weight fraction of tetragonal phase can be calculated via the following equation:18
 | (2) |
 | (3) |
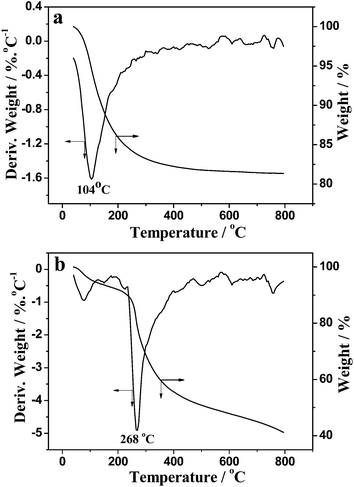
The thermal properties of ZrO2–W and the agarose–ZrO2 composite before calcination were investigated by TGA. The weight loss of ZrO2–W, as shown in Fig. 3a, occurs mainly from 40 °C to 240 °C as corroborated by an exothermic peak at about 104 °C in the DTG curve, which is attributed to the bound-water loss of ZrO2·xH2O.39 When the temperature increases to 800 °C, the hydrous zirconia loses 16.8% of total weight. It is speculated that the theoretical x value in ZrO2·xH2O is 1.4. Actually, the weight loss almost ceases at 480 °C in the TG curve, indicating this temperature seems to be sufficient for the transformation of zirconia from amorphous phase into crystal.40 As depicted in Fig. 3b, the degradation of the agarose–ZrO2 composite is divided into two stages: from room temperature to 240 °C, the weight loss is about 10%, which is attributed to the bound-water evaporation in ZrO2·xH2O. In the range of 240–500 °C, a significant weight loss of about 38% occurs, and there is a corresponding exothermic peak at 268 °C in the DTG curve, which is primarily ascribed to the decomposition of agarose molecules.13 It should be mentioned that the water loss of agarose–zirconia composites is less than that of ZrO2 precipitates obtained in aqueous solution, which is consistent with the previous report.18 This phenomenon may be caused by the incorporation of agarose gel fibers, which occupy the binding sites around ZrO2, thus decreasing the bound water.
Fig. 4 shows the nitrogen adsorption–desorption isotherms of ZrO2–AG-600 (Fig. 4a) and ZrO2–W-600 (Fig. 4b), in which the insets are the corresponding pore-size distribution curves. According to IUPAC classification, the adsorption–desorption isotherm of ZrO2–AG-600 can be classified as type IV with a hysteresis loop of type H3 at high relatively pressures from 0.4 to 0.95, which indicates the existence of connected mesopores. The pore-size distribution curve calculated by the BJH (Barrett–Joyner–Halenda) method from the desorption branch shows two mesopores about 3.5 nm and 5.9 nm in diameter, respectively. Comparatively, the adsorption–desorption isotherm of ZrO2–W-600 is classified as type II, and does not have hysteresis loop, suggesting no mesopores. The Brunauer–Emmett–Teller (BET) surface area and pore volume of ZrO2–AG-600 are determined to be 40.14 m2 g−1 and 0.091 cm3 g−1, respectively, which are comparative with the reported result,13,18 and much higher than those of ZrO2–W-600 sample (2.63 m2 g−1 and 0.002 cm3 g−1). It is known that the diameter of agarose gel fibers usually varies from 3 to 30 nm depending on the experimental conditions,3 and the average diameter of agarose gel fibers incorporated into gel-grown calcite crystals is about 13 ± 5 nm.1 In the previous study, it was reported that hollow TiO2 nanospheres synthesized in agarose gels possessed bimodal pores about 3.8 and 5.5 nm in diameter.21 Moreover, porous ZrO2 nanoparticles synthesized by using the agarose gel as the template exhibited the mesopores around 4–8 nm in size.18 Therefore, these two mesopores should be formed by removing the agarose gel fibers embedded in the ZrO2 particles. The difference between agarose fibers and mesopore diameters of ZrO2 can be attributed to the freeze-drying process before the N2 adsorption–desorption isotherm measurement.
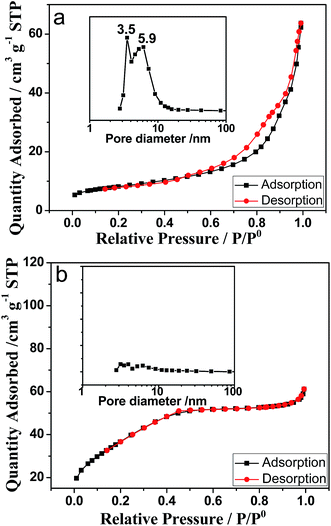 | ||
| Fig. 4 Nitrogen adsorption–desorption isotherms of ZrO2–AG-600 (a) and ZrO2–W-600 (b). The inset is the corresponding pore-size distribution curve by the BJH (Barrett–Joyner–Halenda) method. | ||
3.2 Forming mechanism of ZrO2 in agarose gels
In order to investigate the forming mechanism of ZrO2 in agarose gels, the effect of agarose gel and ZrOCl2 concentration on the ZrO2 structure was committed. A series of ZrO2–AG-600 samples were synthesized in agarose gels with different concentrations, in which other reaction conditions were fixed. As listed in Table 1, when the gel concentration increases from 0.5 wt% to 4 wt%, the specific surface area and pore volume increase from 37.05 m2 g−1 and 0.093 cm3 g−1 to 63.44 m2 g−1 and 0.169 cm3 g−1, respectively. Meanwhile, the pore size is almost unchanged, indicating that the size of agarose gel fibers changes little. It is speculated that the diffusion is dominant for inorganic material growth in agarose gels, since the interaction between inorganic reactants and agarose gel is little, and 99% of agarose gel is water.6 As the gel concentration increases, the gel network becomes denser. This change decreases the diffusion rate of inorganic reactants and increases the growth resistance of ZrO2, thus promoting the formation of small-size particles.8 Furthermore, the increase of gel concentration also enhances the incorporation of gel fibers in ZrO2, consequently resulting in the increase of mesopore amount. Smaller particles and more mesopores endow the ZrO2 sample prepared in agarose gels with high concentration larger specific surface area and pore volume.| Gel concentration (%) | Specific surface area (m2 g−1) | Pore volume (cm3 g−1) | Pore size (nm) |
|---|---|---|---|
| 0.5 | 37.05 | 0.093 | 7.0 |
| 1 | 40.14 | 0.091 | 3.5, 5.9 |
| 2 | 43.34 | 0.090 | 3.6, 8.1 |
| 3 | 46.79 | 0.136 | 3.6, 6.2 |
| 4 | 63.44 | 0.169 | 3.6, 7.3 |
The influence of initial ZrOCl2 concentration (10–200 mmol L−1) on the ZrO2–AG-600 structure was also investigated. As the initial ZrOCl2 concentration increases, the pore size changes little; while the specific surface area and pore volume decrease gradually. When the ZrOCl2 concentration is as low as 10 mmol L−1, the specific surface area and pore volume of ZrO2 are 60.8 m2 g−1 and 0.201 cm3 g−1, respectively; while the specific surface area and pore volume reduce to 30.1 m2 g−1 and 0.077 cm3 g−1, respectively, as the ZrOCl2 concentration reaches 200 mmol L−1. It is inferred that the produced ZrO2 particles are few and small at low ZrOCl2 concentration, because they cannot acquire sufficient reactants; while ZrO2 particles can grow larger at high ZrOCl2 concentration due to the sufficient reactant supplying. It is accepted that the materials composed of small particles usually have higher specific surface area and more stacking pores. Therefore, ZrO2 samples prepared at low ZrOCl2 concentration possess the larger specific surface area and pore volume than those at high ZrOCl2 concentration. These above results illustrate that the structure of ZrO2 prepared by this bioinspired method can be controlled via simply changing the reaction conditions.
Based on the experimental results, a tentative mechanism of mesoporous ZrO2 nanomaterials formed in agarose gels is proposed. When ZrOCl2 is dissolved in water, a tetramer complex [Zr(OH)2·4H2O]48+ forms as the dominant species.30,41 As depicted in Scheme 1, when the agarose gels are dipped into the ZrOCl2 solution, [Zr(OH)2·4H2O]48+ diffuses uniformly into the agarose gels. Since [Zr(OH)2·4H2O]48+ forms the hydrogen-bonding and coordination interaction with the –OH groups of agarose molecules, it can be rich around the agarose gel fibers. After agarose gels containing [Zr(OH)2·4H2O]48+ are soaked subsequently in a NH4OH solution, OH− ions promote the hydrolysis and polycondensation of [Zr(OH)2·4H2O]48+ to form the hydrous ZrO(OH)2 nanoparticles. Meanwhile, the agarose gel fibers are entrapped in the hydrous ZrO(OH)2 particles during their growing process.6,18 After these ZrO(OH)2–agarose composites are freeze-dried in vacuum and calcined at high temperature, the agarose gel fibers are removed thoroughly, thus giving rise to the formation of mesoporous ZrO2 particles finally.
In the previous study, hollow TiO2 nanospheres with mesopores in the shell were prepared in agarose gels by the similar procedure, in which a spherical protamine/agarose composite may take a key role in the formation of hollow nanospheres.21 However, no organic reactant is involved in the synthetic process of ZrO2, and the intermediate similar to the protamine/agarose composite cannot form. Therefore, the prepared ZrO2 particles do not have the hollow-sphere structure like TiO2. It is worth noting that there are also bimodal mesopores about 3.8 and 5.5 nm in size in the shell of hollow TiO2 nanospheres prepared in 1 wt% agarose gel, which are almost same as those of ZrO2 particles. This result confirms further that these mesopores come from the removal of agarose gel fibers embedded in the oxide materials. This may be a versatile approach for the preparation of inorganic oxide materials with bimodal mesopores of several nanometers to use the hydrogel fiber as the template.
Compared with other reaction media including water, organic solvent, and ionic liquid, the hydrogel medium has three advantages as used to synthesize metal oxide materials. Firstly, the synthesis in the hydrogel is a facile green process under ambient conditions, which does not need harsh conditions including high temperature, high pressure and complicated post-treatments. Secondly, the products prepared in the hydrogel can availably avoid the cluster aggregation in water environment, since the hydrogel provides a stable diffusion-dominated mass transport environment for the nucleation and growth of inorganic materials. Thirdly, the hydrogel fibers can be used as the template to form the mesopores in the produced materials, which can be regulated via simply changing the reaction conditions. In comparison with the method applied the freeze-dried agarose gel scaffold as the template, this bioinspired approach does not need the complicated preparation of template. Moreover, the acquired metal oxide materials have the higher mechanical strength than those prepared by the templating method, while keeping the comparative specific surface area and pore volume.
3.3 Defluoridation performance of ZrO2–AG-Y particles
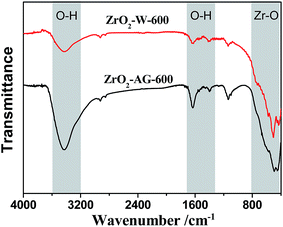
Water pollution by fluoride has been a global environmental concern for decades, since excessive fluoride intake is expected to cause skeletal fluorosis as well as disruption of normal calcium and phosphorus metabolism.42 The defluoridation performance of ZrO2–AG-Y samples was evaluated by their adsorption capacity for F− ions at room temperature. As listed in Table 2, ZrO2–AG-600 has the highest fluoride adsorption capacity of 4.69 mg g−1 in all of ZrO2 samples, almost 5 times of ZrO2–W-600. It is well known that the surface –OH group of ZrO2 is essential to the fluoride adsorption. During the adsorption process, F− ions replace the surface –OH groups of ZrO2, and form Zr-oxyfluoride species, such as ZrO2F5 and ZrO3F4.43 In the FTIR spectra of ZrO2–AG-600 and ZrO2–W-600 (Fig. 5), a broad band at 3200–3600 cm−1 and a sharp peak at 1630 cm−1 are assigned to the stretching and bending mode of –OH groups, respectively.18,44 It can be observed that the –OH characterized peaks of ZrO2–AG-600 are apparently stronger than those of ZrO2–W-600, indicating more –OH groups on the surface of ZrO2–AG-600. This result can be assigned to smaller particle size and higher specific surface area of ZrO2–AG-600 than those of ZrO2–W-600. Therefore, ZrO2–AG-600 has a higher defluoridation performance than ZrO2–W-600. Although ZrO2–AG-400 exhibits much higher specific surface area than ZrO2–AG-600, the adsorption capacity of ZrO2–AG-400 is a little lower than that of ZrO2–AG-600. As illustrated in Fig. 3, the agarose fiber embedded in the ZrO2–AG sample cannot be removed completely at 400 °C. The residual agarose molecules may occupy some active sites on the ZrO2 surface and prevent the fluoride adsorption, resulting in lower defluoridation performance of ZrO2–AG-400. When the calcination temperature reaches 800 °C, both the specific surface area and surface –OH groups of ZrO2 crystal particles reduce because of their larger size. Consequently, the defluoridation performance of ZrO2–AG-Y samples exhibits such a trend that rises first, and then falls, with increasing the calcination temperature.| Samples | Specific surface area (m2 g−1) | Pore volume (cm3 g−1) | qe (mg g−1) |
|---|---|---|---|
| ZrO2–W-600 | 2.63 | 0.002 | 0.97 |
| ZrO2–AG-400 | 136.46 | 0.086 | 4.28 |
| ZrO2–AG-600 | 40.14 | 0.091 | 4.69 |
| ZrO2–AG-800 | 17.74 | 0.103 | 2.08 |
The effect of adsorption conditions, such as initial F− concentration, pH value of NaF solution, and co-existing anions, on the adsorption capacity (qe) of ZrO2–AG-600 for F− ions were investigated. Fig. 6a illustrates the effect of initial F− concentration on the qe of ZrO2–AG-600 for F− ions without changing other conditions. With the increase of initial F− concentration, the qe of ZrO2–AG-600 gradually increases at the beginning, and then reaches the saturation adsorption nearly as the F− concentration is beyond 30 mg L−1. The pH value of NaF solution would dramatically affect the adsorption behavior taking place at the solid–liquid interface. The effect of pH value of NaF solution on the qe of ZrO2–AG-600 is presented in Fig. 6b. It can be seen that ZrO2–AG-600 demonstrates a superior defluoridation performance in the range of pH 3.0–7.0 and a maximum qe of 5.5 mg g−1 at pH 5.0. As the pH increases continuously, the qe of ZrO2–AG-600 drops monotonously. This result suggests that these kinds of ZrO2 materials are suitable for the weakly acidic fluoride solution rather than the basic solution. The pH value of NaF solution can influence the surface electric property of ZrO2 particles and the existing state of F−. At pH < 5, the surface of ZrO2 particles carries positive charges, which can attract F− ions by the electrostatic interaction. However, a part of F− ions are hydrolyzed to HF molecules at strongly acidic condition, thus lowering the adsorption capacity. At pH > 5, the surface of ZrO2 particles carries negative charges, which can repel F− ions with the same electronic property. Furthermore, OH− ions can be adsorbed competitively on the surface of ZrO2 particles under basic condition, decreasing the adsorption capacity for F− ions.
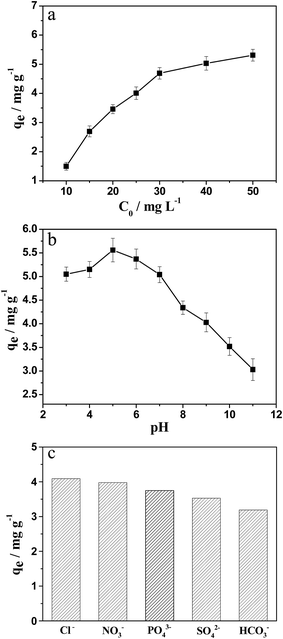 | ||
| Fig. 6 Effect of initial NaF concentration (a), pH value of NaF solution (b) and co-existing ions (c) on the fluoride adsorption of ZrO2–AG-600. | ||
Besides the F− ion in the environmental water, other ubiquitous co-existing anions, such as Cl−, NO3−, PO43−, SO42− and HCO3−, would compete for active sites of ZrO2 absorbents, and affect their working capacity for fluoride removal. In order to study the potential application of prepared ZrO2 samples for the practical system, the qe of ZrO2–AG-600 in the NaF solution with different co-existing anions, such as Cl−, NO3−, PO43−, SO42− and HCO3−, was determined. As shown in Fig. 6c, the order of co-existing anions affecting the qe of ZrO2–AG-600 is Cl− < NO3− < PO43− < SO42− < HCO3−. Since the HCO3− ion can form a stable penta cyclic complex with Zr4+ on the surface of ZrO2, it occupies competitively the active adsorption sites of ZrO2, resulting in the undesirable reduction of defluoridation performance. As for PO43− and SO42−, they carry more charges than Cl− and NO3−, thus exhibiting the stronger adsorption capacity on the surface of ZrO2 samples.
4. Conclusions
In this study, a facile bioinspired approach has been explored to synthesize mesoporous ZrO2 particles in agarose gels. After calcined at 600 °C for 2 h, the ZrO2 samples are primarily composed of tetragonal nanocrystals about 11.8 nm in size. Meanwhile, the ZrO2 samples possess bimodal mesopores of about 3.5 nm and 5.9 nm in diameter, which are generated by the templating of entrapped agarose gel fibers during the formation of ZrO2 particles. In addition, these ZrO2 particles exhibit much higher fluoride adsorption capacity than their counterpart synthesized in aqueous solution medium, which can be attributed to their high specific surface area and mesoporous structure. Hopefully, this study may afford a versatile approach for the preparation of mesoporous metal oxide materials in the gel medium under mild conditions.Acknowledgements
This research was supported by National Science Fund for Distinguished Young Scholars of China (no. 21125627), National Basic Research Program of China (2009CB724705), and the Program of Introducing Talents of Discipline to Universities (no. B06006).Notes and references
- H. Li, H. L. Xin, D. A. Muller and L. A. Estroff, Science, 2009, 326, 1244–1247 CrossRef CAS PubMed.
- Y. Shi, J. Q. Geng and D. Yang, Prog. Chem., 2010, 22, 2224–2231 CAS.
- E. Asenath-Smith, H. Li, E. C. Keene, Z. W. Seh and L. A. Estroff, Adv. Funct. Mater., 2012, 22, 2891–2914 CrossRef CAS.
- C. Duffus, P. J. Camp and A. J. Alexander, J. Am. Chem. Soc., 2009, 131, 11676–11677 CrossRef CAS PubMed.
- H. Li and L. A. Estroff, J. Am. Chem. Soc., 2007, 129, 5480–5483 CrossRef CAS PubMed.
- Y. Oaki and H. Imai, Cryst. Growth Des., 2003, 3, 711–716 CAS.
- H. Li and L. A. Estroff, Adv. Mater., 2009, 21, 470–473 CrossRef CAS.
- D. Yang, L. Qi and J. Ma, Chem. Commun., 2003, 1180–1181 RSC.
- A. Ethirajan, U. Ziener, A. Chuvilin, U. Kaiser, H. Coelfen and K. Landfester, Adv. Funct. Mater., 2008, 18, 2221–2227 CrossRef CAS.
- S.-P. Deng and J.-M. Ouyang, Chin. J. Chem., 2007, 25, 1379–1384 CrossRef CAS.
- H. Li, Y. Fujiki, K. Sada and L. A. Estroff, CrystEngComm, 2011, 13, 1060–1062 RSC.
- G. Gundiah, S. Mukhopadhyay, U. G. Tumkurkar, A. Govindaraj, U. Maitra and C. N. R. Rao, J. Mater. Chem., 2003, 13, 2118–2122 RSC.
- J. Zhou, M. Zhou and R. A. Caruso, Langmuir, 2006, 22, 3332–3336 CrossRef CAS PubMed.
- F. Huang, M. Zhou, Y.-B. Cheng and R. A. Caruso, Chem. Mater., 2006, 18, 5835–5839 CrossRef CAS.
- M. Zhou, F. Huang, X. Wang, J. du Plessis, A. B. Murphy and R. A. Caruso, Aust. J. Chem., 2007, 60, 533–540 CrossRef CAS.
- G. L. Drisko, V. Luca, E. Sizgek, N. Scales and R. A. Caruso, Langmuir, 2009, 25, 5286–5293 CrossRef CAS PubMed.
- G. L. Drisko, X. Wang and R. A. Caruso, Langmuir, 2011, 27, 2124–2127 CrossRef CAS PubMed.
- X. Ma, L. Klosterman, Y.-Y. Hu, X. Liu, K. Schmidt-Rohr, S. Mallapragada and M. Akinc, J. Am. Ceram. Soc., 2012, 95, 3455–3462 CrossRef CAS PubMed.
- X. Wang, G. I. N. Waterhouse, D. R. G. Mitchell, K. Prince and R. A. Caruso, ChemCatChem, 2011, 3, 1763–1771 CrossRef CAS.
- X. Wang, C. E. Egan, M. Zhou, K. Prince, D. R. G. Mitchell and R. A. Caruso, Chem. Commun., 2007, 3060–3062 RSC.
- Y. Wang, D. Yang, Y. Shi and Z. Jiang, J. Alloys Compd., 2013, 560, 42–48 CrossRef CAS PubMed.
- W. Zhou, E. I. Ross-Medgaarden, W. V. Knowles, M. S. Wong, I. E. Wachs and C. J. Kiely, Nat. Chem., 2009, 1, 722–728 CrossRef CAS PubMed.
- Z. Jin, F. Wang, J. Wang, J. C. Yu and J. Wang, Adv. Funct. Mater., 2013, 23, 2137–2144 CrossRef CAS.
- S. S. Ramamurthy, Y. Chen, M. K. Kalyan, G. N. Rao, J. Chelli and S. Mitra, J. Nanosci. Nanotechnol., 2011, 11, 3552–3559 CrossRef CAS PubMed.
- M. Alvarez, T. López, J. Odriozola, M. Centeno, M. Domínguez, M. Montes, P. Quintana, D. Aguilar and R. González, Appl. Catal., B, 2007, 73, 34–41 CrossRef CAS PubMed.
- D. Panda and T.-Y. Tseng, Thin Solid Films, 2013, 531, 1–20 CrossRef CAS PubMed.
- H. Luthy, O. Loeffel and C. H. F. Hammerle, Dent. Mater., 2006, 22, 195–200 CrossRef PubMed.
- J. A. Navio, M. C. Hidalgo, G. Colon, S. G. Botta and M. I. Litter, Langmuir, 2001, 17, 202–210 CrossRef CAS.
- M. Z. C. Hu, M. T. Harris and C. H. Byers, J. Colloid Interface Sci., 1998, 198, 87–99 CrossRef CAS.
- P. Jakubus, A. Adamski, M. Kurzawa and Z. Sojka, J. Therm. Anal. Calorim., 2003, 72, 299–310 CrossRef CAS.
- X. Xu and X. Wang, Nano Res., 2009, 2, 891–902 CrossRef CAS.
- F. Woudenberg, W. Sager, N. Sibelt and H. Verweij, Adv. Mater., 2001, 13, 514–516 CrossRef CAS.
- K. Venkatachari, D. Huang, S. P. Ostrander, W. A. Schulze and G. C. Stangle, J. Mater. Res., 1995, 10, 748–755 CrossRef CAS.
- Y. Zheng, H. Li, T. Zhou, J. Zhao and P. Yang, J. Alloys Compd., 2013, 551, 475–480 CrossRef CAS PubMed.
- F. Deyhimi and R. Salamat-Ahangarl, Talanta, 2003, 61, 493–499 CrossRef CAS.
- K. Tang, J. Zhang, W. Yan, Z. Li, Y. Wang, W. Yang, Z. Xie, T. Sun and H. Fuchs, J. Am. Chem. Soc., 2008, 130, 2676–2680 CrossRef CAS PubMed.
- N. Zhao, D. Pan, W. Nie and X. Ji, J. Am. Chem. Soc., 2006, 128, 10118–10124 CrossRef CAS PubMed.
- J. Lin, Y. Lin, P. Liu, M. J. Meziani, L. F. Allard and Y. P. Sun, J. Am. Chem. Soc., 2002, 124, 11514–11518 CrossRef CAS PubMed.
- A. Mondal and S. Ram, J. Am. Ceram. Soc., 2004, 87, 2187–2194 CAS.
- M. Z. C. Hu, R. D. Hunt, E. A. Payzant and C. R. Hubbard, J. Am. Ceram. Soc., 1999, 82, 2313–2320 CrossRef CAS PubMed.
- K. Matsui and M. Ohgai, J. Am. Ceram. Soc., 1997, 80, 1949–1956 CrossRef CAS PubMed.
- B. Pan, J. Xu, B. Wu, Z. Li and X. Liu, Environ. Sci. Technol., 2013, 47, 9347–9354 CrossRef CAS PubMed.
- X. Dou, D. Mohan, C. U. Pittman, Jr. and S. Yang, Chem. Eng. J., 2012, 198, 236–245 CrossRef PubMed.
- J. M. Hernandez Enriquez, L. A. Cortez Lajas, P. Garcia Alamilla, A. Castillo Mares, G. Sandoval Robles and L. A. Garcia Serrano, J. Alloys Compd., 2009, 483, 425–428 CrossRef CAS PubMed.
| This journal is © The Royal Society of Chemistry 2014 |

