DOI:
10.1039/C4RA08568J
(Paper)
RSC Adv., 2014,
4, 49819-49826
Electrochemical detection of adenine and guanine using a self-assembled copper(II)–thiophenyl-azo-imidazole complex monolayer modified gold electrode†
Received
13th August 2014
, Accepted 29th September 2014
First published on 30th September 2014
Abstract
Electrochemical detection of adenine (A) and guanine (G) using the self-assembled monolayer of copper(II)–thiophenyl-azo-imidazole modified gold electrode (Cu2+–IATP–Au) is reported. The self-assembled momolayer of 4-(2′-imidazolylazo)thiophenol (IATP) on a gold electrode surface was prepared by covalent immobilization of imidazole onto a 4-aminothiophenol monolayer modified gold electrode by a diazotization-coupling reaction. The catalyst was formed by immobilizing Cu(II) ion on the IATP modified gold electrode. The modified gold electrode was characterised by Field emission scanning electron microscopy, Energy dispersive X-ray analysis, Infrared spectroscopy, Cyclic voltammetry and Electrochemical Impedance spectroscopic techniques. The Cu2+–IATP–Au electrode exhibits excellent electrocatalytic activity towards the oxidation of A and G. Without separation or pre-treatment, the modified electrode can detect A and G simultaneously in a mixture and DNA samples. In the presence of excess common interferents such as ascorbic acid, citric acid, cysteine, glucose, Na+, K+, Cl−, SO42− had no effect on the peak current of A and G. In differential pulse voltammetry measurement, the oxidation current response of A and G was increased linearly in the concentration range 10–60 μM and the detection limit was found to be 0.06 μM and 0.01 μM (S/N = 3), respectively. The proposed method was applied to determine adenine and guanine in herring sperm DNA and the result was satisfactory.
1. Introduction
Adenine (A) and Guanine (G) are the building blocks of nucleic acids and play an important role in genetic information storage and protein biosynthesis and fulfill a variety of functions in the metabolism of the cell.1 The abnormal changes of the concentration of A and G in nucleic acid may cause several diseases, including Parkinson's disease, carcinoma and liver diseases.2 Hence, the determination of A and G has great significance in bioscience and clinical diagnosis. Various methods have been applied for their detection and measurement, such as chromatography,3 electrophoresis,4 chemical luminescence,5 spectrophotometry6 or surface enhanced Raman scattering.7 These methods are excellent but have several shortcomings such as high cost, high time consumption and tedious pretreatment steps.
For routine analysis electrochemical techniques are very promising due to low cost, high sensitivity, high selectivity and ease of miniaturization. They are suitable for analysis of A and G individually or simultaneously,8 still the electrochemical methods suffer problems for the detection of nucleic bases such as slow electron transfer kinetics, high overpotential and overlapping of their oxidation peaks. To overcome the problems, chemical modification of electrode surface with suitable materials is always beneficial. Varieties of materials have been used for the electrode surface modification and used them to electrochemical detection of A and G. Cyclodextrin modified poly(N-acetylaniline) film,9 Graphene oxide intercalated by self-doped polyaniline nanofibers10 or cobalt(II)phthalocyanine modified carbon paste electrode,11 Porous silicon supported Pt–Pd nanoalloy modified carbon nanotube paste electrode,12 glassy carbon electrode modified with overoxidized polypyrrole/graphene,13 multiwall carbon nanotubes (MWCNTs) decorated with NiFe2O4 magnetic nanoparticles,14 silver nanoparticles(AgNPs)–polydopamine(Pdop)@graphene(Gr)composite,15 single-stranded DNA–poly(sulfosalicylic acid)composite film,16 TiO2 nanobelts,17 graphene-COOH,18 1,8,15,22-tetraaminophthalocyanatonickel(II),19 Iron hexacyanoferrate film,20 azocalixarene,21 graphene–Nafion composite film,22 fullerene-C60 (ref. 23) and gold electrode modified with n-octadecylmercaptan, followed by controllable adsorption of graphene sheets24 have been used for the electrochemical oxidation and detection of A and G. However, these modified electrodes have some drawbacks such as stability, reproducibility and use of costly chemicals for electrode modification. In this context, the development of novel, chip and simple strategy for electrode modification is highly desirable. Diazonium salt has been extensively used for the electrode surface modification.25 Diazonium group functionalized electrode surface can coupled with phenolic, imidazole or amino groups to form different diazotized compounds26 which are capable of forming metal complexes. There are many reports that metal-azo complexes can interact with the DNA bases and is important in the field of anticancer drug research.27 A and G formed complexes with metals including copper, has been extensively studied by electrochemical methods.28 A number of articles have been devoted to the catalytic and electrocatalytic activity of copper(II) modified electrode for the redox reaction of organic and biological compounds. For example, electrocatalytic oxidation of hydroquinone with copper(II)-L-cysteine29 and copper(II)-5-amino-2-mercaptobenzimidazole30 complex monolayer modified gold electrode, catalytic oxidation of L-cysteine in oxygen-saturated aqueous solution by copper(II) supported on a polymer,31 determination of cysteine at a glassy carbon electrode modified by copper(II) ions,32 determination of ascorbic acid using dinuclear copper salicylaldehyde-glycine schiff base modified GC electrode33 and copper(II)–zeolite modified electrode,34 electrocatalytic oxidation of carbohydrates at copper(II) oxide modified electrode35 and certain catecholamines such as dopamine, L-dopa, epinephrine and norepinephrine using copper(II) complex and AgNPs modified glassy carbon paste electrode.36
In the present study, we have used a self assembled copper(II) containing azoimidazole complex modified gold electrode for the detection of purine bases, A and G, individually and simultaneously in the physiological pH. Electrode modification process and the electrochemical oxidation behaviour of A and G over the modified electrode were studied in detail. The modified electrode has also been applied for the detection of DNA bases in real sample.
2. Experimental
2.1. Chemicals and reagents
4-Aminothiophenol (4-ATP) and NaClO4 were purchased from Sigma-Aldrich (India). Imidazole, CuSO4·5H2O, and K4[Fe(CN)6]·3H2O were purchased from Merck (India) and were used as received. Denatured herring sperm DNA, A, G were purchased from Sigma-Aldrich (India). Phosphate buffer solution was prepared by mixing 0.1 M NaClO4 and 0.01 M H3PO4 and the pH's were adjusted by the addition of 0.11 M NaOH using Smalley's method.37 Water was purified by double distillation with alkaline KMnO4.
2.2. Apparatus and instrumentations
The field emission scanning electron microscopy (FE SEM) images and Energy dispersive X-ray (EDAX) analysis data were obtained using FE-SEM, FEI INSPECT F50 operated at an acceleration voltage of 20 kV. FTIR spectra were recorded on a Shimadzu 8400S spectrometer. Electrochemical measurements were performed on a CHI 660C Electrochemical workstation (CH Instrument, USA). A three electrode system was employed with gold or modified gold electrode as working electrode, Pt wire as counter electrode and Ag/AgCl (3 M KCl) as reference electrode. The pH measurements of solutions were carried out on a pH meter (Macro Scientific works (Regd), New Delhi).
2.3. Electrode pre-treatment and immobilization of 4-(2′-imidazolylazo)thiophenol over gold electrode
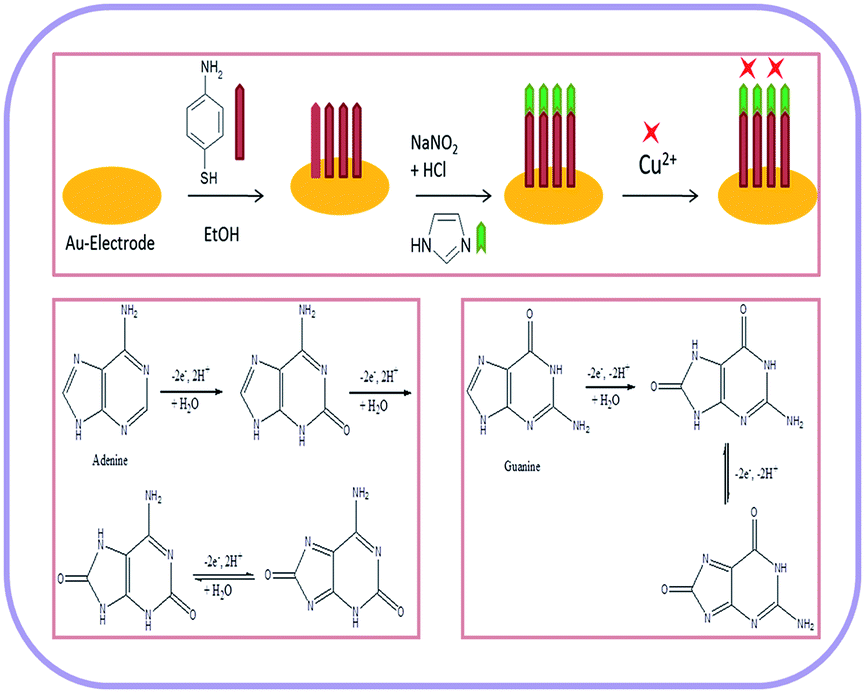
A gold electrode (2 mm in diameter) was polished with 0.05 μm α-alumina on a polishing pad and rinsed extensively with anhydrous ethanol and distilled water. Then the gold electrode was electrochemically cleaned in 0.5 M H2SO4 until a steady characteristic gold oxide cyclic voltammogram was obtained.38 The cleaned gold electrode was immersed into the 4-ATP (1 mM) solution for 20 hours. The self-assembled 4-ATP monolayer was formed over electrode surface via gold–sulfur interaction and the modified electrode was thoroughly washed with ethanol and distilled water. After that the 4-ATP–Au electrode was dipped into a 0.1 M HCl solution at 2–4 °C, and 0.1 g NaNO2 solution was added slowly. After 30 minute incubation, the diazotized modified gold electrode (diazo-ATP–Au) was removed and rinsed with ice cold distilled water. For coupling with imidazole, the diazo-ATP–Au electrode was immersed into aqueous 0.025 M imidazole solution for 30 minutes at 2–4 °C in stirring condition. Finally, the 4-(2′-imidazolylazo)thiophenol modified gold electrode (IATP–Au) was rinsed with distilled water and dried in air (Fig. 1).
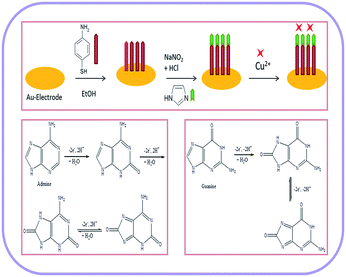 |
| | Fig. 1 Schematic representation for the fabrication of gold electrode and the electrochemical oxidation mechanism of adenine and guanine. | |
2.4. Copper complexation on IATP–Au electrode
The IATP–Au electrode was immersed into 1 × 10⁻³ M CuSO4 solution (containing 0.1 M KNO3) at pH 5.6 and stirred for 4 hours. After complexation, the electrode (Cu2+–IATP–Au) was washed thoroughly with distilled water and then dried in air for further experiment.
3. Results and discussion
3.1. Choice of materials
Copper has unique coordination chemistry which renders it suitable for many enzymatic reactions, such as superoxide dismutase (SOD), ascorbic acid oxidase, cytochrome-c-oxidase actions.39 Imidazole moiety can be found in almost all copper(II) enzymes. In biological system, superoxide dismutase catalyses the dismutation of poisonous superoxide to O2 and H2O2. Copper(II) is the catalytic center in SOD, on reduction by superoxide O2−, blue [CuII(his−) (his-H)3] changes to colourless [CuI(his-H)4]. Ascorbic acid oxidase is a blue copper(II) containing protein that catalyses the oxidation of ascorbic acid to dehydroascorbic acid by O2. Cytochrome-c-oxidase is a terminal enzyme in the respiratory chain. It brings about the oxidation of the reduced form of [FeII(Cyt-c)red] with concomitant reduction of molecular oxygen to water. These inspire us to make the biomimetic catalyst containing Cu(II)-imidazole moiety which can oxidise the purine bases, adenine and guanine and at the same time determine the concentration. Verities of nanomaterials, nano composites and few metal complexes have been used so far for electrode modification and applied for elctrocatalytic oxidation of adenine and guanine.9–24 Similarly, different copper(II) ion modified electrodes have been used for electrocatalytic oxidation of various organic and biologically important molecules.29–36 For the first time, we have modified gold electrode by the self-assembled copper(II)–thiophenyl-azo-imidazole complex monolayer and utilized this bio-mimetic sensor for the electrocatalytic oxidation of adenine and guanine in physiological pH. The proposed sensor exhibited a simple, rapid and sensitive determination of adenine and guanine individually as well as simultaneously with low detection limit.
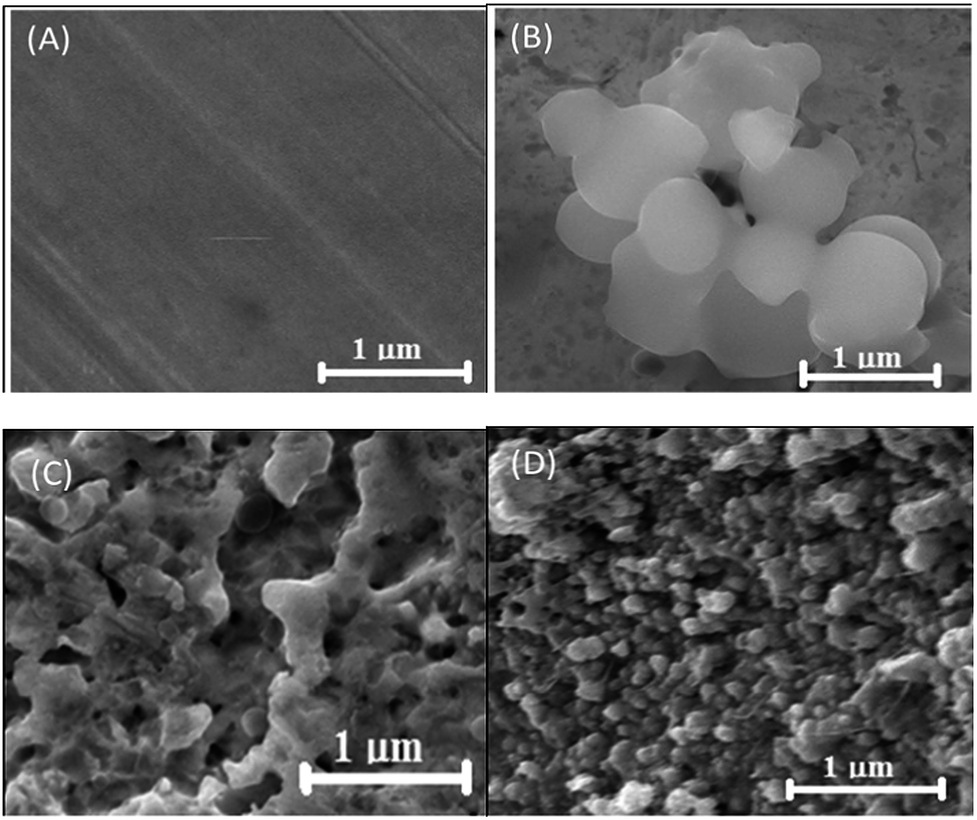
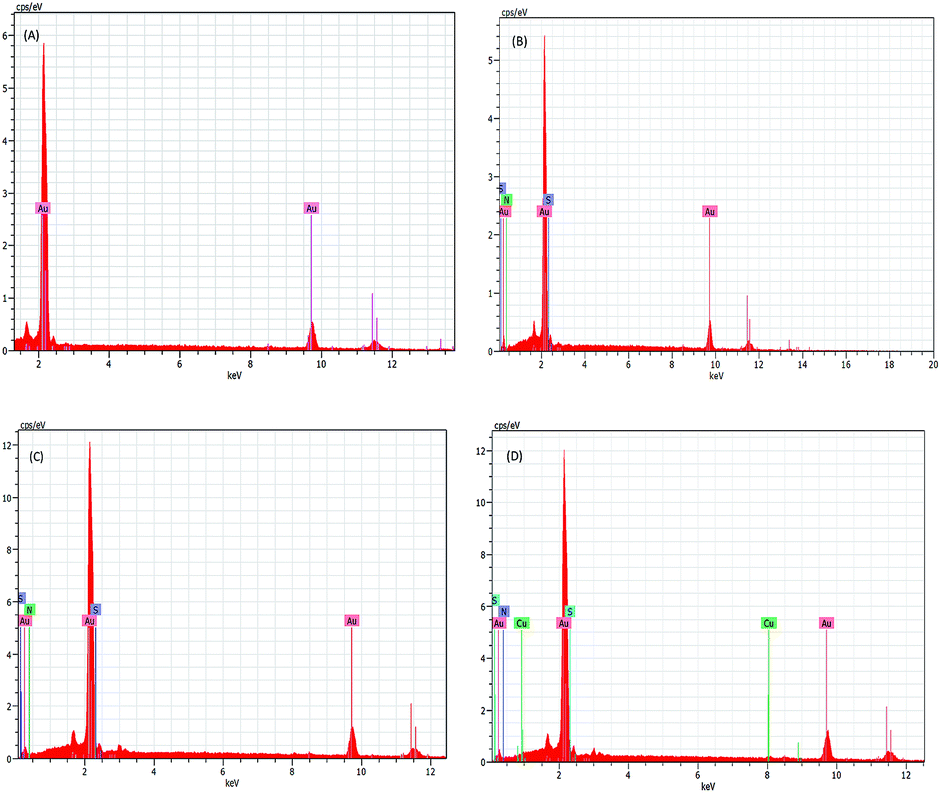
3.2. Surface morphology of the Cu2+–IATPmodified gold electrode
The step wise modification and surface morphology of the bare and self-assembled monolayer modified gold electrodes were characterised by FE SEM. Fig. 2(A–D) shows the clear change of surface morphology and suggested the formation of Cu2+–IATP film on gold surface. EDAX images (Fig. 3(A–D)) also confirms the step wise modification. In the FTIR spectra, 4-ATP modified gold electrode shows two absorbance peaks at 3443 and 3342 cm−1 due to presence of NH2 group. After diazotization and coupling with imidazole these peaks are absent but a new peak appeared at around 1376 cm−1 due to –N![[double bond, length as m-dash]](https://www.rsc.org/images/entities/char_e001.gif) N–bond formation. After complexation with copper(II) ion the –NN–stretching frequency decreased due to back donation from copper to –NN–π* orbital and the azo peak observed at 1366 cm−1. Along with these a new peak observed at 460 cm−1 and is due to Cu–N bond stretching which also supports the Cu2+–IATP–Au modification (Fig. 4).
N–bond formation. After complexation with copper(II) ion the –NN–stretching frequency decreased due to back donation from copper to –NN–π* orbital and the azo peak observed at 1366 cm−1. Along with these a new peak observed at 460 cm−1 and is due to Cu–N bond stretching which also supports the Cu2+–IATP–Au modification (Fig. 4).
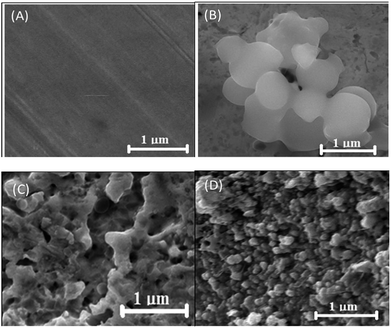 |
| | Fig. 2 SEM images of bare (A), 4-ATP modified (B), IATP modified (C), Cu2+–IATP modified gold electrode (D). | |
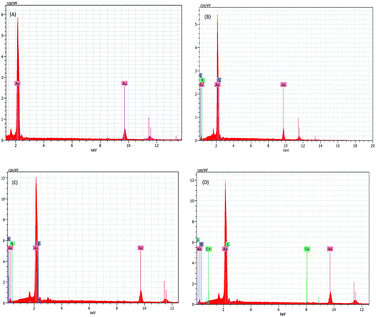 |
| | Fig. 3 EDAX spectrum of bare (A), 4-ATP modified (B), IATP modified (C), Cu2+–IATP modified gold electrode (D). | |
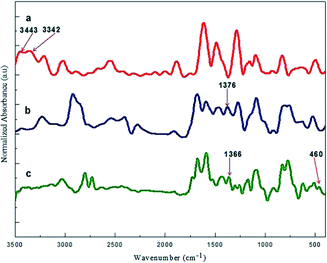 |
| | Fig. 4 FTIR spectra of (a) 4-ATP modified, (b) IATP modified and (c) Cu2+–IATP modified gold electrode. | |
3.3. Electrochemical characterisation of the Cu2+–IATP modified gold electrode
The stepwise modification was examined by CV using [Fe(CN)6]3−/4− as redox probe in 0.1 M PBS buffer at pH 7 (Fig. 5). For the bare electrode the cyclic voltammogram of 0.5 mM [Fe(CN)6]4− exhibit electrochemically reversible redox couple. However, 4-ATP modified Au electrode, the cyclic voltammogram of [Fe(CN)6]4− exhibit an irreversible feature with low current height than that of bare gold. The current height decreases even more when diazotized (diazo-ATP–Au) and imidazole coupled (IATP–Au) gold electrode was used. The experimental results indicate that the electronic communication between Au and [Fe(CN)6]4− is blocked due to SAM formation. Electrochemical impedance spectroscopy supports the CV results. In the Nyquist plot the diameter of the semi-circle decreases gradually when step wise modification on the gold electrode surface was carried out. The observed trend (Fig. 6) is due to the fact that the modified electrode blocked the electron transfer rate for the oxidation of [Fe(CN)6]4−.
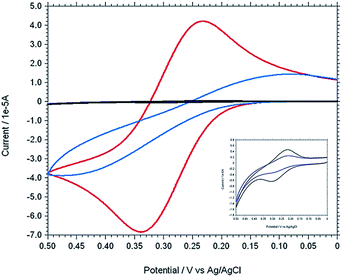 |
| | Fig. 5 Cyclic voltammograms of 0.5 mM K4[Fe(CN)6] in 0.1 M PBS at pH 7 using different working electrode [bare Au (red), ATP–Au (light blue), ATP–N+2–Au (dark blue) and IATP–Au (black)]. [Inset: enlarge figure of two overlapping curve for ATP–N+2–Au (dark blue) and IATP–Au (black)]. | |
 |
| | Fig. 6 Nyquist plot (−Z′′ versus Z′) of 0.5 mM K4[Fe(CN)6] in 0.1 M PBS at pH = 7.0 using various working electrode from impedance measurement [bare Au (red), mod Au with 4-ATP (light blue), Au–ATP–N+2 (dark blue) and Au–IAT (black)], Eac = 5 mv, and frequency range: 0.1 Hz to 10![[thin space (1/6-em)]](https://www.rsc.org/images/entities/char_2009.gif) 000 Hz. 000 Hz. | |
The IATP–Au can form a neutral monolayer at pH 7. The faradic currents for the probe redox reaction were decrease (Fig. 5) when modified the gold electrode surface with IATP. Reasonably, hydrogen bonds have more chance to form between imidazolic NH and π–π staking are more effectively formed in this condition. A value may be obtained for surface coverage θ = 0.99 using θ = [1 − (ip/i0p)] relation40 where i0p and ip are peak currents of redox probe at bare and IATP–Au electrodes, respectively under the same condition. The value obtained for i0p and ip were 3.717 × 10⁻⁵ μA and 4.610 × 10⁻⁷ μA at pH = 7.0. From EIS spectra the Rct was increased from bare Au (7.736 × 10³ Ω) to IATP–Au (5.817 × 10⁴ Ω). This difference is due to insulation effects originated from assemblies of neutrally charged IATP layer at pH 7. Assuming that all the current passes through pin-holes and defects, a value may be obtained for θ using θ = [1 − (R0ct/Rct)] relation,40 where R0ct and Rct are the charge transfer resistance of redox probe at bare Au and IATP–Au electrodes under the similar conditions and a value of 0.87 was estimated for θ. The difference observed between θ values obtained from CV and EIS method may be attributed to the contribution of tunnelling effects.41
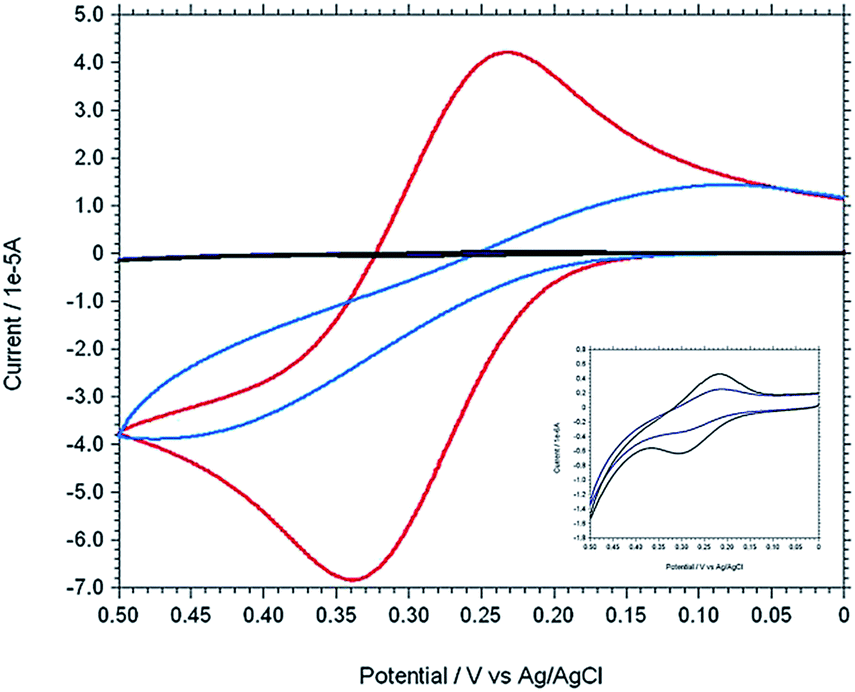
In order to confirm the Cu(II) complexation with azoimidazole on the gold surface (IATP–Au), a comparable CV was taken for bare Au, IATP–Au and Cu2+–IATP–Au in 0.1 M PBS buffer at pH 7 (Fig. S1†). A Cu2+/Cu+ redox couple (E1/2 = 0.3 V, ΔE = 120 mV) supports the formation of Cu2+–IATP–Au SAM. Fig. S2† shows the cyclic voltammograms for different concentration (0.1 mM to 0.7 mM) of Cu(II) ion on the IATP–Au modified electrode. Both cathodic and anodic peak current increased with increasing concentration of Cu(II) ions. The influence of pH of the electrolytic solution on the electrochemistry of Cu(II)azo-imidazole complex over Au electrode was studied. The cathodic peak current reached the maximum value at pH 7.0 (Fig. S3†) which indicates that at this pH strong complexation takes place. Electrochemical impedance spectra of the bare and modified electrodes were taken in 0.1 M PBS buffer at pH 7 and from the Nyquist plot it is clearly shows that the RCT value for Cu2+–IATP–Au electrode is less than IATP–Au or bare Au.
3.4. Electrochemical oxidation of adenine and guanine
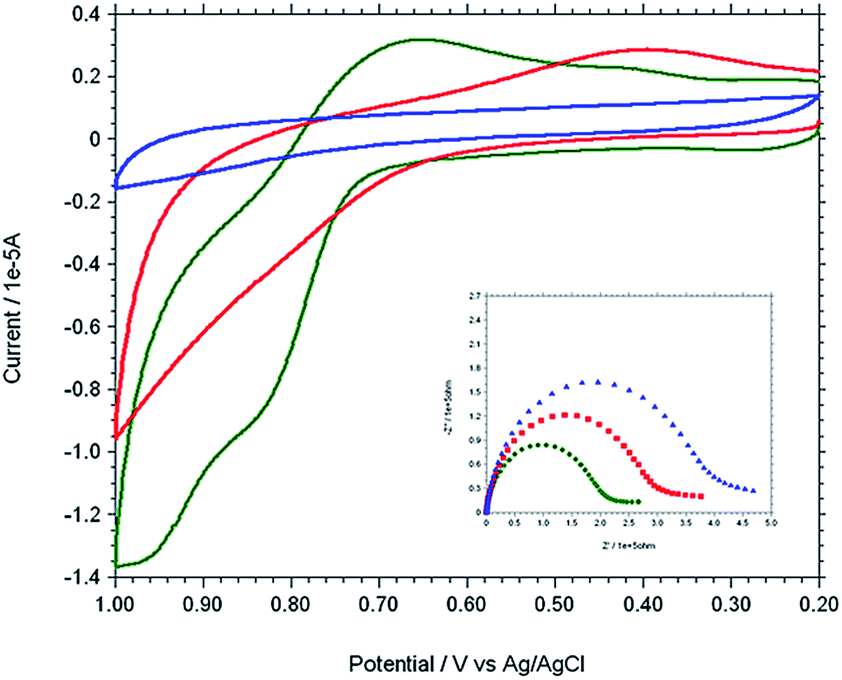
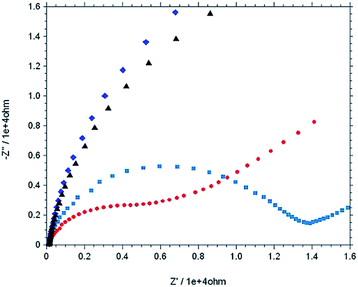
The modified gold electrode Cu2+–IATP–Au was used for the electrochemical oxidation of nucleobases A and G. Fig. 7 shows the cyclic voltammograms of 1 mM guanine in 0.1 M PBS (pH 7) using the bare Au (red curve), IATP–Au (blue curve) and Cu2+–IATP–Au (green curve) electrodes. For bare Au and IATP–Au electrode manifested only a featureless voltammetric profile between 0 to +1.0 V whereas in case of Cu2+–IATP–Au electrode two irreversible oxidation peaks appeared at +0.85 V and 0.96 V for guanine. An irreversible oxidation peak was observed at +1.2 V for adenine when Cu2+–IATP–Au electrode used as working electrode (Fig. 8). No such prominent peak was observed when bare Au (red curve) and IATP–Au (blue curve) electrodes was used under similar condition. The detailed oxidation mechanism of purine bases is shown in Fig. 1. Electrochemical oxidation of guanine followed a two step mechanism with loss of two electrons and two protons in each step and the first step was rate-determining step42 on the other hand adenine underwent a multistep six electron six protons oxidation involving irreversible chemical steps.43
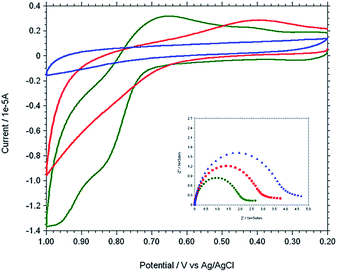 |
| | Fig. 7 Overlaid cyclic voltammogram and Nyquist plot (inset) of 1 mM Guanine in 0.1 M PBS solution at pH 7 using different working electrodes. [Bare Au (red), IATP–Au (blue) and Cu2+–IATP–Au (green)]. | |
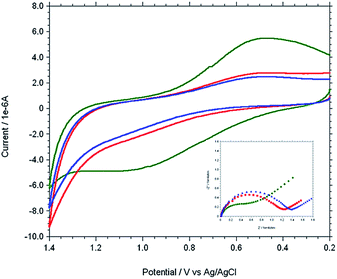 |
| | Fig. 8 Overlaid cyclic voltammogram and Nyquist plot (−Z′′ versus Z′) (inset) of 1 mM adenine in 0.1 M PBS solution at pH 7 using different working electrode. [bare Au (red), IATP–Au (blue) and Cu2+–IATP–Au (green)]. | |
EIS was carried out for both A and G at pH 7.0 (PBS buffer) using the modified and bare electrodes. The diameter of the semicircle observed in the Nyquist plot corresponds to charge transfer resistance, Rct; the smaller the semi-circle, faster is the charge transfer.44 Fig. 7 and 8 (inset) shows that the diameter of semi-circle (Rct) changes upon modification of gold electrode surface. The Rct values in different electrode system shows the following tread: IATP–Au (3.9 × 10⁵ Ω) > bare Au (2.9 × 10⁵ Ω) > Cu2+–IATP–Au (1.9 × 10⁵ Ω) and IATP–Au (13.3 × 10³ Ω) > bare Au (11.7 × 10³ Ω) > Cu2+–IATP–Au (7.2 × 10³ Ω) for G and A, respectively. The observed trend is due to the fact that the copper(II) complex modified electrode ease the electron transfer rate for the oxidation of A and G whereas IATP modified gold electrode blocked the electron transfer. Electrochemical impedance measurements clearly indicate that Cu2+–IATP–Au SAM modified electrode has lower resistance as compared to the bare Au and IATP–Au electrodes. This study reveals that the Cu2+–IATP–Au SAM modified electrode is an efficient electrocatalyst for A and G oxidation.
3.5. Determination of adenine and guanine using DPV
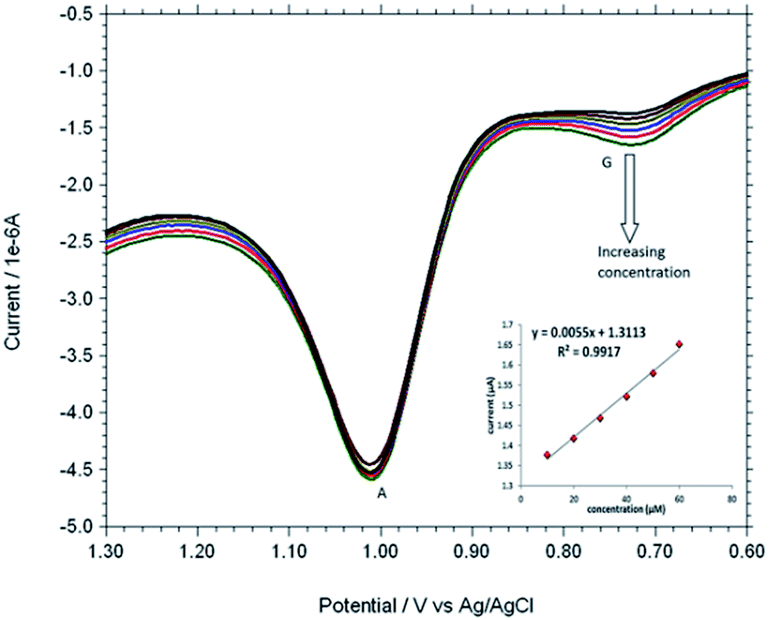
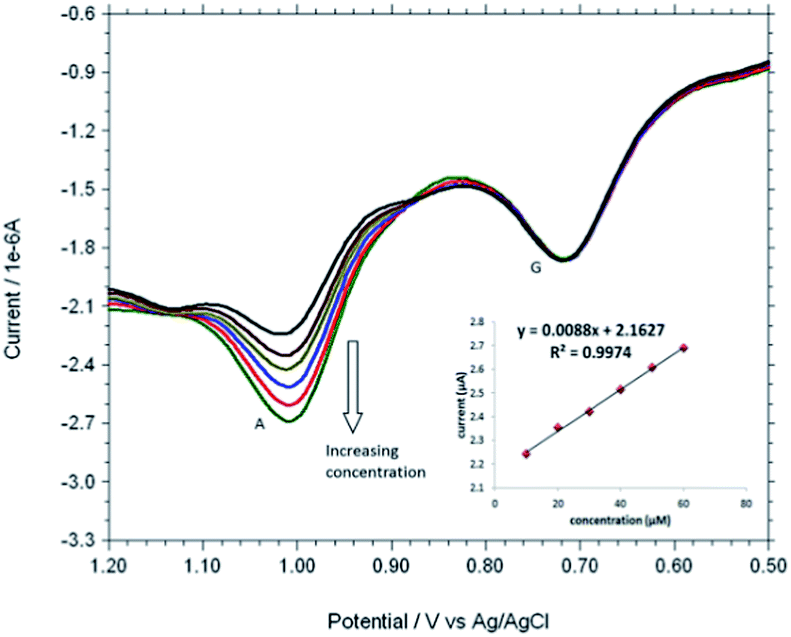
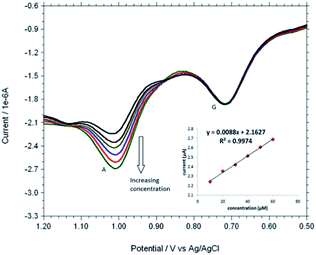
Based on the optimum conditions, the individual and simultaneous determination of A and G were performed using DPV. Fig. S4† shows the DPV curves of G with different concentration. In the individual determination of purine bases the oxidation peak current of G was linear with its concentration in the range of 150–600 μM (Inset Fig. S4†). The detection limit for G is estimated to be 0.007 μM (S/N = 3). Fig. S5† indicated that oxidation peak current of A increased linearly in the range of 150–600 μM. The detection limit for A was 0.058 μM (S/N = 3). Fig. 9 shows the DPV curves of G with different concentrations in the presence of 100 μM A and the oxidation peak current of G was linear with its concentration range of 10–60 μM. The regression equation was Ipa = 0.0055c + 1.3113 (R2 = 0.9917, 95% confidence limit for the slope = ±0.10 and intercept = ±0.42) with a detection limit of 0.01 μM (S/N = 3). Similarly, Fig. 10 shows the DPV curves of A with different concentrations in the presence of 100 μM G and the oxidation peak current of A increased linearly in the concentration range of 10–60 μM. The regression equation was Ipa = 0.0088c + 2.1627 (R2 = 0.9974, 95% confidence limit for the slope = ±0.09 and intercept = ±0.31) with a detection limit of 0.06 μM (S/N = 3). For further evaluating the feasibility of the Cu2+–IATP–Au electrode for A and G determination simultaneously by simultaneous changing their concentration (Fig. S6†). All the results indicated that the simultaneous and sensitive detection of A and G could be achieved at copper(II) complex modified gold electrode. Table 1 shows a comparison of the proposed electrochemical method and the other modified electrodes reported for adenine and guanine. It can be seen that the detection limit and linear range of the proposed method are comparable with the reported methods.
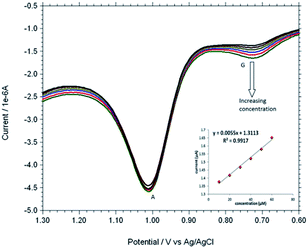 |
| | Fig. 9 Overlaid DPV for each increment of 10 μM G to 100 μM A at Cu2+–IATP SAM modified gold electrode in 0.1 M PBS buffer solution at pH 7.0. | |
 |
| | Fig. 10 DPVs obtained for each 10 μM A to 100 μM G at Cu2+–IATP SAM modified gold electrode in 0.1 M PBS buffer solution at pH 7.0. | |
Table 1 Comparative account of different electrochemical sensors for the determination of adenine and guaninea
| Electrode |
Adenine |
Guanine |
Reference |
| Linear range (μM) |
Detection limit (μM) |
Linear range (μM) |
Detection limit (μM) |
| GNO: single-layered graphene oxide, SPANI: sulfonated polyaniline, Pt–Pd/Psi: porous silicon supported Pt–Pd nanoalloy, PPyox/GR: overoxidized polypyrrole/graphene, MWCNT/NiFe2O4: multiwall carbon nanotubes (MWCNTs) decorated with NiFe2O4 magnetic nanoparticles, AgNPs–Pdop@Gr: Ag nanoparticles (AgNPs)–polydopamine(Pdop)@graphene(Gr)composite, PSSA–ssDNA: poly(sulfosalicylic acid) and single-stranded DNA composite, graphene-COOH: carboxylic acid functionalized graphene, 4α-NiIITAPc: 1,8,15,22-tetraaminophthalocyanatonickel(II), FeHCF: iron hexacyanoferrate film. |
| GNO–SPAN/CPE |
0.5–200 |
0.05 |
0.5–200 |
0.075 |
10 |
| Pt–Pd/PSi/CNPE |
0.1–10 |
0.03 |
0.1–10 |
0.02 |
12 |
| PPyox/GR/GCE |
0.06–100 |
0.02 |
0.04–100 |
0.01 |
13 |
| MWCNT/NiFe2O4/GCE |
0.1–4.0 |
0.01 |
0.05–3.0 |
0.006 |
14 |
| AgNPs–Pdop@Gr/GCE |
0.02–40 |
0.002 |
0.02–40 |
0.004 |
15 |
| PSSA–ssDNA/GCE |
0.065–1.1 |
0.02 |
0.065–1.1 |
0.02 |
16 |
| Graphene-COOH/GCE |
0.5–200 |
0.025 |
0.5–200 |
0.05 |
18 |
| 4α-NiIITAPc/GCE |
— |
— |
10–100 |
0.03 |
19 |
| FeHCF/GCE |
— |
— |
0–145 |
0.10 |
20 |
| Azocalix[4]arene/GCE |
0.125–200 |
0.07 |
0.125–200 |
0.05 |
21 |
| Cu2+–IATP–Au |
10–60 |
0.06 |
10–60 |
0.01 |
This work |
3.6. Effect of accumulation time and potential
The effect of accumulation time on the oxidation behaviour of adenine and guanine at Cu2+–IATP–Au electrode was investigated by DPV. Fig. S7(a)† shows that both the oxidation peak current of A and G increased slowly with increasing accumulation time from 0–150 s and thereafter they remain constant. Therefore, an accumulation time of 150 s was chosen as the optimum time for further study. In addition, the influence of accumulation potential on the peak current was examined over the potential range 0.0 to 0.6 V and 0.0 to 0.5 V for adenine and guanine, respectively Fig. 7(b). The peak current decreased by changing accumulation potential to more positive value and is due to the oxidation of A and G during the accumulation step at potential higher than 0.6 V and 0.5 V for adenine and guanine, respectively. In fact, the maximum observed currents were equal to those observed for open circuit accumulation.
3.7. Effect of scan rate and pH
The oxidation peak current of adenine and guanine increased linearly with the scan rate in the range of 10–90 mV s−1 (Fig. S8†) following the linear regression equation Ipa (μA) = 0.0323 ν (mV s−1) − 0.0624 (R2 = 0.9939) and Ipa (μA) = 0.0393 ν (mV s−1) + 4.7321 (R2 = 0.9925) for adenine and guanine, respectively. These indicated that the electrooxidation reactions of adenine and guanine at Cu2+–IATP–Au electrode were the surface controlled process. The effect of pH on the electrooxidation of A and G were also investigated in the range of pH 3.0–9.0. As shown in Fig. S9† the oxidation peak potential A and G were pH dependent and that they shifted toward more negative potential with increments in solution pH following the linear regression equation of Epa (V) = −0.059 pH + 1.421 (R2 = 0.994) and Epa (V) = −0.060 pH + 1.169 (R2 = 0.993), respectively. The slope of 59.0 and 60.0 mV per pH indicated that equal numbers of protons and electrons were involved in the electrode reaction process.45 Investigation of the influence of pH on the peak current of purine bases at the modified gold electrode revealed that that peak current of A and G reached a maximum at pH 7.0 and then decreased by increasing pH of the solution (Fig. S9†). On the other hand Cu(II) complexation with azoimidazole on the gold surface (IATP–Au) is maximum at pH 7.0. Considering both results, we have chosen pH 7.0 for the subsequent experiments.
3.8. Interference, reproducibility and stability
The current responses of A and G were studied in presence of some common electroactive interferences such as ascorbic acid, citric acid, cysteine, glucose, Na+, K+, Cl− and SO42− in 0.1 M PBS. A 1000 fold excess of ascorbic acid, citric acid, cysteine, glucose, Na+, K+, Cl− and SO42− had no effect on the peak currents of the A and G. A representative DPV is given in Fig. S10† where ascorbic acid was used 1000 fold excess in A and G mixture. The modified electrode shows reproducible results for A and G. The reproducibility of the modified electrode was examined by 8 successive DPV measurements of A and G in PBS solution. The results showed a relative standard deviation (RSD) of 0.5%, indicating that the electrode has good reproducibility. The modified electrode also displays good storage stability if kept in aqueous medium at room temperature over a period of 30 days.
3.9. Real sample analysis
The copper(II) complex modified gold electrode, Cu2+–IATP–Au, was used to determine DNA bases simultaneously in the denatured herring sperm DNA sample. Fig. 11 shows the overlaid DPV of PBS, herring sperm DNA solution and after addition of standard A, G solution in herring sperm DNA solution. The DPV of herring sperm DNA clearly shows four oxidation peaks for four DNA bases. The content of A and G in herring sperm DNA were calculated using the standard addition method and direct interpolation of the linear regression. The results are summarised in Table 2 and agree with the data reported in literature.21 The accuracy of the method was also verified by recovery studies adding standard DNA base solution to the real sample and 99–100% recoveries were obtained.
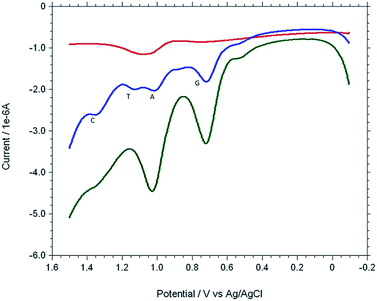 |
| | Fig. 11 Overlaid DPVs of 0.1 M PBS solution (red), herring sperm DNA solution (blue) and after addition of standard A, G solution in herring sperm DNA solution (green). | |
Table 2 Determination of A and G in herring sperm DNA sample with copper(II) complex modified gold electrode
| Bases |
Detected (μM) |
Added (mM) |
Found (mM) |
Recovery (%) |
| A |
4.4 ± 0.04 |
1.0 |
0.99 |
99.0 |
| G |
3.5 ± 0.01 |
1.0 |
1.004 |
100.4 |
4. Conclusions
A novel electrochemical sensor has been prepared and is used to detect A and G individually, simultaneously in a mixture and in herring sperm DNA. The electrochemical oxidation of A and G was studied using cyclic voltammetry and a prominent anodic oxidation peak was observed using Cu2+–IATP–Au modified electrode. EIS results show the following order of charge transfer resistance: IATP–Au > bare Au > Cu2+–IATP–Au for A and G in PBS (pH 7) and supports the electrocatalytic nature of copper complex modified gold electrode. Distinguishable oxidation peaks of the A and G can be obtained using Cu2+–IATP–Au modified electrode which is very helpful to analyse DNA fragments simultaneously. The modified electrode showed high sensitivity, low detection limit, higher reproducibility and good stability. Moreover, the electrode modification process is easy, economic as well as reproducible. The new sensor can be used for clinical diagnosis and genetic research.
References
- W. Saenger, in Principles of Nuclic acid structure, ed. C. R. Cantor, Springer, New York, 1984 CrossRef CAS; E. Palecek, Electrochemical behaviour of biological macromolecules, Bioelectrochem. Bioenerg., 1986, 15, 275 CrossRef CAS.
- H. S. Wang, H. X. Ju and H. Y. Chen, Anal. Chim. Acta, 2002, 461, 243 CrossRef CAS; P. Cekan and S. T. Sigurdsson, J. Am. Chem. Soc., 2009, 131, 18054 CrossRef PubMed.
- C. C. Carrion, S. Armenta, B. M. Simonet, M. Valcarcel and B. Lendl, Anal. Chem., 2011, 83, 9391 CrossRef PubMed.
- C. W. Klampfl, M. Himmelsbach, W. Buchberger and H. Klein, Anal. Chim. Acta, 2002, 454, 185 CrossRef CAS; W. R. Jin, H. Y. Wei and X. Zhao, Electroanalysis, 1997, 9, 770 CrossRef.
- E. B. Liu and B. C. Xue, J. Pharm. Biomed. Anal., 2006, 41, 649 CrossRef CAS PubMed.
- I. Heisler, J. Keller, R. Tauber, M. Sutherland and H. Fuchs, Anal. Biochem., 2002, 302, 114 CrossRef CAS PubMed.
- M. Ishikawa, Y. Maruyam, J. Y. Ye and M. Futamata, J. Lumin., 2002, 98, 81 CrossRef CAS.
- X. H. Cai, B. Ogorevc and K. Kalcher, Electroanalysis, 1995, 7, 1126 CrossRef CAS; K. J. Ituang, D. J. Niu, J. Y. Sun, C. H. Han, Z. W. Wu, Y. L. Li and X. Q. Xiong, Colloids Surf., B, 2011, 82, 543 CrossRef PubMed; J. M. Zen, M. R. Chang and G. Ilangovan, Analyst, 1999, 124, 679 RSC.
- A. Abbaspour and A. Noori, Analyst, 2008, 133, 1664 RSC.
- T. Yang, Q. Guan, Q. Li, L. Meng, L. Wang, C. Liu and K. Jiao, J. Mater. Chem. B, 2013, 1, 2926 RSC.
- A. Abbaspour, M. A. Mehrgardi and R. Kia, J. Electroanal. Chem., 2004, 568, 261 CrossRef CAS PubMed.
- A. A. Ensafi, M. M. Abarghoui and B. Rezaei, Sens. Actuators, B, 2014, 204, 528 CrossRef CAS PubMed.
- Y.-S. Gao, J.-K. Xu, L.-M. Lu, L.-P. Wu, K.-X. Zhang, T. Nie, X.-F. Zhu and Y. Wu, Biosens. Bioelectron., 2014, 62, 261 CrossRef CAS PubMed.
- A. A. Ensafi, M. J. Asl, B. Rezaei and A. R. Allafchian, Sens. Actuators, B, 2013, 177, 634 CrossRef CAS PubMed.
- K.-J. Huang, L. Wang, H.-B. Wang, T. Gan, Y.-Y. Wu, J. Li and Y.-M. Liu, Talanta, 2013, 114, 43 CrossRef CAS PubMed.
- L. J. Feng, X.-H. Zhang, P. Liu, H.-Y. Xiong and S.-F. Wang, Anal. Biochem., 2011, 419, 71 CrossRef CAS PubMed.
- J. Cui, D. Sun, W. Zhou, H. Liu, P. Hu, N. Ren, H. Qin, Z. Huang, J. Lin and H. Ma, Phys. Chem. Chem. Phys., 2011, 13, 9232 RSC.
- K. J. Huang, D. J. Niu, J. Y. Sun, C. H. Han, Z. W. Wu, Y. L. Li and X. Q. Xiong, Colloids Surf., B, 2011, 82, 543 CrossRef CAS PubMed.
- A. J. Jeevagan and S. A. John, Anal. Biochem., 2012, 424, 21 CrossRef PubMed.
- S. M. Chen, C. H. Wang and K. C. Lin, Int. J. Electrochem. Sci., 2012, 7, 405 CAS.
- Q. Xu, X. Liu, H. Li, L. Yin and X. Hu, Biosens. Bioelectron., 2013, 42, 355 CrossRef PubMed.
- H. Yin, Y. Zhou, Q. Ma, S. Ai, P. Ju, L. Zhu and L. Lu, Process Biochem., 2010, 45, 1707 CrossRef CAS PubMed.
- R. N. Goyal, V. K. Gupta, M. Oyama and N. Bachheti, Talanta, 2007, 71, 1110 CrossRef CAS PubMed.
- X. Xie, K. Zhao, X. Xu, W. Zhao, S. Liu, Z. Zhu, M. Li, Z. Shi and Y. Shao, J. Phys. Chem. C, 2010, 114, 14243 CAS.
- E. Radi, X. M. Berbel, M. C. Puig and J. L. Martyc, Electroanalysis, 2009, 21, 696 CrossRef CAS; L. S. Jiao, L. Niu, J. Shen, T. Y. You, S. J. Dong and A. Ivaska, Electrochem. Commun., 2005, 7, 219 CrossRef PubMed.
- G. T. Hermenson, Bioconjugate Techniques, Academic Press, San Diego, CA, 2nd edn, 2008 CrossRef CAS PubMed; F. Li, Y. Feng, P. Dong and B. Tang, Biosensors Bioelectronics, 2010, 25, 2084 CrossRef CAS PubMed.
- Sk. Jasimuddin, Transition Met. Chem., 2006, 31, 724 CrossRef CAS; Sk. Jasimuddin and C. Sinha, Transition Met. Chem., 2004, 29, 566 CrossRef.
- L. Trnkova, L. Zerzankova, F. Dycka, R. Mikelova and F. Jelen, Sensors, 2008, 8, 429 CrossRef CAS PubMed.
- K. Barman and Sk. Jasimuddin, Indian J. Chem., Sect. A: Inorg., Bio-inorg., Phys., Theor. Anal. Chem., 2013, 52, 217 Search PubMed.
- R. K. Shervedani, F. Yaghoobi, A. H. Mehrjardi and S. M. S. Barzoki, Electrochim. Acta, 2008, 53, 4185 CrossRef CAS PubMed.
- S. Y. M. Shikov, A. V. Vurasko, L. S. Molechmikov, E. G. Kovalyova and A. A. Ffendieu, J. Mol. Catal. A: Chem., 2000, 158, 447 CrossRef.
- Z. Dursun, I. Sahbaz, F. N. Ertas and G. Nisli, Turk. J. Chem., 2003, 27, 513 CAS.
- Z. Zhang, X. Li, C. Wang, C. Zhang, P. Liu, T. Fang, Y. Xiong and W. Xu, Dalton Trans., 2012, 41, 1252 RSC.
- T. Rohani and M. A. Taher, Talanta, 2009, 78, 743 CrossRef CAS PubMed.
- K. Kano, M. Torimura, Y. Esaka and M. Goto, J. Electroanal. Chem., 1994, 372, 137 CrossRef CAS.
- B. J. Sanghavi, S. M. Mobin, P. Mathur, G. K. Lahiri and A. K. Srivastava, Biosens. Bioelectron., 2013, 39, 124 CrossRef CAS PubMed.
- J. F. Smalley, K. Chalfant, S. W. Feldberg, T. M. Nahir and E. F. Bowden, J Phys. Chem. B, 1999, 103, 1676 CrossRef CAS.
- R. K. Shervedani, A. Hatefi-Mehrjardi and M. Khosravi Babadi, Electrochim. Acta, 2007, 52, 7051 CrossRef CAS PubMed and references therein.
- G. G. Hammes, Enzyme catalysis and regulation, Academic, New York, 1982 Search PubMed; T. Palmer, Understanding Enzymes, Ellis. Horwood, Chicester, 2nd edn, 1985 Search PubMed; G. N. Mukherjee and A. Das, Elements of Bioinorganic Chemistry, U. N. Dhur & Sons Pvt. Ltd, Kolkata, 1st edn, 1993 Search PubMed.
- R. K. Shervedani, S. M. S. Barzoki and M. Bagherzadeh, Electroanalysis, 2010, 22, 969 CrossRef CAS.
- S. Campuzano, M. Pedrero, C. Montemayor, E. Fatas and J. M. Pingarron, J. Electroanal. Chem., 2006, 586, 112 CrossRef CAS PubMed.
- Q. Li, C. Batchelor-McAuley and R. G. Compton, J. Phys. Chem. B, 2010, 114, 7423 CrossRef CAS PubMed; L. M. Goncalves, C. Batchelor-McAuley, A. A. Barros and R. G. Compton, J. Phys. Chem. C, 2010, 114, 14213 Search PubMed.
- Y. Wei, Q. A. Huang, M. G. Li, X. J. Huang, B. Fang and L. Wang, Electrochim. Acta, 2011, 56, 8571–8575 CrossRef CAS PubMed.
- P. N. Mashazi, P. Westbroek, K. I. Ozoemena and T. Nyokong, Electrochim. Acta, 2007, 53, 1858 CrossRef CAS PubMed.
- E. Laviron, J. Electroanal. Chem., 1974, 52, 355 CrossRef CAS.
Footnote |
| † Electronic supplementary information (ESI) available: Cyclic voltammogram, differential pulse voltammogram. See DOI: 10.1039/c4ra08568j |
|
| This journal is © The Royal Society of Chemistry 2014 |
Click here to see how this site uses Cookies. View our privacy policy here.