S. G. Falkovicha,
S. V. Larina,
A. V. Lyulinb,
V. E. Yudinac,
J. M. Kennyad and
S. V. Lyulin*ae
aInstitute of Macromolecular Compounds Russian Academy of Sciences, Bolshoy pr., 31, St. Petersburg, 199004, Russian Federation
bDepartment of Applied Physics Technische Universiteit Eindhoven, Eindhoven, Postbus 513 5600 MB, The Netherlands
cSt.Petersburg State Polytechnical University, Polytechnicheskaya str. 29, St. Petersburg, 195251, Russian Federation
dInstitute of Polymer Science and Technology - CSIC, Juan de la Cierva 3, 28006 Madrid, Spain
eDepartment of Physics, St. Petersburg State University, Ul’yanovskaya str. 1, Petrodvorets, St. Petersburg, 198504, Russian Federation. E-mail: s.v.lyulin@gmail.com
First published on 17th September 2014
Experimental results have shown that graphitizated carbon nanofibers initiate crystallization in R-BAPB polyimides twice as fast as single-wall carbon nanotubes (CNT) leading to the hypothesis that nanofiller curvature influences polyimide crystallization. Therefore, atomistic molecular-dynamics simulations have been performed for R-BAPB in the presence of a flat graphene sheet and the results were compared with those obtained in the presence of a small-radius CNT. The polyimide chain segments tend to lie parallel to the nanofiller surface and this tendency is stronger and the segments are closer to the graphene surface than to the CNT one. Moreover, the density of the polyimide in the near-surface layer is higher for composites filled with graphene than with CNT. This confirms the assumption that the nanofiller surface curvature is indeed a factor influencing the polymer patterning structure, and that a smaller curvature (i.e. flat surface) provides an enhanced initiation of polymer ordering.
Yudin et al.17,23–25,29 investigated the crystallization initiation of the semicrystalline thermoplastic polyimide R-BAPB based on dianhydride 1,3-bis-(3′,4-dicarboxyphenoxy)-benzene (dianhydride R) and 4,4′-bis-(4′′-aminophenoxy)-diphenyl (diamine BAPB) in the composites with different nanofillers. In particular, the authors have demonstrated that vapor grown carbon nanofibers (VGCF) are twice as efficient in accelerating the crystalline formation as CNT. One of the parameters which these nanofillers differ is the surface curvature, the CNT diameter was 15–20 nm and the nanofiber diameter was about 150 nm.17 At the same time the surface structures of the VGCF and CNT are not identical because of the non-total graphitization of the fibers. This difference in structure makes it difficult to conclude univalently that the nanofiller surface curvature is the only factor impacting the crystallization rate observed experimentally.17
The present study aims at answering this question, namely, how the nanofiller surface curvature influences polymer crystallization. Therefore, molecular-dynamics (MD) atomistic simulations have been used to study the molecular mechanisms of the crystallization initiation in the presence of nanofillers with extremely different curvatures. The MD does not allow simulating minute-long crystallization processes, but yet enables us to register the atomic-scale polymer ordering near the nanofiller surface.30,31 This was shown for a R-BAPB and CNT composite in our previous study, and may be considered as a pre-crystallization effect.32 In the present paper we consider two types of nanofillers with extreme curvatures: a flat graphene sheet which has been here simulated ab ovo and a high-curvature small radius CNT and a pure polymer melt without any filler which we previously simulated.32 Our study addresses the influence of the filler on the shape and size of the polymer matrix chains, the orientation of the chain segments, as well as investigates the influence of the nanofiller surface curvature on the structuration of the polymer-matrix near-surface layer. Note here that using computer simulations Minoia et al.33 showed recently that an adsorption of a single polyethylene chain on a small-curvature CNT is somewhat more preferable than an adsorption on a high-curvature CNT. From the other point it was shown in both experiments34 and computer simulations30 that CNT initiates more fast crystallization of PLLA34,35 or alkanes30 than graphene does. However, it is not clear whether these findings can be applied to the case of a composite with a large number of polyimide chains, with much more complex structure of a monomer unit than that of polyethylene or PLLA. Few reports have previously addressed the influence of the nanotube curvature on its interaction with the polymer matrix. The specific case of epoxy matrices was studied in computer simulations of the pulling out of a nanotube from epoxy/CNT composites.36,37 It was demonstrated that the surface energy increases with the nanotube diameter but no correlation with the structural characteristics of the epoxy matrix close to the filler surface was suggested.
Therefore we propose here a molecular-dynamics atomistic simulation focused on the structuration of the studied polyimide on the surface of two nanofillers with extremely different curvature radius: graphene and CNT. First, the description of the model and the simulation technique is provided, followed by the presentation of the simulation results and their discussion.
The chemical structure of the repeating unit of R-BAPB polyimide is given in Fig. 1. The graphene structure was generated using buildCstruct 1.1 program.38
Molecular-dynamics simulations have been performed with the Gromacs computational package39,40 and the Gromos53a5 force field.41 This approach was used in our previous studies to investigate the thermophysical properties, such as glass-transition temperature and coefficient of thermal expansion, of polyimides without filler42–46 and filled with CNT.32 The MD simulations allowed understanding the relationship between these properties and the polyimide chemical structure.
The rectangular elementary cell for each of the systems contains 27 polyimide chains with a polymerization degree n = 8. This R-BAPB polymerization degree corresponds to the molecular weight Mn ∼ 6.4 kg mol−1. At this degree of polymerization the transition to the “polymer mode” is observed in the molecular-weight dependence of the glass-transition temperature. As a result, the glass-transition temperature of R-BAPB weakly depends on its molecular weight.42,47
The simulations were carried out in the NPT ensemble. Constant temperature (600 K, that is 5K higher than the experimentally-determined value of the R-BAPB melting temperature) and pressure P = 1 atm were maintained using a Berendsen thermostat and barostat,48,49 with time constants of τT = 0.1 ps and τP = 0.5 ps, respectively. These parameters were used in our previous papers42–46 and allowed us to reproduce successfully thermophysical properties of bulk PIs. All bond lengths were kept constant with the LINCS algorithm50. The mobility of graphene atoms was limited by introducing additional potentials (position restraints) in order to maintain the graphene sheet area, following the approach used by Komarov et al.51 Furthermore, in the graphene composite, the periodic cell compressibility in the plane of the graphene sheet was prohibited and, thus, the constant pressure in the system was maintained only by varying the cell size along the axis perpendicular to the graphene sheet.
The cell size along the Z axis is comparable with the size along the other axes and close to 6.4 nm. This value is approximately two times higher than the polymer chain gyration radius. Also, as it was shown previously for the chosen polymerization degree, the polymer density fluctuations become negligible at a distance higher than 1.5 nm from the carbon nanotube surface32 and the same result will be shown later for the composites with graphene (see Fig. 6 below). Thus, the change of polymer density forced by steric hindrance due to filler presence occurs for distances much lower than the simulation cell size. Thus, we can conclude that the cell size is large enough and the effects observed are due to interaction of the polymer with the nanofiller surface but not due to steric hindrance between parallel flat surfaces.
As shown in our recent studies,42–46 in some cases the atomic partial charges could be taken equal to zero in order to make the long microsecond-scale equilibration possible with the available supercomputer resources. The accounting of the atomic partial charges in computer simulation may, in principle, influence significantly the final results, especially when the compounds contain highly-polarized chemical groups. In the case of small partial charges the influence on the simulated properties is much weaker. For example, the recent computer simulations of polystyrene52–55 and polyethylene56–67 without electrostatic interactions showed an agreement of the simulated polymer local structure, thermophysical and mechanical properties with corresponding experimental data. The quantum-mechanical calculations42 show that the R-BAPB atomic charges are relatively small. Therefore, since accounting of polyimide charges increases the equilibration time by an order of magnitude,16,42 no electrostatic interactions have been taken into account in the present paper. Besides, in our previous study32 it has been shown that the R-BAPB structural properties, the pair distribution functions and the polymer local structure near the CNT surface depend only weakly on the electrostatic interactions.
Fig. 2 shows the time dependences of the chain end-to-end distance 〈h〉 and the radius of gyration 〈Rg〉 averaged over all chains at each 20 ns interval. Two-microsecond long simulations demonstrated that the average chain size first increases and reaches finally a constant equilibrium value. The time for the chain size to reach the equilibrium plateau is about 1–1.5 μs comparable to that obtained for the composite of R-BAPB with CNT in our previous simulation.32 For the chains located close to the graphene surface (up to 1.6 nm that is a quarter of the cell height) we calculated 〈h〉 and 〈Rg〉 to study the influence of the surface on the conformation and dynamics of polymer chains. It can be seen from Fig. 2 that the size of the chains near to the graphene surface fluctuates much stronger in comparison with all other chains, however all the chains achieve the same saturation value. Thus, we can conclude that all polymer chains have a conformation close to equilibrium. Moreover, it should be also pointed out that chains close to the graphene surface have higher values of end-to-end distance 〈h〉 in comparison with all other chains due to their elongated shape.
![]() | ||
| Fig. 2 Time dependence of (a) the average end-to-end distance 〈h〉 and (b) the mean radius of gyration 〈Rg〉, for R-BAPB chains during the equilibration procedure averaged over all PI chains in the system (filled symbols), and over chains located near the graphene surface (hollow squares) and all other chains (hollow circles) at each 20 ns interval. Equilibrium values42 of 〈h〉 and 〈Rg〉 for R-BAPB chains with 8 repeating units are shown with dashed lines. | ||
The chain shape can be described by the ratio of the maximum to the minimum component of the gyration tensor Rg,x, Rg,y and Rg,z (Rg,x > Rg,y > Rg,z), as well as by asphericity b, acylindricity c and the relative shape anisotropy κ2:
| b = Rg,x2 − 1/2(Rg,y2 + Rg,z2), | (1) |
| c = Rg,y2 − Rg,z2, | (2) |
![]() | (3) |
The results obtained in this study for the composite with graphene were compared with those obtained for R-BAPB in composite with CNT and for R-BAPB without filler, see Table 1.
As it is seen in Table 1, the polyimide shape changes depending on the type of the nanofiller added to the polymer melt. The values of the relative shape anisotropy κ2, the ratio Rg,x/Rg,z and the asphericity b of the chains grow when a nanofiller is added. This suggest that the R-BAPB polyimide chains in the composite tend to spread out lengthwise as compared to the pure melt, with graphene having a larger influence on the polyimide matrix than CNT. Notably, the CNT-based and graphene-based composites display nearly equal values of asphericity b. The acylindricity value c is far lower for the CNT-based composites. In other words, the polymer chains in the composite with CNT are extended cylinders, whereas chains in the composite with graphene are more spread out in plane.
It is seen (Fig. 3) that segments of R-BAPB chains tend to be oriented in parallel to graphene surface. To investigate orientation of segments of R-BAPB chains, we have also constructed histograms (Fig. 4b and c) where each point shows the probability of the angle between the flat segment of R-BAPB (marked with an arrow in Fig. 4a) and the CNT axis or graphene plane equals a given value θ at a given distance r from the nanofiller surface; the histograms were normalized by sin
θ in order to account for the difference in space angles corresponding to different values of θ. This analysis was taken over the equilibrium parts of molecular-dynamic trajectories. The averaging of the calculated characteristics was performed within the time interval of 40 ns with instantaneous configurations taken every 20 ps. Therefore, all distributions shown below are obtained by averaging 2000 configurations for each system studied. The bin sizes used were 1 degree for angle θ and 0.1 nm for distance r.
![]() | ||
| Fig. 3 A typical snapshot of the equilibrated system (obtained with use of VMD software68). | ||
![]() | ||
| Fig. 4 (a) The flat segment of the R-BAPB repeat unit used in calculations of the orientation-related parameters marked with an arrow (b) distribution of the angle θ between the vector of the R-BAPB flat segment and the CNT axis as function of a distance r to the CNT axis (recalculated from our previous data32) (c) distribution of the angle θ between the vector of the R-BAPB flat segment and the graphene plane as function of the distance r to the graphene surface. | ||
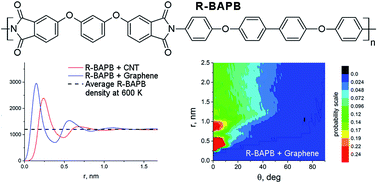
The distribution of the angle θ between the chosen vector and the CNT axis or graphene plane is presented in Fig. 3b and c. It shows that for all distances r a significant part of angles lies within a rather narrow range around θ ∼ 0. This means that in the presence of a nanofiller the flat chain segments are oriented along the nanofiller surface. Such an ordering may precede the crystallization. The maxima of the probability distributions shown in Fig. 4b and c correspond to the first few polymer layers near the nanofiller surface. The individual layers disappear at large distances from the surface, still, the preferential orientation of the flat polyimide fragments along the nanofiller surface remains unchanged.
It is possible to quantitatively compare the ordering degree of the polyimide matrix in the systems with CNT and with graphene using the fraction ϕα of flat segments located at a distance r from the nanofiller surface and at an angle θ with the CNT axis or graphene plane not exceeding a given α value (15°, 30°, 45° and 60° were taken in the present study). We assumed that, when the angle θ does not exceed 45°, the flat segment is oriented preferentially parallel to the nanofiller surface. The dependence of the value ϕα on the distance r is shown in Fig. 5. The distance r = 0 corresponds to the nanofiller surface. The value ϕα increases with α for both types of composites considered. It can be seen from Fig. 5 that the higher ordering in CNT-filled composites is observed in the subsurface polymer matrix layer. At the same time, in the graphene-filled composite a rather strong ordering is observed at higher distances from the graphene surface. This conclusion could be attributed to the presence of a large fraction of fragments oriented parallel to the graphene surface (α < 45°). For all distances, the value of ϕα is higher in the graphene-based composite. This fact confirms that graphene has a larger influence on the ordering of the R-BAPB chains than CNT.
Another feature of the polymer structure near the nanofiller surface is the density distribution ρ(r) of the polymer segments along the normal to the filler surface, Fig. 6. It is seen that the density profiles for the composites with CNT and with graphene have a qualitatively similar shape; they both show two peaks separated by a distance of about 0.5 nm. These peaks can be interpreted as the first and second layers of polyimide atoms. Besides, weaker maxima can be distinguished which correspond to the third and fourth atomic layers. At a distance exceeding 1 nm, the matrix density reaches a constant value equal for both systems that is close to the average density of unfilled R-BAPB at 600 K.42 Near the nanofiller surface a considerable difference is observed for the two composites: the density peaks are higher in the composite with graphene than in that with CNT and the peaks are located closer to the graphene surface than that of the CNT.
Presumably, the flat surface enables the chains to be in a more energetically favorable conformation than near the curved CNT surface. This result is in line with the findings of studies which, using experimental approaches31 and computer simulations33 of simple polyethylene and epoxy/CNT composites.36,37 In both cases it was reported that the filler surface with a comparatively smaller curvature has much larger influence on the structure of the near-surface polymer matrix layer than the surface with a comparatively higher curvature.
For both composites considered, polymer builds up a near-surface layer. The layer is denser and is located at a smaller distance in the composite with graphene than with CNT, which is apparently related to the difference in the nanofiller surface curvature. At large distances the division into layers of segments oriented along the filler surface disappears, yet the high segmental orientation degree remains. Moreover, this degree is higher in the composites with graphene than with CNT.
| This journal is © The Royal Society of Chemistry 2014 |