Processability, structural evolution and properties of melt processed biaxially stretched HDPE/MWCNT nanocomposites

Dong Xiang*a, Eileen Harkin-Jonesa and David Lintonb
aSchool of Mechanical and Aerospace Engineering, Queen's University Belfast, BT9 5AH, UK. E-mail: dxiang01@qub.ac.uk
bSchool of Electronics, Electrical Engineering and Computer Science, Queen's University Belfast, BT9 5BN, UK

Received 16th July 2014 , Accepted 10th September 2014

First published on 10th September 2014


Abstract

Biaxial stretching of melt mixed high density polyethylene (HDPE)/multiwalled carbon nanotube (MWCNT) nanocomposites was conducted in the melt state at different stretching ratios (SRs). The addition of MWCNTs leads to significant strain hardening in the HDPE, greatly improving the stability and thus processability of the stretching process. Scanning electron microscopy shows that the MWCNTs in the polymer matrix are gradually disentangled and randomly oriented in the stretching plane with increasing SRs. All the stretched samples exhibit an increase in crystallinity (about 10%) due to strain induced crystallization and a broadened distribution of crystallite size according to the XRD and DSC results. The mechanical properties of the composites improve with increasing SRs, while they drop off after a SR of 2.5 for the neat HDPE which is likely to be due to the relaxation of polymer chains prior to solidification. The presence of the MWCNTs appears to inhibit this relaxation thus helping to maintain the orientation and mechanical properties at high SRs. The modulus, yield strength and breaking strength of stretched composites with 8 wt% MWCNTs increase by approximately 54%, 85% and 193% respectively compared with the neat HDPE at a SR of 3. The electrical percolation threshold for the unstretched material occurs at 1.9 wt% MWCNTs. As SR increases, the values of critical concentration increase from 1.9 wt% to 4.9 wt% implying the destruction of conductive networks due to an increased inter-particle distance. A loading of 6 wt% MWCNTs is sufficient to ensure that the sheet conductivity is robust to changes in the SR. Decreased values of critical exponent from 1.9 to 1.1 and morphological investigation reveal a transformation of the system structure from three dimensional to two dimensional as SR increases.

1 Introduction

Over the last decade, carbon nanotubes (CNTs), as a potential nanofiller for the reinforcement of polymers, have attracted much attention due to their unique structure and excellent physical and mechanical properties.1–4 The addition of a small amount of CNTs can greatly improve the thermal,5 mechanical6 and electrical7,8 properties of the polymer matrix thanks to their very high aspect ratio. However, CNTs are strongly affected by van der Waals forces, which cause the formation of CNT agglomerates in the polymer matrix resulting in a deterioration of properties as loading CNT level increases.9 This prevents the attainment of very high enhancements in mechanical properties that could be achieved at higher loading levels. Adequate interfacial adhesion between CNTs and the matrix is also necessary in order to achieve good matrix-to-filler stress transfer.10 Good dispersion and strong interfacial adhesion are the two prerequisites to ensure mechanical property enhancement in the manufacture of polymer/CNT composites.11

The processing route to produce a product can have an important influence on the structure and final properties and, changes in material thermal and rheological properties due to the addition of nanoparticles can also significantly alter processability.12,13 Many polymer products are formed by free surface moulding processes such as thermoforming, stretch blow moulding and blown film extrusion. In these processes the deformation is essentially biaxial elongation in a semi-solid or molten state so it is important to assess new materials under this deformation regime prior to industrial deployment.9,14 The effect of uniaxial stretching on the structure and properties of polymer/CNT nanocomposites has been extensively investigated. Higher percolation thresholds due to the increased inter-particle distance9,15,16 and anisotropic electrical,17,18 thermal5 and mechanical5,17,16 properties due to the orientation of CNTs after uniaxial stretching have been reported. In contrast, few investigations on the effect of biaxial stretching on polymer/CNT composites have been carried out, although its influence on neat polymer materials19,20 and polymer/clay composites14,21,22 has been reported in previous studies. In recent reports on biaxial deformation of polymer based CNT composites, Shen9,23 studied the development of conductive CNT networks in a polypropylene (PP) matrix under biaxial stretching. They observed that upon initial stretching the conductivity decreased but as the stretch ratio increased beyond 2.5 the conductivity began to increase again leading them to conclude that a destruction and rebuilding process of the nanotube network occurs during stretching. This rebuilding process of conductive networks was not observed in Mayoral's16 study on the biaxial stretching of a poly(ethylene terephthalate)(PET) based CNT composites. This is likely to be due to the fact that in Mayoral's work the maximum SR was 2.0 which is below what was required in Shen's work for conductivity to increase again. Also, the SR required to achieve a rebuilding of the conductive network is likely to change as the matrix material changes. There has been much debate around the best distribution of CNTs for enhanced conductivity in polymer/CNT composites but work by Huang and Terentjev24 would appear to demonstrate that a composite morphology consisting of phase separated regions of nanotubes clusters with dangling nanotube bridges results in more effective electron transport than an evenly-spread nanotube network. One might expect that as SR increases in the biaxial stretching process that the potential to form clusters would diminish and the opposite behaviour of agglomerate break up and nanotubes orientation would occur with a resulting drop in conductivity. It is not clear therefore why Shen observed a conductivity increase again once a critical SR was attained but it is clear that further work is required in this area to explain this behaviour. This also raises interesting questions for the processing of polymer/CNT composites in terms of how to achieve the desired state of agglomeration required for conductivity enhancement and how we can simultaneously increase mechanical properties such as modulus which depend on disentanglement and alignment of nanotubes.

In this present work, a systematic study of the biaxial deformation of multi-walled carbon nanotube (MWCNT) nanocomposites based on a high density polyethylene (HDPE) in the melt state was conducted. This study adds to the literature in this area in that we are examining another matrix material that is of significant commercial interest and we report mechanical and thermal as well as electrical properties (Shen only reported electrical properties) at stretch rates up to 3.0 and at much higher strain rates (typical of industrial processing) than those used by Shen. We also comment on the processability of the composite materials which is of course critical if such materials are to be taken up commercially.

2 Experimental

2.1 Materials

A high density polyethene (HTA108) with a high intrinsic viscosity (MFI = 0.7 g 10 min−1, suitable for blown film) was purchased from ExxonMobil. The density of the HDPE is 0.961 g cm−3. Multi-walled carbon nanotubes (NC7000) with a purity of 90% were kindly supplied by Nanocyl SA. The nanotubes have an average diameter of 9.5 nm and an average length of 1.5 μm.16,25 The density of the MWCNTs is 1.85 g cm−3.26

2.2 Preparation

The HDPE pellets were ground into powder using a Wedco 12′′ plate grinder. The HDPE powder was mechanically premixed with the MWCNTs using a high speed mixer (PRISM Pilot 3) with MWCNT loadings in the range from 1 to 10 wt%. The blends were then compounded using a Dr Collin twin-screw extruder ZK 25 with a temperature profile of 175, 220, 220, 215, 210, 200 °C from zones 1 to 6. The screw speed was set at 150 rpm. The extruded strand was cooled in a water bath and then pelletized. The extruded pellets were compression moulded (CM) to produce sheets with dimension of 76 mm × 76 mm and 1 mm thickness in a steel mould at 200 °C for 5 min using a Dr Collin P200P platen press machine.

The sheets were biaxially stretched (BS) using the Queen's biaxial stretcher.27 The sheets were clamped by pneumatic grippers and heated rapidly to stretching temperature (131 °C) from room temperature (20 °C) at a heating rate of about 5°C s−1. Then they were held at this temperature for 4 minutes to melt all the crystallites before simultaneously and equi-biaxial stretching. Care was taken to ensure that the polymer crystallites were fully melted before stretching in order to ensure that any changes in rheological behaviour could only be attributed to the incorporated nanoparticles. The temperature of the sheet during biaxial stretching was measured using a high-speed infrared imaging camera using a (Thermacam SC3000). The sample was cooled to room temperature at the end of stretching. The stretching parameters used in this study are summarised as follows: stretching temperature: 131 °C, stretching ratio (SR): 2, 2.5 and 3.0, strain rate: 4 s−1. Each stretching test was repeated twice.

2.3 Characterization

2.3.1 Scanning electron microscope (SEM). The morphology of stretched and unstretched samples was examined using a JEOL 6500F SEM with an operating voltage of 5.0 kV. All samples for SEM analysis were plasma etched for 60 S at an etching power of 100 W using a reactive ion etching system (STS Cluster C005) and then gold sputtered prior to imaging.
2.3.2 X-ray diffraction (XRD). Wide-angle XRD was performed using a PANalytical X'Pert PRO diffractometer. Cu-Kα radiation with a wavelength of 1.54 Å was used. Data was recorded from 1 to 60°.
2.3.3 Differential scanning calorimetry (DSC). Differential scanning calorimetry using a Perkin-Elmer DSC model 6 was used to verify that crystallites would not be present during the biaxial stretching process and to measure the percentage crystallinity, melting and crystallization behaviour of the stretched and unstretched samples under an inert nitrogen atmosphere. In order to reproduce the heating and holding processes for the sheet before stretching, samples with a typical mass of 7–10 mg were heated rapidly in the DSC from room temperature to 131 °C at a heating rate of approximately 5°C s−1, then held for 4 minutes. Subsequently, the samples continued to be heated to 150°C s−1 at a heating rate of 10°C min−1 to examine whether a melting peak would occur. The absence of a melting peak indicates that all the crystallites will have melted by the end of the holding stage. In terms of the measurement of other thermal parameters, the samples were heated from 30 °C to 200 °C at a heating rate of 10°C min−1, held at 200 °C for 3 min, followed by a cooling process from 200 °C to 30 °C at a cooling rate of 10°C min−1. Then the samples were reheated to 200 °C again at 10°C min−1. Three repeated tests were conducted for each sample. The enthalpy of fusion of 100% HDPE crystal (ΔHom) was taken as 293J g−1.28
2.3.4 Resistivity testing. Volume electrical resistivity testing was carried out for the CM and BS samples. For samples with a high resistivity (>108 Ω), testing was performed using a Keithley 6517A electrometer equipped with a Keithley 8009 resistivity test fixture according to ASTM-D257. Disc shaped samples of diameter 70 mm were used in this test. For more conductive samples (≤108 Ω), two-point probe measurements were conducted using a Keithley DMM 2000 multimeter. Silver paste was used to minimise contact resistance effect in the measurements. The length and width of the samples tested was 50 mm and 10 mm respectively. Two specimens for each sample were tested, and the average values were calculated.
2.3.5 Tensile testing. Tensile testing was conducted using an Instron 5564 Universal Tester at room temperature (BS EN ISO 527:1996). Elastic modulus was determined using a clip-on extensometer at a crosshead speed of 5 mm min−1. Strength and elongation values were taken at a crosshead speed of 50 mm min−1. Five samples were tested for each sheet and average values were calculated.

3 Results and discussion

3.1 Biaxial stretching

All the sheets were biaxially stretched in the melt state as confirmed by DSC testing, and the details of which are presented in Section 3.4. Fig. 1a shows the biaxial stress-strain curves for the HDPE and composite sheets stretched to a stretch ratio of 3. It can be observed that initial sheet modulus (ISM) is increased with increasing MWCNT loadings, as shown in Fig. 1b. This increased modulus will help to prevent sheet sagging which can lead to poor material drape over multi-cavity moulds in thermoforming operations. Addition of MWCNTs also significantly increases the yield point. The yield stress of the composites containing 1 wt% and 10 wt% MWCNTs increases by 179% and 273% respectively, which means that the force required to deform the MWCNT filled material will have to be significantly increased. The increase in yield stress for the filled materials can be attributed to restrictions in molecular mobility or greater entanglement of molecules due to the presence of the MWCNTs. There is a very significant development of strain hardening behaviour with the addition of MWCNTs. At the end of stretching (SR = 3), the stretching stress for the composites with 1 wt% and 10 wt% MWCNTs increase by 159% and 665% respectively.
image file: c4ra07166b-f1.tif
Fig. 1 Effect of MWCNTs on the biaxial deformation behaviour of HDPE/MWCNT composites, (a) strain–stress curves, (b) quantitative analysis of enhancement effect.

A strain hardening index (SHI) is proposed in order to quantify the strain hardening effect, which is simply determined by the slope of the strain–stress curve in the strain hardening region. The SHI increases steadily with increasing MWCNT loading, as shown in Fig. 1b. This enhanced strain hardening behaviour is important in ensuring uniform stretching of the sheet which in turn leads to products with good material thickness distribution.

We have measured the temperature change in the sheet as it is stretched to see if there is any adiabatic heating effect that might influence relaxation processes.29 The temperature change in a polymer sheet during deformation is determined by heat transfer from the sheet once the heat source is removed and by internal heat generation. The temperature increase due to internal heat generation is represented by eqn (1) where CPC is the heat capacity of the polymer composite and the effective thermal plastic work conversion factor is βε. The fraction of plastic work converted to heat often exceeds 90% (βε ∼ 1).30,31 CPC is estimated using the mixture rule (eqn (2)).32 WP and Wf are the weight fractions of polymer and filler respectively. CP and Cf are the heat capacities of polymer and filler respectively. In this case, the CP is 2250 J kg−1 K−1,33,34 and the Cf is 600 J kg−1 K−1.32,35

 
image file: c4ra07166b-t1.tif(1)
 
CPC = WPCP + WfCf (2)

Fig. 2 shows the experimental and theoretical temperature variation of the sheet during biaxial deformation. A slight temperature decrease in the samples can be observed in the experimental results up to the yield point. Up to this point the work input is low and heat transfer to the surroundings dominates thus leading to a drop in sheet temperature. As the strain and work input increases the sheet temperature increases and experimental and theoretical results agree reasonably well at nominal strains below 1.5. The increasing deviation between theoretical and experimental results can be attributed to greater heat loss as a result of increasing surface area to volume as the sheet is stretched and thins out. It is clear from the experimental results that the composite materials experience a slightly higher temperature rise than the unfilled material due to the greater plastic work done during biaxial deformation. In general the temperature increase is only a few degrees and unlikely to significantly affect relaxation processes.


image file: c4ra07166b-f2.tif
Fig. 2 Theoretical and experimental temperature variation of samples during biaxial deformation.

3.2 SEM

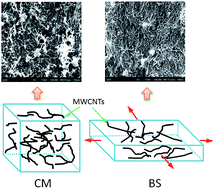
The morphology of CM and BS HDPE/MWCNT composites was examined using SEM after plasma etching the samples, as shown in Fig. 3. Fig. 3a–f show the SEM images of composites containing 4 and 8 wt% MWCNTs with increasing SRs respectively. In Fig. 3a an interlaced network structure consisting of agglomerated and isolated nanotubes can be observed in the CM composite containing 4 wt% MWCNTs. Fewer MWCNT agglomerates are observed after biaxial stretching at a SR of 2 (Fig. 3b), because some individual nanotubes are pulled out of the agglomerates upon stretching. The MWCNTs appear to be randomly oriented in the stretching plane after disentanglement. A further breakup of MWCNT agglomerates can be observed as the SR increases to 3 in Fig. 3c. The MWCNTs are further oriented in the stretching plane and the network structures are partially destroyed. Fig. 3d shows numerous fluffy MWCNT network structures in the polymer matrix as the MWCNT loading increases to 8 wt%. In a manner similar to the morphological evolution of the samples with 4 wt% MWCNTs these 8 wt% MWCNT samples have the nanotubes increasingly oriented in the stretching plane as the SR increases (Fig. 3e–f). Unlike in the 4 wt% samples, the 8 wt% samples still have many MWCNT networks remaining at a SR of 3. The three dimensional MWCNT networks tend to transform to two dimensional network with increasing SR. A schematic diagram for the structural evolution of HDPE/MWCNT composites during biaxial stretching is shown in Fig. 4.
image file: c4ra07166b-f3.tif
Fig. 3 SEM images of HDPE/MWCNT composites containing 4 wt% (a–c) and 8 wt% (d–f) MWCNTs with increasing SRs (SR = 1 means CM).

image file: c4ra07166b-f4.tif
Fig. 4 Schematic diagram for the structural evolution of HDPE/MWCNT composites during biaxial stretching.

3.3 XRD

Fig. 5a and b show the XRD spectra for the stretched HDPE and composites containing 8 wt% MWCNTs at different SRs. The curves are vertically offset for clarity. The reflection peak of MWCNTs at 25.6°,36 which is derived from the ordered arrangement of the concentric cylinders of graphitic carbon, is absent from the spectra of the HDPE/MWCNT composites. This can be attributed to an efficient melt mixing resulting in destruction of the short-range ordered concentric geometry of the MWCNTs, or the relatively weak intensity compared to that of HDPE is undetectable.16,37 The HDPE mainly exhibits two intensive reflection peaks at 21.6° and 24.0° corresponding to the typical orthorhombic unit cell structure in (110) and (200) respectively, and two weak peaks at 30.1° and 36.3° corresponding to reflection planes (210) and (020) respectively.38
image file: c4ra07166b-f5.tif
Fig. 5 XRD spectra (a and b), crystallite sizes (c) crystallinities (d) and of HDPE and HDPE/MWCNT composite sheets with increasing SRs, (in the legend, CNT8-2.0 represents 8 wt% MWCNTs and SR = 2).

It can be observed that the crystallite structures are not affected by the addition of MWCNTs. However, the two intensive reflection peaks become less intensive after biaxial deformation in Fig. 5a and b due to the interference of numerous imperfect crystallites, especially for the samples with 8 wt% MWCNTs as a result of the restriction effect of MWCNT network on the mobility of polymer chains.39 The two weak peaks are almost undetectable for both filled and unfilled HDPE after biaxial stretching. Fig. 5c shows the average crystallite sizes in (110) from the Scherrer Equation40 for the stretched HDPE and composites at increasing SRs. The results show an increasing trend in the average crystallite sizes for all the strectched materials with increasing SR, but the composites with more MWCNTs have a lesser increase. The presence of imperfect crystallites and the increase in average crystallite size implies a broadened size distribution of crystallites in the BS samples. This is also supported by the DSC results.

The crystallinity (XXRDc) of all the BS samples increases by about 8% due to strain induced crystallization as shown in Fig. 5d. The lower crystallinities of composites with 8 wt% MWCNTs compared to other samples at all the SRs indicate that the addition of abundant MWCNTs has an inhibitive effect on the growth of crystallites. The results of crystallinity from XRD agree well with those from the DSC tests.

3.4 DSC

First of all, DSC was used to simulate the pre-heating stage for the sheet to determine if any residual crystallinity remained before stretching commenced. We wished to eliminate crystallites so that any strain hardening in the composites could only be attributed to the presence of the MWCNTs. It can be seen in Fig. 6 that there are no melting peaks present for the material indicating no residual crystals remain in the material after a pre-heating stage at 131 °C for 4 minutes. An evident melting peak is shown if the pre-heating is done at 128 °C hence the choice of 131 °C for our experimental work to ensure a complete melt state before stretching.
image file: c4ra07166b-f6.tif
Fig. 6 Verification of the melt state of sheets during biaxial stretching.

The melting and crystallization behaviours of CM and BS samples were investigated by DSC. The crystallinities from DSC tests (XDSCc) are calculated according to the fusion enthalpies during the first and second melting stages. Some additional structural information can be revealed from the thermal behaviour of the deformed samples in the heating and crystallization stages, particularly the first heating stages. The first heating and cooling curves for the stretched and unstretched samples are shown in Fig. 7, and the relevant thermal parameters are listed in Table 1. A shoulder on the low temperature side of the melting peak for the stretched samples can be observed in Fig. 7a–c. This phenomenon can be explained by the less perfect crystallites with a smaller size (as presented in XRD) melting at lower temperatures.16,23 On the other hand, a slight increase (about 1 °C) in melting temperature (T1stm) can be found in the first heating stage as a result of the thickening of lamella generated by the oriented polymer chains.5,9 The increased width at half height (W1sth) in the first heating curves of stretched samples indicates the wider distribution of crystallite sizes.41 The crystallinity (X1stc) of BS neat HDPE and HDPE/MWCNT composite with 4 wt% MWCNTs obtained from the first heating process increases by about 10–15% as a result of strain induced crystallization, while the X1stc of BS composites with 8 wt% MWCNTs increases to a lesser degree (by about 10%) due to the confinement effect of high MWCNT loading on the growth of crystallites. Overall, the results of X1stc from DSC agree well with the XXRDc from XRD. The slightly higher X1stc compared with XXRDc may be due to the recrystallization of some imperfect crystallites during the DSC heating process.


image file: c4ra07166b-f7.tif
Fig. 7 DSC thermograms of HDPE and HDPE/MWCNT samples with different SRs at the 1st heating (a–c) and cooling (d) stages, (a): HDPE, 1st heating, (b): 4 wt% MWCNTs, 1st heating, (c): 8 wt% MWCNTs, 1st heating, (d): HDPE, 4 and 8 wt% MWCNTs, cooling.
Table 1 Thermal parameters of the CM and BS samples obtained from DSC tests
Sample code X1stc (%) X2ndc (%) T1stm (°C) W1sth (°C) Tc (°C)
HDPE-CM 72.8 ± 3.1 70.4 ± 1.3 133.9 ± 0.2 7.4 ± 0.1 114.0 ± 0.2
CNT4-CM 73.9 ± 5.1 70.7 ± 2.4 134.0 ± 0.1 7.7 ± 0.3 116.0 ± 0.2
CNT8-CM 70.9 ± 3.5 72.6 ± 1.9 133.6 ± 0.3 7.1 ± 0.3 116.2 ± 0.4
HDPE-2.0 86.6 ± 0.6 77.8 ± 2.1 136.4 ± 0.3 7.6 ± 0.2 113.1 ± 0.3
CNT4-2.0 84.4 ± 5.0 79.6 ± 1.8 135.9 ± 0.4 8.0 ± 0.1 115.7 ± 0.4
CNT8-2.0 78.0 ± 1.3 76.6 ± 1.3 134.7 ± 0.5 5.5 ± 0.7 116.5 ± 0.3
HDPE-2.5 86.0 ± 2.9 76.5 ± 2.3 135.7 ± 0.4 8.2 ± 0.4 113.7 ± 0.4
CNT4-2.5 86.1 ± 2.1 78.5 ± 1.1 136.1 ± 0.7 8.1 ± 0.1 115.7 ± 0.5
CNT8-2.5 80.7 ± 3.4 77.3 ± 2.1 135.1 ± 0.3 8.9 ± 0.4 115.8 ± 0.3
HDPE-3.0 85.7 ± 2.9 76.3 ± 1.4 135.2 ± 0.2 9.2 ± 0.2 113.6 ± 0.3
CNT4-3.0 85.5 ± 3.0 78.2 ± 6.1 135.4 ± 0.2 9.0 ± 0.4 115.9 ± 0.4
CNT8-3.0 81.5 ± 3.6 77.5 ± 6.7 134.8 ± 0.2 9.7 ± 0.5 115.9 ± 0.1


Compared to neat HDPE, the crystallization temperatures (Tc) of HDPE/MWCNT composites, regardless of being stretched or untretched, increases by around 2 °C (Fig. 7d and Table 1), due to the heterogeneous nucleation effect of MWCNTs.37 In processing this will allow demoulding of parts at a slightly higher temperature and thus reduce cooling time. Fig. 7d shows some typical cooling curves of stretched and unstretched samples. It can be observed that the crystallization behaviour is not significantly influenced by biaxial stretching, while the crystallization peaks of BS samples are slightly broadened. The broadened crystallization peaks, corresponding to the increased exothermal enthalpy, indicate that the biaxially stretched samples with disentangled and aligned polymer chains have a stronger capability to crystalize. This can also explain the increased crystallinity (X2ndc) in the second heating stage.

3.5 Resistivity testing

According to the classical percolation threshold theory, conductive fillers can form conductive networks in an isolating polymer matrix resulting in a great decrease in electrical resistivity when the loading of conductive fillers reaches a critical concentration.42,43 However, irrespective of whether a percolation threshold is achieved during the preparation of the initial compounded composite, the final electrical properties of a polymer/CNT will be determined by secondary processing.16 Therefore, the variations in the volume resistivity of biaxially stretched HDPE/MWCNT composites with different MWCNT loadings as a function of SRs are also investigated in this study, as shown in Fig. 8a. Also, the shifts in percolation threshold of the stretched HDPE/MWCNT composites at different SRs are plotted in Fig. 8b.
image file: c4ra07166b-f8.tif
Fig. 8 Variations in the volume resistivity of biaxially stretched HDPE/MWCNT composites as a function of SRs (a) and MWCNT loadings (b).

It can be seen from Fig. 8a that the resistivity of pure HDPE is slightly decreased by the addition of 1 wt% MWCNT and that the resistivity of the unfilled and the 1 wt% MWCNT composite is barely influenced by biaxial stretching. There is a large drop in resistivity for the unstretched composite with a 2 wt% MWCNT loading because this MWCNT loading is above the critical percolation concentration. However, once the sheet is stretched the percolated network is gradually destroyed and the resistivity starts to increase, levelling off as the SR exceeds 2.0. Presumably at this SR the distance between the nanotubes exceeds the critical maximum distance (about 1.8 nm (ref. 44)) for electron hopping (CM). For the composite with 4 wt% MWCNTs, the resistivity does not increase significantly until a SR of 2.5 is exceeded when it increases rapidly by about 6 orders of magnitude when the SR increases to 3. There are no obvious variations in the resistivity of composite containing MWCNT loadings higher than 6 wt% after biaxial stretching at increasing SRs. One might assume that at these loadings there is a sufficient density of nanotubes to maintain a critical distance between nanotubes regardless of the strain thus forming a robust conductive network in the matrix. On the other hand, the work of Huang and Terentjev24 might indicate that it is the presence of clusters of CNTs with dangling nanotube bridges that is required for good conductivity. One might expect that agglomerates or clusters are more numerous in more highly loaded composites (as is indeed the case here shown in Fig. 3d–f) as long as this structure remains relatively undisturbed by the stretching process (i.e. clusters remain intact but dangling nanotubes may be stretched/oriented) then conductivity will not diminish.

Regardless of the mechanism or structure required the results obtained here are important as they identify the critical loading required to ensure that a conductive network is maintained in the final formed part after stretching.

The electrical resistivity of stretched and unstretched samples was fitted according to the scaling law of percolation threshold, which can be expressed by eqn (3).

 
P ∝ (t)t (3)
where ρ is the volume resistivity of the composite, is the filler weight fraction, t is the critical concentration, and t is the critical exponent. The critical exponent reflects the system dimensionality of conductive composites, which is approximately 1.6–2 in a three dimensional system and 1–1.3 in a two dimensional system.45 The values of t and t from fitting are shown in Table 2. The CM composites (SR = 1) exhibit a low critical concentration of 1.9 wt% MWCNTs and a typical three dimensional system (t = 1.9). However, the gradually increased values of t imply the destruction of conductive networks with increasing SRs, and the decreased values of t reveals a transformation of system structure from three dimensional to two dimensional.

Table 2 The critical concentration t and critical exponent t of BS HDPE/MWCNT composites at different SRs
SR 1 2 2.5 3
t 1.9 3.8 3.8 4.9
t 1.9 1.6 1.5 1.1


3.6 Tensile testing

The mechanical properties of the CM and BS sheets are investigated by tensile testing, as shown in Fig. 9 and Table 3. The Young's modulus (E) of the CM composites with 4 and 8 wt% MWCNTs increases by 112% and 163% respectively compared with that of pure HDPE, and the stress at yield (σy) increases by 14% and 22% respectively. However, with the addition of nanotubes, the stress at break (σb) and strain at break (εb) of the CM composite sheets decreases significantly by about 40% and 95% respectively due to the presence of CNT agglomerates.1 It can be seen from Fig. 9a–c that the experimental values of E, σy and σb of stretched HDPE/MWCNT composites increase steadily with increasing SRs due to a combination of MWCNT agglomerate disentanglement, polymer molecular orientation and MWCNT orientation. E, σy and σb also increase for the pure HDPE sheets up to a SR of 2.5 after which they drop off. This drop is likely to be due to the relaxation of polymer chains prior to solidification which is not observed in the materials containing MWCNTs due to restricted molecular mobility imposed by the oriented nanotubes. The slight temperature increase caused by adiabatic heating is unlikely to significantly affect the relaxation process. The εb of BS composites increases by about 100% (Fig. 9d), which is mainly attributed to the breakup of MWCNT agglomerates and removal of stress concentrator. However, it decreases by about 90% for the stretched HDPE at a SR of 2.5 due to the orientation of polymer chains and reduced potential for further stretching. The increase in the εb of stretched HDPE at a SR of 3 can be attributed to the relaxation of polymer chains. Overall, a higher SR has a very positive influence on the mechanical properties of the HDPE/MWCNT composites. By way of example, for the stretched composite with 8 wt% MWCNTs at a SR of 3, the E, σy and σb increase by about 54%, 85% and 193% respectively compared with the unfilled HDPE at the same SR (Table 3). Therefore, the disentanglement and orientation of MWCNTs, rather than the orientation of polymer chains, dominate the changes in the mechanical properties of stretched HDPE/MWCNT composites.
image file: c4ra07166b-f9.tif
Fig. 9 Effect of biaxial stretching on Young's modulus (a), stress at yield (b), stress at break (c), and strain at break (d) with increasing SRs.
Table 3 Changes in the experimental values of tensile properties of CM and BS samples with the addition of MWCNTsa
Sample ΔE (%) Δσy (%) Δσb (%) Δεb (%)
a ΔE, Δσy, Δσb and Δεb are the changes in Young's modulus, stress at yield, stress at break and strain at break according to the experimental tests, respectively.
CNT4-CM +111.6 +13.6 −40.5 −94.8
CNT8-CM +163.4 +21.7 −34.6 −97.7
CNT4-2.0 +15.4 +16.6 −3.4 −52.6
CNT8-2.0 +32.1 +20.6 +19.3 −74.4
CNT4-2.5 +17.6 +9.6 −33.2 −27.0
CNT8-2.5 +31.1 +20.6 −7.3 −57.7
CNT4-3.0 +40.0 +26.5 +75.5 −71.6
CNT8-3.0 +53.8 +85.4 +192.7 −81.8


It is useful to compare the experimental modulus with predicted values using a conventional composite model, e.g. Halpin–Tsai model, to assess the effectiveness of the reinforcement. According to the Halpin–Tsai theory,1,46–48 the longitudinal (E11) and transverse (E22) modulus can be calculated using eqn (4). For randomly aligned composites, the Halpin–Tsai theory can be expressed as eqn (5):

 
E/Em = (1 + ζη∅f)/(1 − η∅f) (4)
 
Er/Em = 3/8[(1 + ζηLf)/(1 − ηLf)] + 5/8[(1 + 2ηTf)/(1 − ηTf)] (5)
where η = (Ef/Em − 1)/(Ef/Em + ζ), ηL = (Ef/Em − 1)/(Ef/Em + ζ), and ηT = (Ef/Em − 1)/(Ef/Em + 2). E, Em and Ef are the elastic modulus of the composites, matrix and filler, respectively. f is the volume fraction of filler. The shape parameter, ζ, is 2(l/d) for E11 in the longitudinal direction and 2 for E22 in the perpendicular direction, where l/d is the aspect ratio of the filler. In this work, the approximate aspect ratio of the MWCNTs is 150, and the Ef is set as 200 GPa.26,49 The predicted modulus for the CM and BS composites are obtained from eqn (5) and (4) respectively, as shown in Fig. 9a.

It can be seen from Fig. 9a that the predicted modulus of CM composites assuming a randomly aligned Halpin–Tsai model are in good agreement with the experimental values, especially for the composite with a MWCNT loading of 4 wt%. However, the predicted modulus values in the longitudinal direction (E11) using a fully aligned Halpin–Tsai model are much higher than the experimental values. On the contrary, the experimental modulus appear to closer the values of E22. It can be attributed to the orientation of MWCNTs in the BS composites is not ideally parallel with the longitudinal direction. In addition, the aggregated MWCNTs are not possible to be disentangled completely during biaxial stretching, resulting in an insufficient reinforcement.

4 Conclusions

In this study, high density polyethylene (HDPE)/multiwalled carbon nanotube (MWCNT) nanocomposites with MWCNT loadings from 1.0 to 10.0 wt% were prepared by melt extrusion followed by compression moulding to produce sheets. Then, biaxial stretching of the sheets in the melt state was investigated at different stretching ratios. A significant improvement in modulus and strain hardening behaviour can be seen with the addition of MWCNTs during the biaxial deformation of HDPE/MWCNT composites. This will lead to an increased energy requirement in forming but it will also result in a more stable process and the ability to produce parts or films with better thickness uniformity. A slight adiabatic heating effect during the biaxial deformation at a high strain rate is observed for all the samples in both theoretical calculation and experimental testing. The SEM results show that the MWCNTs in the polymer matrix are gradually disentangled and randomly oriented in the stretching plane as the SR increases. The stretched HDPE and HDPE/MWCNT composite exhibit a marked increase in crystallinity (about 10%) due to strain induced crystallization and a broadened distribution of crystallite size, according to the XRD and DSC results. However, the composite with 8 wt% MWCNTs has a slightly lower increase in crystallinity and crystallite size after deformation probably due to the inhibition effect of large number of MWCNTs on the growth of crystallites. The compression moulded HDPE/MWCNT composites exhibit a low electrical percolation threshold of 1.9 wt% and a typical three dimensional system in this study. The high resistivity of composite containing 1 wt% MWCNTs is not influenced by biaxial stretching. The relatively low resistivity of composite with MWCNT loadings of 2 and 4 wt% increases by 9 and 3 orders of magnitude respectively at a SR of 2 due to the increased distance between nanotubes for electron hopping. This increase is not observed for the composite with MWCNT loadings higher than 6 wt% at any SRs indicating that more robust conductive networks have been formed. The increased values of critical concentration from 1.9 wt% to 4.9 wt% with increasing SRs imply the destruction of conductive networks, and the decreased values of critical exponent from 1.9 to 1.1 reveal a transformation of system structure from three dimensional to two dimensional. The mechanical properties of composites are improved with increasing SRs up to a value of 3.0 due to the disentanglement and orientation of MWCNTs, while they then drop off for the unfilled HDPE after a SR of 2.5. This indicates that the MWCNTs are restricting the relaxation of polymer chains at high SRs. This study shows the addition of MWCNTs can not only improve the mechanical and electrical properties of compression moulded samples significantly, but also the processability and the capability to retain these excellent properties after biaxial stretching at higher MWCNT loadings.

Acknowledgements

The authors would like to thank the China Scholarship Council (CSC) and Queen's University Belfast (QUB) Overseas Scholarship for the financial support provided and Dr Paul Baine for his help in plasma etching.

Notes and references

  1. M. Pöllönen, S. Pirinen, M. Suvanto and T. T. Pakkanen, Compos. Sci. Technol., 2011, 71, 1353 CrossRef PubMed .
  2. S. U. Khan, J. R. Pothnis and J.-K. Kim, Composites, Part A, 2013, 49, 26 CrossRef CAS PubMed .
  3. P. Verge, S. Benali, L. Bonnaud, A. Minoia, M. Mainil, R. Lazzaroni and P. Dubois, Eur. Polym. J., 2012, 48, 677 CrossRef CAS PubMed .
  4. A. Ameli, M. Nofar, C. Park, P. Pötschke and G. Rizvi, Carbon, 2014, 71, 206 CrossRef CAS PubMed .
  5. X. Zhao and L. Ye, Compos. Sci. Technol., 2011, 71, 1367 CrossRef CAS PubMed .
  6. M. El Achaby and A. Qaiss, Mater. Des., 2012, 44, 81 CrossRef PubMed .
  7. J. Sandler, J. Kirk, I. Kinloch, M. Shaffer and A. Windle, Polymer, 2003, 44, 5893–5899 CrossRef CAS .
  8. G. Fei, C. Tuinea-Bobe, D. Li, G. Li, B. Whiteside, P. Coates and H. Xia, RSC Adv., 2013, 3, 24132 RSC .
  9. J. Shen, M. F. Champagne, R. Gendron and S. Guo, Eur. Polym. J., 2012, 48, 930 CrossRef CAS PubMed .
  10. H. D. Wagner and R. A. Vaia, Mater. Today, 2004, 7, 38 CrossRef CAS .
  11. G. L. Hwang, Y.-T. Shieh and K. C. Hwang, Adv. Funct. Mater., 2004, 14, 487 CrossRef CAS .
  12. K. H. Soon, E. Harkin-Jones, R. S. Rajeev, G. Menary, T. McNally, P. J. Martin and C. Armstrong, Polym. Int., 2009, 58, 1134 CrossRef CAS .
  13. R. Abu-Zurayk and E. Harkin-Jones, Polym. Eng. Sci., 2012, 52, 2360 CAS .
  14. Y. Shen, E. Harkin-Jones, P. Hornsby, T. McNally and R. Abu-Zurayk, Compos. Sci. Technol., 2011, 71, 758 CrossRef CAS PubMed .
  15. M. Park, H. Kim and J. P. Youngblood, Nanotechnology, 2008, 19, 055705 CrossRef PubMed .
  16. B. Mayoral, P. R. Hornsby, T. McNally, T. L. Schiller, K. Jack and D. J. Martin, RSC Adv., 2013, 3, 5162 RSC .
  17. Q. Wang, J. Dai, W. Li, Z. Wei and J. Jiang, Compos. Sci. Technol., 2008, 68, 1644 CrossRef CAS PubMed .
  18. F. Du, J. E. Fischer and K. I. Winey, Phys. Rev. B: Condens. Matter Mater. Phys., 2005, 72, 121404 CrossRef .
  19. Y. Lin, P. Dias, H. Chen, A. Hiltner and E. Baer, Polymer, 2008, 49, 2578 CrossRef CAS PubMed .
  20. X. Ou and M. Cakmak, Polymer, 2008, 49, 5344 CrossRef CAS PubMed .
  21. R. Abu-Zurayk, E. Harkin-Jones, T. McNally, G. Menary, P. Martin and C. Armstrong, Compos. Sci. Technol., 2009, 69, 1644 CrossRef CAS PubMed .
  22. R. Abu-Zurayk, E. Harkin-Jones, T. McNally, G. Menary, P. Martin, C. Armstrong and M. McAfee, Compos. Sci. Technol., 2010, 70, 1353 CrossRef CAS PubMed .
  23. J. Shen, M. F. Champagne, Z. Yang, Q. Yu, R. Gendron and S. Guo, Composites, Part A, 2012, 43, 1448 CrossRef CAS PubMed .
  24. Y. Y. Huang and E. M. Terentjev, Polymers, 2012, 4, 275 CrossRef PubMed .
  25. T. Villmow, P. Pötschke, S. Pegel, L. Häussler and B. Kretzschmar, Polymer, 2008, 49, 3500 CrossRef CAS PubMed .
  26. M. Morcom, K. Atkinson and G. P. Simon, Polymer, 2010, 51, 3540 CrossRef CAS PubMed .
  27. P. Martin, C. Tan, K. Tshai, R. McCool, G. Menary, C. Armstrong and E. Harkin-Jones, Plast., Rubber Compos., 2005, 34, 276 CrossRef CAS PubMed .
  28. B. Wunderlich, Macromolecular physics, volume 3—crystal melting, New york, Academic Press, 1980 Search PubMed .
  29. J. Furmanski, C. M. Cady and E. N. Brown, Polymer, 2013, 54, 381 CrossRef CAS PubMed .
  30. S. Hillmansen and R. Haward, Polymer, 2001, 42, 9301 CrossRef CAS .
  31. S. Hillmansen, S. Hobeika, R. Haward and P. Leevers, Polym. Eng. Sci., 2000, 40, 481 CAS .
  32. B. Tonpheng, J. Yu and O. Andersson, Macromolecules, 2009, 42, 9295 CrossRef CAS .
  33. M. Woo, P. Wong, Y. Tang, V. Triacca, P. Gloor, A. Hrymak and A. Hamielec, Polym. Eng. Sci., 1995, 35, 151 CAS .
  34. I. Krupa, V. Cecen, A. Boudenne, J. Prokes and I. Novak, Mater. Des., 2013, 51, 620 CrossRef CAS PubMed .
  35. J. Hone, B. Batlogg, Z. Benes, A. Johnson and J. Fischer, Science, 2000, 289, 1730 CrossRef CAS .
  36. O. Zhou, R. M. Fleming, D. W. Murphy, C. H. Chen, R. C. Haddon, A. P. Ramirez and S. H. Glarum, Science, 1994, 263, 1744 CAS .
  37. T. McNally, P. Potschke, P. Hally, M. Murphy, D. Martin, S. E. J. Bell, G. P. Brennan, D. Bein, P. Lemoine and J. P. Quinn, Polymer, 2005, 46, 8222 CrossRef CAS PubMed .
  38. A. Linares, J. C. Canalda, M. E. Cagiao, M. C. Garcia-Gutierrez, A. Nogales, I. Martin-Gullom, J. Vera and T. A. Ezquerra, Macromolecules, 2008, 41, 7090 CrossRef CAS .
  39. D. Xu and Z. Wang, Polymer, 2008, 49, 330 CrossRef CAS PubMed .
  40. W. Luo, N. Zhou, Z. Zhang and H. Wu, Polym. Test., 2006, 25, 124 CrossRef CAS PubMed .
  41. J. Yang, K. Wang, H. Deng, F. Chen and Q. Fu, Polymer, 2010, 51, 774 CrossRef CAS PubMed .
  42. D. Stauffer and A. Aharony, Introduction to percolation theory, CRC press, 1994 Search PubMed .
  43. F. Liu, X. Zhang, W. Li, J. Cheng, X. Tao, Y. Li and L. Sheng, Composites, Part A, 2009, 40, 1717 CrossRef PubMed .
  44. C. Li, E. T. Thostenson and T. W. Chou, Appl. Phys. Lett., 2007, 91, 223114 CrossRef PubMed .
  45. J. Du, L. Zhao, Y. Zeng, L. Zhang, F. Li, P. Liu and C. Chang, Carbon, 2011, 49, 1094 CrossRef CAS PubMed .
  46. J. N. Coleman, U. Khan, W. J. Blau and Y. K. Gun’ko, Carbon, 2006, 44, 1624 CrossRef CAS PubMed .
  47. J. Affdl and J. Kardos, Polym. Eng. Sci., 1976, 16, 344 Search PubMed .
  48. T. McNally, P. Boyd, C. McClory, D. Bien, I. Moore and B. Millar, J. Appl. Polym. Sci., 2008, 107, 2015 CrossRef CAS .
  49. Z. Jiang, P. Hornsby, R. McCool and A. Murphy, J. Appl. Polym. Sci., 2011, 123, 2676 CrossRef .

This journal is © The Royal Society of Chemistry 2014
Click here to see how this site uses Cookies. View our privacy policy here.