
 Open Access Article
 This Open Access Article is licensed under a
 Creative Commons Attribution 3.0 Unported Licence
Preparation of composite electrodes with carbon nanotubes for lithium-ion batteries by low-energy ball milling
T. Taoa,
M. M. Rahmana,
T. Ramireddya,
J. Sunarsob,
Y. Chena and
A. M. Glushenkov*ac
aInstitute for Frontier Materials, GTP, Deakin University, Geelong Waurn Ponds Campus, Locked Bag 20000, Geelong, VIC 3220, Australia. E-mail: alexey.glushenkov@deakin.edu.au
bDepartment of Chemistry, University of Waterloo, 200 University Avenue West, Waterloo, ON N2L 3G1, Canada
cMelbourne Centre for Nanofabrication, 151 Wellington Rd, Clayton, VIC 3168, Australia
First published on 7th August 2014
Abstract
Some of the prospective electrode materials for lithium-ion batteries are known to have electronic transport limitations preventing them from being used in the electrodes directly. In many cases, however, these materials may become practical if they are applied in the form of nanocomposites with a carbon component, e.g. via incorporating nanoparticles of the phase of interest into a conducting network of carbon nanotubes. A simple way to prepare oxide–carbon nanotube composites suitable for the electrodes of lithium-ion batteries is presented in this paper. The method is based on low-energy ball milling. An electrochemically active but insulating phase of LiFeTiO4 is used as a test material. It is demonstrated that the LiFeTiO4–carbon nanotube composite is not only capable of having significantly higher capacity (∼105–120 mA h g−1 vs. the capacity of ∼65–70 mA h g−1 for the LiFeTiO4 nanoparticles) at a slow current rate but may also operate at reasonably high current rates.
1. Introduction
Commercial Li-ion batteries traditionally use LiCoO2 as the cathode and graphite as the anode.1 It is beneficial to replace these conventional materials with superior electrode materials in order to improve energy and power densities of the batteries as well as to increase the safety of lithium-ion devices.2,3 However, in many cases the prospective electrode materials have some transport limitations such as limited electronic and/or ionic conductivity. A well-known example is a cathode material LiFePO4,4,5 which has faced some practical issues initially but is already commercialised. The transport limitations in this material can be neutralised via using this phase in the nanostructured form (to facilitate the ionic transport) and employing continuous carbon coating to provide the efficient supply of electrons.6,7 Similar approach works with other insulating phases and this area of research has been summarised in detail by Li and Zhou.8An alternative way to overcome the issue of limited electronic conductivity in the electrode materials is to use networks of carbon nanotubes that can be mixed with the active material to form nanocomposites.9–11 This is particularly beneficial for situations where improvements in rate capability are required.10,11 The nanotubes act as conducting cables to provide electron transport from current collectors through the bulk of the electrode in an efficient manner. There are a few reported techniques to incorporate networks of nanotubes into the electrodes of Li-ion batteries. For example, hydrothermal method,12,13 vacuum filtration method14 and deposition in anodised alumina templates15 have been employed. Some authors have also attempted to grow active electrode materials directly on carbon nanotubes.16
In this paper, a simple method for the preparation of oxide–carbon nanotube composite electrodes is presented. The method is based on a low-energy ball milling treatment. LiFeTiO4 is used as a test electrode material. This phase exhibits reversible electrochemical reactivity with lithium17–20 but is known to have an insulating nature.18 A theoretical capacity of 153.5 mA h g−1 has been suggested.18 It can normally display only limited capacity even when used in the form of nanoparticles. We demonstrate that significant improvement is achieved when the composite of LiFeTiO4 and MWCNTs is prepared by the suggested method and used as an electrode material. Considerably higher capacity is displayed by the composite electrode (∼105–120 mA h g−1 instead of ∼65–70 mA h g−1 for the LiFeTiO4 nanoparticles), and the electrode is capable of operating under relatively fast charge–discharge rates (currents of up to 500 mA g−1 were evaluated). The results indicate that the proposed method for preparing composite electrodes can indeed significantly improve the characteristics of the model electrode based on an insulating phase.
2. Experimental
2.1. Materials and synthesis
LiOH·H2O (>98%, Sigma-Aldrich, 402974) and ilmenite powder (FeTiO3, 99% purity; Consolidated Rutile Ltd., Australia) were used as starting materials for the preparation of LiFeTiO4 nanoparticles. The nanoparticles were produced by a two-step procedure involving ball milling treatment and subsequent heating. 10 grams of a mixture of FeTiO3 and LiOH·H2O powders in a molar ratio of 1![[thin space (1/6-em)]](https://www.rsc.org/images/entities/char_2009.gif) :1 were loaded inside a stainless steel milling container together with four hardened steel balls (diameter of 25.4 mm). The mixture was milled in a magneto-ball mill (described in detail elsewhere ref. 21) at a rotation speed of 160 rpm for 150 h at room temperature under Ar atmosphere of 100 kPa. The magnet was kept in a 45° position in order to cause the balls to provide strong impacts inside the mill. In the following heating process 1 g of the milled mixture of FeTiO3 and LiOH·H2O was loaded into an alumina combustion boat and the boat was placed into the centre of a horizontal tube furnace. The temperature in the furnace was raised from room temperature to 400 °C within about 30 min and kept at that level for 12 h. At the end of the heating procedure, the furnace was allowed to cool down to room temperature in argon gas flow. Argon gas flow (50 ml min−1) was maintained through the furnace tube for the duration of the whole procedure. Commercially available multi-walled carbon nanotubes (MWCNTs) (>95%, Sigma-Aldrich, 724769) were used to prepare LiFeTiO4–carbon nanotube nanocomposites. 1 g of a mixture of the obtained LiFeTiO4 powder and MWCNTs with a weight ratio of LiFeTiO4 to MWCNTs of 4:1 was dispersed in 10 mL of ethanol, sonicated for 0.5 h and dried at room temperature. The dried sample was ball milled in the same magneto-ball mill for 12 h at room temperature under Ar atmosphere (100 kPa). Rotation speed of 75 rpm was used and an external magnet removed in this preparation routine. Such a milling mode provides low-energy conditions suitable for preventing dramatic modification or damaging of ingredients during milling. A similar procedure of low-energy ball milling was described in detail elsewhere ref. 22.
:1 were loaded inside a stainless steel milling container together with four hardened steel balls (diameter of 25.4 mm). The mixture was milled in a magneto-ball mill (described in detail elsewhere ref. 21) at a rotation speed of 160 rpm for 150 h at room temperature under Ar atmosphere of 100 kPa. The magnet was kept in a 45° position in order to cause the balls to provide strong impacts inside the mill. In the following heating process 1 g of the milled mixture of FeTiO3 and LiOH·H2O was loaded into an alumina combustion boat and the boat was placed into the centre of a horizontal tube furnace. The temperature in the furnace was raised from room temperature to 400 °C within about 30 min and kept at that level for 12 h. At the end of the heating procedure, the furnace was allowed to cool down to room temperature in argon gas flow. Argon gas flow (50 ml min−1) was maintained through the furnace tube for the duration of the whole procedure. Commercially available multi-walled carbon nanotubes (MWCNTs) (>95%, Sigma-Aldrich, 724769) were used to prepare LiFeTiO4–carbon nanotube nanocomposites. 1 g of a mixture of the obtained LiFeTiO4 powder and MWCNTs with a weight ratio of LiFeTiO4 to MWCNTs of 4:1 was dispersed in 10 mL of ethanol, sonicated for 0.5 h and dried at room temperature. The dried sample was ball milled in the same magneto-ball mill for 12 h at room temperature under Ar atmosphere (100 kPa). Rotation speed of 75 rpm was used and an external magnet removed in this preparation routine. Such a milling mode provides low-energy conditions suitable for preventing dramatic modification or damaging of ingredients during milling. A similar procedure of low-energy ball milling was described in detail elsewhere ref. 22.
2.2. Characterisation
X-ray diffraction (XRD) patterns of the samples were recorded on a PANalytical X'Pert PRO diffraction system using Cu-Kα X-ray source (λ = 1.5418 Å). Rietveld refinement was carried out in DIFFRACplus TOPAS 4.2 software using the fundamental parameters approach.23,24 The refinement was performed between 15–100° using a 5-parameter Chebyshev polynomial equation to fit the background. During refinements, only the position of O ions were refined and constrained to be equal to each other in terms of x, y and z to comply with cubic-close packing. The occupation factors of Li and Fe were also refined while those of Ti and O were kept constant at 0.5 and 1.0. The thermal parameters of all ions were kept at 0.5 since their refinements led to substantially larger errors.Scanning electron microscopy (SEM, Carl Zeiss SUPRA55VP electron microscope) and transmission electron microscopy (TEM, JEOL JEM-2100F instrument operating at 200 kV) were used to investigate the structure, size, and morphology of the samples. Energy-filtered TEM (EFTEM) elemental maps were obtained using a Gatan Quantum ER 965 Imaging Filter installed on the JEOL JEM-2100F instrument. The three window method was used for the acquisition of the elemental maps. The Branauer–Emmett–Teller (BET) surface area of the sample was determined using a Micromeritics Tristar 3000 adsorption instrument. Thermal gravimetric analysis (TGA, Q50-1534 instrument, air flow, 20 °C min−1 heating rate) was used to estimate the carbon content in the sample.
2.3. Electrochemical experiments
Electrochemical measurements were performed using two-electrode coin cells (CR2032-type) assembled in an argon-filled glove box (Innovative Technology, USA). Li foil was used as a counter/reference electrode and a porous polyethene film was used as a separator. The electrolyte was 1 M LiPF6 in a 1:1:1 (by volume) mixture of ethylene carbonate (EC), diethylene carbonate (DEC) and dimethyl carbonate (DMC). The slurry for the LiFeTiO4 electrodes was prepared by mixing LiFeTiO4 nanoparticles, carbon black, and polyvinylidene difluoride (PVDF) with a weight ratio of 75:15:10 in N-methylpyrrolidone (NMP) was coated on Al foils. The slurry for the LiFeTiO4–carbon nanotube electrodes was prepared by mixing the active material (LiFeTiO4–carbon nanotube composite) with carbon black and PVDF binder in a weight ratio of 80:10:10 in NMP. The slurry in each case was uniformly pasted on Al foils and the electrodes were dried in a vacuum oven at 100 °C for over 12 h. The electrochemical tests were performed using an Ivium-n-stat instrument (Ivium Technologies, the Netherlands) and LAND battery systems for charge–discharge (Wuhan Land Electronic Co. Ltd., China). The cells were galvanostatically discharged and charged over a voltage range of 1.5–4.5 V vs. Li/Li+ at various current rates. Cyclic voltammetry (CV) experiments were performed over the same voltage range. Electrochemical impedance spectroscopy was performed in the frequency range between 100 kHz and 0.01 Hz at open circuit potential with amplitude of 5 mV. The capacity of the composite electrode was calculated for the total weight of the LiFeTiO4 phase and MWCNTs.
3. Results and discussion
The SEM and powder XRD techniques were used for the assessment of the general morphology of the LiFeTiO4–carbon nanocomposite as well as for the verification of the oxide phase in the as-produced nanoparticles and after their incorporation into the composite. An SEM image presenting the morphology of the LiFeTiO4–carbon nanocomposite is shown in Fig. 1a and b. Nanoscale particles as well as fibrous structures with typical diameters of 10–15 nm are visible. It is consistent with the idea that the LiFeTiO4 component is embedded into a network of carbon nanotubes. As it is shown in the subsequent parts of the manuscript, such a structure of the nanocomposite is of critical importance for the significant improvement of the capacity and rate performance of the principal electrode component with a limited electronic conductivity. Powder XRD patterns of the as-obtained LiFeTiO4 nanoparticles and the LiFeTiO4–carbon nanocomposite are shown in Fig. 1c. All significant peaks in both patterns can be indexed to the cubic LiFeTiO4 (JCPDS no. 01-055-0988), indicating a reasonable phase purity of the LiFeTiO4 nanoparticles not only in the original sample but also after embedding them into the network of carbon nanotubes by the low-energy mechanical milling. | ||
| Fig. 1 SEM images of LiFeTiO4–carbon nanocomposite (a and b) and XRD patterns of LiFeTiO4 nanoparticles and LiFeTiO4–carbon nanocomposites (c). | ||
A longer XRD scan was conducted to collect data suitable for Rietveld refinement. Fig. 2a shows Rietveld refinement plot of LiFeTiO4 which contains minor phase impurities, most probably due to Li2O3Ti (JCPDS no. 98-016-2215) and Fe3O4 (JCPDS no. 00-003-0863). Except for the peaks from impurities, the refinements converged into a reasonably low reliability factor (Rwp) of 3.05, indicating a good fit. LiFeTiO4 exhibits spinel structure with intermixed Li and Fe cations due to their almost similar size.25 Rietveld refinement was performed to obtain the approximate distribution of Li and Fe in the tetrahedral sites (8a) and octahedral sites (16a) (Fig. 2b and Table 1) of which Li occupies around 34% of the octahedral sites while Fe occupies around 56% of the tetrahedral sites, leading to a formula of (Li0.44Fe0.56)(Li0.68Fe0.32Ti)O4. This implies a larger amount of Li in octahedral site and overall, a formation of a non-stoichiometric compound with a slight excess of Li (relative to Fe) – compare with the ideal stoichiometric formula of (Li0.5Fe0.5)(Li0.5Fe0.5Ti)O4.
 | ||
| Fig. 2 Rietveld refinement of the crystal structure: (a) refinement plot of LiFeTiO4 between 15–100°, (b) Structure of LiFeTiO4 (drawn using VESTA).26 | ||
| LiFeTiO4 | ||||||
|---|---|---|---|---|---|---|
| Space group | Fd-3m | |||||
| Space group no. | 227 | |||||
| a (Å) | 8.356(4) | |||||
| Atom | Np | x | y | z | Occ. | biso (Å2) |
| Ti | 16 | 0.5 | 0.5 | 0.5 | 0.5 | 0.5 |
| Li | 16 | 0.5 | 0.5 | 0.5 | 0.34(1) | 0.5 |
| Fe | 16 | 0.5 | 0.5 | 0.5 | 0.16(1) | 0.5 |
| Li | 8 | 0.125 | 0.125 | 0.125 | 0.44(7) | 0.5 |
| Fe | 8 | 0.125 | 0.125 | 0.125 | 0.56(7) | 0.5 |
| O | 32 | 0.2514(5) | 0.2514(5) | 0.2514(5) | 1 | 0.5 |
| χ2 | 1.41 | |||||
| Rp (%) | 2.31 | |||||
| Rwp (%) | 3.05 | |||||
| Rexp (%) | 2.17 | |||||
| RBragg (%) | 0.95 | |||||
The measured BET surface area of the LiFeTiO4–carbon nanocomposite was 58.3 m2 g−1. Fig. 3 shows the plot of the adsorbed amount vs. pressure points used for the calculation of BET area.
 | ||
| Fig. 3 The plot of the adsorbed amount vs. pressure points used for the calculation of BET surface area. | ||
The TEM characterisation further confirms these findings. Indeed, a bright-field image shown in Fig. 4a displays a mixture of metal oxide particles (possessing a typical darker contrast) and MWCNTs. A selected area electron diffraction pattern (Fig. 4b) includes a number of rings, consistent with the presence of a polycrystalline structure or a large number of randomly oriented nanoparticles. The pattern can be indexed in line with the diffraction rings of the LiFeTiO4 phase, which correlates well with the XRD data. The crystallographic Miller indices corresponding to the visible rings in the electron diffraction pattern are labelled in Fig. 4b.
 | ||
| Fig. 4 TEM characterisation of the nanocomposite: (a) bright-field image; (b) selected area diffraction pattern. | ||
Energy-filtered TEM was employed to demonstrate the degree of mixing of LiFeTiO4 particles and MWCNTs directly. A bright-field image is shown in Fig. 5a and it displays rather confusing contrast due to the overlap between various components of the composite. Extracting chemical information via the filtering of electron energy helps to visualise the location of LiFeTiO4 material and carbon nanotubes in the sample. Individual elemental maps of carbon, iron oxygen and titanium are shown in Fig. 5b–e. For obvious reasons, the Fe, O and Ti maps show similar distributions of these elements. One of the maps (Ti) was selected and plotted together with the carbon map in a colour-coded plot (Fig. 5f). The overlay of the Ti and carbon maps (Fig. 5f) displays the chemical information required for the correct interpretation of the bright-field image in Fig. 5a and provides direct visualisation of the location of MWCNTs and LiFeTiO4 nanoparticles in the sample. LiFeTiO4 and CNT components are well-mixed in the nanocomposite. We believe that the LiFeTiO4 particles are simply connected to each other via mechanical force. As it follows from TEM images (Fig. 4 and 5), the sample represents aggregates of inorganic nanoparticles with nanotubes in which the network of nanotubes squeeze particles between individual nanotubes. It is also possible that some nanoparticles of LiFeTiO4 may become cold welded to each other, as it is a well-known phenomenon in ball milling.
 | ||
| Fig. 5 EFTEM analysis of the nanocomposite: (a) unfiltered bright-field image; (b–e) elemental maps of carbon, iron, oxygen and titanium; (f) an overlay of the titanium and carbon maps (colour scheme: Ti-green, C-red). | ||
Fig. 6 shows the TGA plot of the LiFeTiO4–MWCNT composite in air. The low temperature weight loss (25–300 °C) is related to the departure of moisture and other adsorbed species as well as processes in the impurities present in the sample (<5 wt.%, according to the specification of MWCNTs). It is reasonable to attribute weight loss above 300 °C to the oxidation of nanotubes. Indeed, as Hsieh et al.27 have shown by differential scanning calorimetry, the onset of the oxidation for the multiwalled carbon nanotubes is above 300 °C. We therefore attribute weight changes above 300 °C predominantly to the oxidation of carbon nanotubes. According to Fig. 6, the weight loss between 300 and 500 °C is approximately 17.5 wt.% while 69.5 wt.% of the sample remains intact above 500 °C. We can estimate from this measurement that the weight ratio of LiFeTiO4 to MWCNTs in the produced sample is likely to be about 3.97:1, close to the ratio of 4:1 between the initial ingredients for the preparation of the composite.
 | ||
| Fig. 6 TGA plot of the LiFeTiO4–MWCNT composite in air. | ||
Fig. 7a shows the discharge capacities versus cycle number for LiFeTiO4 and the LiFeTiO4–MWCNT composite at a current rate of 25 mA g−1. The LiFeTiO4–C nanocomposite exhibits a stable discharge capacity of about 110 mA h g−1 after 100th cycles, which is much higher than that of LiFeTiO4 nanoparticles (about 70 mA h g−1). The Coulombic efficiencies of the two electrodes are also plotted in the same graph. The corresponding selected discharge–charge voltage profiles for the nanocomposite electrode from the first 50 cycles are shown in Fig. 7b. The shape of the profiles does not change significantly during cycling, indicating good capacity retention at slow current rates. The rate capabilities of both the LiFeTiO4 and LiFeTiO4–MWCNT electrodes were tested at various current densities between 12.5 and 500 mA g−1 (Fig. 7c and d). It is apparent that the capacity retention for the composite electrode is superior, and the discharge capacities of 135, 122, 112, 97, 76, and 65 mA h g−1 were recorded for this electrode after 20 cycles at current densities of 12.5, 25, 50, 100, 200, and 500 mA g−1, respectively. The composite electrode can obviously operate at up to 500 mA g−1 currents and retain capacity equal to or above that of LiFeTiO4 nanoparticles at a slow current rate of 25 mA g−1.
 | ||
| Fig. 7 Discharge capacity vs. cycle number for the LiFeTiO4–carbon nanocomposite and LiFeTiO4 nanoparticles (a), selected galvanostatic charge–discharge curves at 25 mA g−1 for the LiFeTiO4–carbon nanocomposite (b), and charge–discharge voltage profiles for the LiFeTiO4 electrode (c) and nanocomposite in the 20th cycle at various current rates (d). | ||
It is important to note that the capacity of the LiFeTiO4 and LiFeTiO4–MWCNT electrodes depends on the chosen potential range and will be smaller if the potential range of 2.0–4.5 is used. To complete the electrochemical characterisation, we have also included the CV curves for LiFeTiO4 and LiFeTiO4–MWCNT electrodes here (Fig. 8).
 | ||
| Fig. 8 Typical cyclic voltammograms: the first and subsequent cycles of the LiFeTiO4 electrode (a), and comparison of the electrode assembled with the LiFeTiO4–carbon nanocomposites and LiFeTiO4 nanoparticles (b). The CV measurements were performed at a scan rate of 0.2 mV s−1 in the voltage range of 1.5–4.5 V vs. Li/Li+. | ||
Electrochemical impedance spectroscopy measurements were carried out for the assembled cells (open circuit potential state) to investigate the rate of electron transfer in the LiFeTiO4 and LiFeTiO4–MWCNT electrodes. Typical Nyquist plots recorded for both electrodes are presented in Fig. 9. Both plots display one compressed semicircle in the high to medium frequency region and a sloped line in the low-frequency region. The diameter of each semicircle is related to the charge transfer resistance (Rct). The smaller the diameter, the smaller the charge transfer resistance is, and this parameter is a function of the electronic conductivity in the electrodes.28,29 It is clearly observed that diameter of the composite LiFeTiO4–MWCNT electrode is much smaller than that of the LiFeTiO4-based electrode. The values of Rct for the LiFeTiO4 and LiFeTiO4–MWCNT electrodes were calculated to be 829 Ω and 199 Ω, respectively. This indicates that LiFeTiO4 particles mixed with carbon nanotubes in a composite provide much easier charge transfer at the electrode/electrolyte interface, and that consequently decreases the overall battery internal resistance, enabling higher reactivity and lower polarisation.30,31 The underlying reason is the significant enhancement of the electronic conductivity in the electrode based on the LiFeTiO4–MWCNT composite; the nanotubes provide conductive paths in the vicinity of the LiFeTiO4 nanoparticles, and this is a key factor in improving the discharge capacity and rate capability of the LiFeTiO4–MWCNT electrode in respect to those of a more conventional LiFeTiO4 electrode.
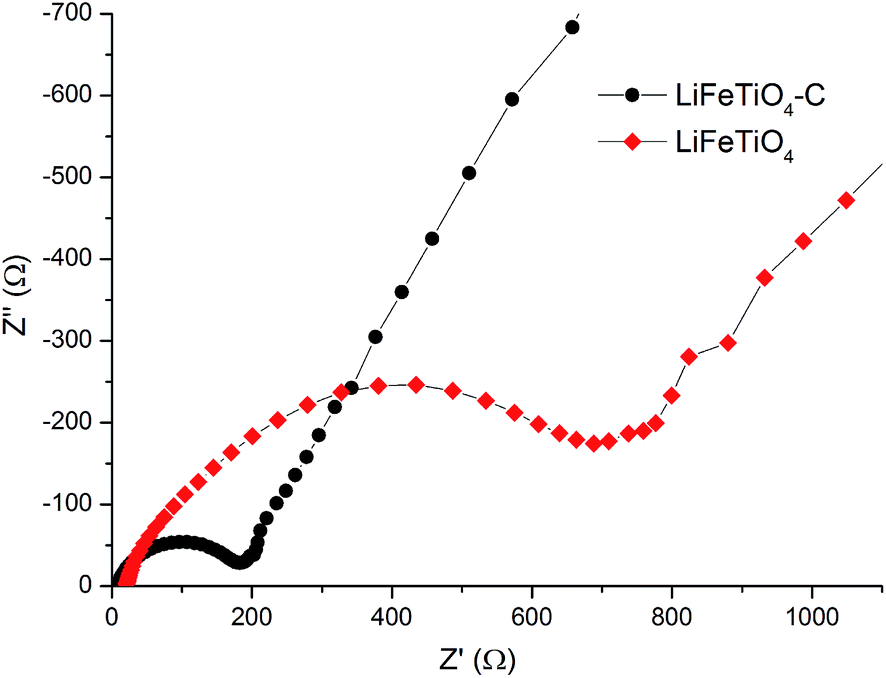 | ||
| Fig. 9 Electrochemical impedance spectra for the assembled coin cells incorporating working electrodes based on LiFeTiO4 nanoparticles and the LiFeTiO4–MWCNT composite. | ||
4. Conclusions
We have demonstrated a simple method to prepare nanocomposites of oxide phases with carbon nanotubes. The method is based on low-energy ball milling. Using an insulating phase of LiFeTiO4 as a test electrode material, we have shown that the LiFeTiO4–MWCNT nanocomposite displays capacity significantly higher than that of LiFeTiO4 nanoparticles (105–120 mA h g−1 vs. 65–70 mA h g−1 at a slow current rate of 25 mA g−1). The composite electrode can also operate at relatively high currents (current rates of up to 500 mA g−1 were evaluated). Transmission electron microscopy shows that good intimate mixing between LiFeTiO4 particles and carbon nanotubes has been achieved. That results in the dramatically improved electronic conductivity of the nanocomposite electrode, which agrees with the results of the impedance spectroscopy measurements.Acknowledgements
Financial support from the Australian Research Council under Discovery program is acknowledged. The authors also thank technical officers at Deakin University for their help in this work and acknowledge the use of electron microscopes in the Victorian Node of the Australian National Fabrication Facility (ANFF).References
- V. Etacheri, R. Marom, R. Elazari, G. Salitra and D. Aurbach, Energy Environ. Sci., 2011, 4, 3243 CAS.
- R. Marom, S. F. Amalraj, N. Leifer, D. Jacob and D. Aurbach, J. Mater. Chem., 2011, 21, 9938 RSC.
- A. Manthiram, J. Phys. Chem. Lett., 2011, 2, 176 CAS.
- A. K. Padhi, K. S. Nanjundaswamy and J. B. Goodenough, J. Electrochem. Soc., 1997, 144, 1188 CrossRef CAS PubMed.
- B. L. Ellis, K. T. Lee and L. F. Nazar, Chem. Mater., 2010, 22, 691 CrossRef CAS.
- K. Zaghib, M. Dontigny, A. Guerfi, P. Charest, I. Rodrigues, A. Mauger and C. M. Julien, J. Power Sources, 2011, 196, 3949 Search PubMed.
- N. Ravet, Y. Chouinard, J. F. Magnan, S. Besner, M. Gauthier and M. Armand, J. Power Sources, 2001, 97–98, 503 CrossRef CAS.
- H. Q. Li and H. S. Zhou, Chem. Commun., 2012, 48, 1201 RSC.
- C. de las Casas and W. Z. Li, J. Power Sources, 2012, 208, 74 CrossRef CAS PubMed.
- L. M. Dai, D. W. Chang and J. B. Ba, Small, 2012, 8, 1130 CrossRef CAS PubMed.
- X. M. Liu, Z. D. Huang, S. W. Oh, B. Zhang, P. C. Ma, M. M. F. Yuen and J. K. Kim, Compos. Sci. Technol., 2012, 72, 121 CrossRef CAS PubMed.
- S. B. Ma, K. W. Nam, W. S. Yoon, S. M. Bak, X. Q. Yang, B. W. Cho and K. B. Kim, Electrochem. Commun., 2009, 11, 1575 CrossRef CAS PubMed.
- G. X. Wang, X. P. Shen, J. Yao, D. Wexler and J. H. Ahn, Electrochem. Commun., 2009, 11, 546 CrossRef CAS PubMed.
- C. M. Ban, Z. Li, Z. C. Wu, M. J. Kirkham, L. Chen, Y. S. Jung, E. A. Payzant, Y. F. Yan, M. S. Whittingham and A. C. Dillon, Adv. Energy Mater., 2011, 1, 58 CrossRef CAS PubMed.
- A. L. M. Reddy, M. M. Shaijumon, S. R. Gowda and P. M. Ajayan, Nano Lett., 2009, 9, 1002 CrossRef CAS PubMed.
- S. J. Ding, J. S. Chen and X. W. Lou, Adv. Funct. Mater., 2011, 21, 4120 CrossRef CAS PubMed.
- S. R. Bruno, C. K. Blakely and V. V. Poltavets, ECS Trans., 2012, 41(29), 29 CAS.
- S. R. Bruno, C. K. Blakely and V. V. Poltavets, Abstract #214, 221st ECS Meeting, © 2012, The Electrochemical Society.
- S. Chakrabarti, A. K. Thakur and K. Biswas, Solid State Ionics, 2014, 262, 49 CrossRef CAS PubMed.
- S. R. Bruno, C. K. Blakely and V. V. Poltavets, ECS Trans., 2013, 45(29), 23 CrossRef CAS PubMed.
- T. Tao, A. M. Glushenkov, H. W. Liu, Z. W. Liu, X. J. Dai, H. Chen, S. P. Ringer and Y. Chen, J. Phys. Chem. C, 2011, 115, 17297 CAS.
- T. Tao, A. M. Glushenkov, C. Zhang, H. Zhang, D. Zhou, Z. Guo, H. K. Liu, Q. Chen, H. Hu and Y. Chen, J. Mater. Chem., 2011, 21, 9350 RSC.
- A. Coelho, Bruker AXS GmbH, Karlsruhe, Germany, 2008.
- R. W. Cheary and A. Coelho, J. Appl. Crystallogr., 1992, 25, 109 CrossRef CAS.
- M. A. Arillo, M. L. López, E. Perez-Cappe, C. Pico and M. L. Veiga, Solid State Ionics, 1998, 107, 307 CrossRef CAS.
- K. Momma and F. Izumi, Visualization for Electronic and Structural Analysis Ver.3.1.0. Copyright ©, 2006–2012.
- Y. C. Hsieh, Y. C. Chou, C. P. Lin, T. F. Hsieh and C. M. Shi, Aerosol Air Qual. Res., 2010, 10, 212 CAS.
- L. F. Jiao, H. T. Yuan, Y. C. Si, Y. J. Wang and Y. M. Wang, Electrochem. Commun., 2006, 8, 1041 CrossRef CAS PubMed.
- Y. Shao, M. Engelhard and Y. Lin, Electrochem. Commun., 2009, 11, 2064 Search PubMed.
- M. M. Rahman, J. Z. Wang, M. F. Hassan, S. Chou, Z. X. Chen and H. K. Liu, Energy Environ. Sci., 2011, 4, 952 CAS.
- M. F. Hassan, M. M. Rahman, Z. Guo, Z. Chen and H. K. Liu, J. Mater. Chem., 2010, 20, 9707 RSC.
| This journal is © The Royal Society of Chemistry 2014 |