Dual drug loaded vitamin D3 nanoparticle to target drug resistance in cancer

Sandeep Palvai a, Jyothi Nagrajb, Nikunj Maparaa, Rajdeep Chowdhury*b and Sudipta Basu*a
aDepartment of Chemistry, Indian Institute of Science Education and Research (IISER)-Pune, Pune, 411021, Maharashtra, India. E-mail: sudipta.basu@iiserpune.ac.in
bDepartment of Bio-Sciences, Birla Institute of Technology and Science (BITS), Pilani, 333031, Rajasthan, India. E-mail: rajdeep.chowdhury@pilani.bits-pilani.ac.in

Received 1st July 2014 , Accepted 17th October 2014

First published on 17th October 2014


Abstract

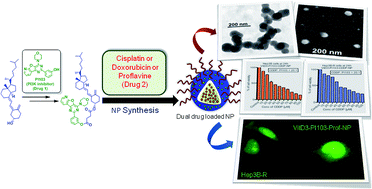
Overcoming drug resistance is one of the most challenging problems in cancer chemotherapy. Drug cocktails can overcome the drug resistance. However, multiple drug combinations lead to multifold increment of off-target toxicity, as well as the delivery of the required therapeutic amount of combined drugs remains problematic. To address these problems, we have developed a sub 200 nm vitamin D3 nanoparticle, which can contain a rational combination of dual drugs (PI103 and cisplatin or doxorubicin or proflavine). The size, shape and morphology of these dual drug containing vitamin D3 nanoparticles were characterized by DLS, FESEM, AFM and TEM. The nanoparticles released the dual drugs in high quantity at pH = 5.5 compared to pH = 7.4 in a slow and sustained manner over 72 h with stability over 15 days at 37 °C, as well as 4 °C. These dual drug loaded nanoparticles induced increased cell death in human hepatocellular carcinoma, Hep3B cells at 24 h compared to monotherapy; moreover, they were effective against cisplatin-resistant cells (Hep3B-R) as well. VitD3–PI103–CDDP-NP and vitD3–PI103–Dox-NP showed cytotoxicity by inducing apoptosis through DNA damage. Furthermore, vitD3–PI103–CDDP-NP showed considerably improved efficacy in 5-fluorouracil (5-FU) resistant Hep3B–5FU-R cells; its activity was even better compared to 5-FU. Finally, vitD3–PI103–proflavine-NP internalized into Hep3B-R cells considerably faster (within 3 minutes) compared to Hep3B cells, as visualized by fluorescent microscopy. Therefore, these dual drug loaded nanoparticles can successfully overcome the trauma of drug resistance and have the potential to be applied into the clinics for improved cancer therapeutics.

1. Introduction

Cancer is one of the most dangerous diseases in the world.1 Traditional cancer therapy uses highly cytotoxic drugs as chemotherapy alone or in combination with radiation therapy. However, most of the tumors can bypass the effect of monotherapy by developing intrinsic or acquired resistance mechanisms.2 Intrinsic resistance mechanisms can pre-exist in the tumor through the activation of redundant signalling pathways or overexpressing drug efflux pumps or the mutational activation of downstream signalling. Moreover, acquired resistance can develop during the treatment of a tumor by the mutations of the target or upregulation of other signalling pathways or downregulation of tumor suppressor proteins.3 As a result, rational combinatorial polypharmacy has emerged as an interesting strategy to target cancer in the post-genomic era.4 However, the foremost shortcoming of current cancer chemotherapy is the nonspecific diffusion of drug cocktails, leading to escalated toxicity of the drug combinations. Moreover, the drugs face the challenge of overcoming the biological barriers to reach the tumor target in appropriate concentrations and combinations that offer the effective therapeutic efficacy.

To reduce the off-target toxicity of the cytotoxic drug combinations and deliver those specifically to the tumor tissues in the appropriate therapeutic dose, nanotechnology based platforms have emerged as attractive tools in cancer therapy.5 The nanovectors can either enter in the tumor using unique leaky vasculature by enhanced permeability and retention (EPR) effect (passive targeting)6 or by taking advantage of the ligand–biomarker interaction, which is overexpressed on the surface of the specific tumor cells (active targeting).7 The most efficient size of the nanovectors taking advantage of the EPR effect is <200 nm.8–11 Several nanovectors, including polymeric nanoparticles,12–14 minicell,15 nanocell,16 micelleplex,17 drug–nanoparticles,18 layer-by-layer nanoparticles,19 graphene-oxide,20 carbon nanotubes,21 gel-liposome22 and mesoporous silica nanospheres,23 have been explored to deliver multiple drugs or drug–siRNA combinations in different types of cancers. However, the prudent choice of nanovectors based on their biocompatibility and biodegradability is currently one of the major challenges in nanomedicine.24–29 To address this, our previous study showed that novel nanoparticles can be engineered by biocompatible, biodegradable and nontoxic vitamin D3 for drug delivery in cancer.30

Inspired by the need for developing novel biocompatible and biodegradable nanovectors, the aim of the study was to develop a vitamin D3 nanoparticle as a versatile platform for dual drug delivery to overcome drug resistance in cancer. In this current study, we have engineered vitamin D3 nanoparticles that can simultaneously contain phosphatidylinositol-3-kinase (PI3K) inhibitor (PI103) and DNA damaging drugs (cisplatin or doxorubicin or proflavine) in combination. These sub 200 nm vitamin D3 nanoparticles allowed the high loading of the dual drugs and released them in increased quantity at pH = 5.5 (mimics the lysosomal compartment inside tumor cells) compared to that at pH = 7.4 (mimics the blood stream) in a slow and sustained manner over 72 h. VitD3–PI103–CDDP-NP and vitD3–PI103–Dox-NP showed cytotoxicity by inducing apoptosis through the DNA damage mechanism in Hep3B and cisplatin resistant Hep3B cells. Finally, vitD3–PI103–proflavine-NP was rapidly internalized inside the cells to induce cell death in cisplatin resistant Hep3B hepatocellular carcinoma. These dual drug containing vitamin D3 nanoparticles showed their potential to simultaneously deploy multiple drugs inside the tumor to overcome drug resistance.

2. Material and methods

2.1 Materials

All the reactions were performed under inert conditions unless otherwise indicated. All the commercially obtained compounds were used without further purification. Ethyl acetate, petroleum ether, dry dichloromethane (DCM), methanol, dimethyl sulfoxide (DMSO), cholecalciferol, succinic anhydride, sodium sulphate, pyridine, N-(3-dimethylaminopropyl)-N′-ethylcarbodiimide hydrochloride (EDC), L-α-phosphatidylcholine (PC), sephadex G-25, uranyl acetate dehydrate, cisplatin, proflavine hydrochloride, copper grid for TEM, mica sheet for AFM, silicon wafer for FE-SEM and 3-(4,5-dimethylthiazol-2-yl)-2,5-diphenyltetrazolium bromide (MTT) were purchased from Sigma-Aldrich. PI103 and doxorubicin were purchased from Selleck Chemicals. 1,2-Distearoyl-sn-glycero-3-phosphoethanolamine-N-[amino(polyethylene glycol) 2000] (DSPE-PEG) and the mini handheld Extruder kit (including 0.2 μm Whatman Nucleopore Track-Etch Membrane, Whatman filter supports and 1.0 mL Hamiltonian syringes) were purchased from Avanti Polar Lipids Inc. Analytical thin-layer chromatography (TLC) was performed using precoated silica gel aluminium sheets 60 F254 purchased from EMD Laboratories. Minimal essential medium (MEM), fetal bovine serum (FBS), phosphate buffer saline (PBS), penicillin and streptomycin were purchased from Invitrogen. Hep3B cells were obtained from National Centre for Cell Science (NCCS), Pune. Spots on the TLC plates were visualized using alkanine permanganate or phosphomolybdic acid hydrate in methanol. The release kinetic data, drug loading, nanoparticle size and cell viability assay were plotted using GraphPad Prism software. Each sample was done in triplicate. Epifluorescence images were captured using an Olympus-BX-41 microscope. WST-1 reagent (cat # 11644807001) was obtained from Roche. Chou-Talalay analysis was done using CompuSyn software from http://www.combosyn.com/feature.html. Trypan blue dye was obtained from Bio-Rad. RIPA buffer, Tween-20 and protease cocktail inhibitors were purchased from Sigma-Aldrich. PARP antibody was purchased from Cell Signaling Technology. β-actin antibody and peroxidase conjugated antirabbit and antimouse IgG were obtained from Santa Cruz Biotechnology. CPP32 colorimetric protease assay kit was obtained from Invitrogen.

2.2 Methods

2.2.1 Synthesis of dual drug loaded vitamin D3 nanoparticles. 5.0 mg of L-α-phosphatidylcholine (PC), 2.5 mg of vitamin D3–PI103 conjugate (2) and 0.5 mg of 1,2-distearoyl-sn-glycero-3-phosphoethanolamine-N-[amino(polyethylene glycol)2000] (DSPE-PEG) were dissolved in 5.0 mL DCM. The solvent was evaporated using a rotary evaporator, and a thin and uniform lipid film was thus obtained. 1 mg of drug (cisplatin, doxorubicin or proflavin) dissolved in 1.0 mL of H2O was added into the lipid layer and it was hydrated for 2 h at 60 °C. To remove residual nonencapsulated drugs, the nanoparticles solution was passed though a Sephadex G-25 column and extruded through 200 nm Whatman polycarbonate membrane at 60 °C to obtain sub 200 nm particles. The dual drug loaded nanoparticles were stored at 4 °C for further use.
2.2.2 Quantification of drug loading in the nanoparticles. A calibration curve was plotted in the concentration range of 2.5–15 μM (for cisplatin), 10–100 μM (for doxorubicin), and 5–25 μM for both PI103 and proflavin individually, by diluting the 1 mM standard stock solution of drugs in DMSO. The absorbance was measured at 706 nm for cisplatin, 490 nm for doxorubicin, 444 nm for proflavin and 340 nm for PI103 against the corresponding solvent blank. The linearity was plotted for absorbance (A) against concentration (C). To determine the drug loading in nanoparticles, they were dissolved in spectroscopic grade DMSO in 2.5%, 5% and 7.5% dilution. Absorbance was measured at characteristic wavelength against the corresponding solvent blank in 200 μL quartz cuvette and from the calibration curve, drug loading was measured. The quantification of cisplatin was done using a solution of o-phenylenediamine in DMF heated at 100 °C for 4 h, till the solution turned deep green in colour. For the calibration curve, 1 mM stock was prepared by dissolving cisplatin into 1.2 mg mL−1 solution of o-phenylenediamine. The range of further dilutions from 2.5 μM to 15 μM was obtained by diluting stock solution with DMF. The absorbance was measured at 706 nm (which is characteristic λmax for cisplatin against DMF as blank). The linear relationship was obtained by plotting the absorbance values (A) against corresponding concentrations (C). To estimate drug loading, 5 μL, 10 μL, and 15 μL of nanoparticle solutions were dissolved in 200 μL o-phenylene diamine solution (1.2 mg mL−1 of DMF). The mixture was then heated at 100 °C for 4 h until a greenish yellow color appeared. Absorbance was measured at characteristic wavelength against the corresponding solvent blank in 200 μL quartz cuvette and from the calibration curve, drug loading was measured in triplicate.

Stock solutions were prepared in different concentrations (5, 10, 15, 20, 25, and 30 μM concentrations of doxorubicin and proflavine in 1[thin space (1/6-em)]:[thin space (1/6-em)]1 water acetonitrile mixture) and filtered through 0.22 μm filters and injected (25 μL) into an Agilent high performance liquid chromatography (HPLC) attached with a diode-array detector (λmax = 496 nm and 260 nm for doxorubicin and proflavine, respectively) and a Zorbax SB C-18 reversed phase column (250 mm × 4.6 mm, 5 μm). A mobile phase of water[thin space (1/6-em)]:[thin space (1/6-em)]acetonitrile was used with a run time of 40 min; multistep gradient technology with a flow rate of 1 mL min−1 starting with 80%[thin space (1/6-em)]:[thin space (1/6-em)]20% → 0–5 min, 40%[thin space (1/6-em)]:[thin space (1/6-em)]60% → 5–30 min, 80%[thin space (1/6-em)]:[thin space (1/6-em)]20% → 30–35 min, and 80%[thin space (1/6-em)]:[thin space (1/6-em)]20% → 35–40 min. Peak areas and retention times were recorded and a calibration graph was obtained by plotting peak area versus the concentration of doxorubicin and proflavine. Drug loading was determined in triplicate by dissolving nanoparticles in 1[thin space (1/6-em)]:[thin space (1/6-em)]1 ratio of water and acetonitrile in 2.5%, 5% and 7.5% dilutions, which were then filtered through 0.22 μm filters before injection. The peak area was measured and from the calibration curve, drug loading was measured.

2.2.3 Determination of the hydrodynamic diameter of dual drug loaded nanoparticles by dynamic light scattering (DLS). The mean hydrodynamic diameter of the dual drug loaded nanoparticles was measured by dynamic light scattering (DLS) method using Zetasizer Nano2590 (Malvern, UK). 50 μL of nanoparticle solution was diluted to 1 mL using DI water and 3 sets of 10 measurements each were performed at 90 degree scattering angle to get the average particle size.
2.2.4 Field-emission scanning electron microscopy (FESEM) of nanoparticles. 5 μL of nanoparticles in water was placed on a silicon chip without any dopant, and it was allowed to dry at room temperature under vacuum desiccators for 4 hours. The silicon chip was then gold-coated (10–15 nm thickness) using Quorum, Q150T-E5. The FESEM measurements were done using a Carl Zeiss, Ultra plus, scanning electron microscope at an operating voltage of 4.0 kV.
2.2.5 Atomic force microscopy (AFM) of nanoparticles. 10 μL of nanoparticles in water was placed on a mica sheet and dried under vacuum desiccators for 4 h. The shape and size of the nanoparticles were determined using NanoWizard Atomic Force Microscopy (AFM).
2.2.6 Transmission electron microscopy (TEM) of nanoparticles. 15 μL of nanoparticles in water was placed on a TEM copper grid. After 30 min, this sample drop was wicked off by using filter paper, and then 15 μL of freshly prepared 0.25% uranyl acetate (2.5 mg uranyl acetate in 1 mL dd water) solution was placed on the TEM copper grid. After 1 min, uranyl acetate solution was wicked off and the sample was washed three times with 15 μL dd water each time. The sample was dried overnight on a clean dust-free surface under a funnel. The nanoparticles were imaged using Tecnai G2 20-Twin LR-TEM instruments.
2.2.7 Determination of dual drug release from the nanoparticles. Concentrated 200 μL drug loaded nanoparticles were suspended in 200 μL solution of pH 5.5 or in PBS buffer (pH = 7.4) and sealed in a dialysis membrane (MWCO = 2000 Dalton). The dialysis bags were then suspended in 10 mL pH 5.5 solution or in PBS buffer (pH = 7.4) at room temperature with gentle shaking. 400 μL of the solution was withdrawn from the incubation medium and was collected at predetermined time intervals. The released dual drugs were quantified by a UV-vis spectrophotometer.
2.2.8 Cell culture. Human hepatocellular carcinoma cell line, Hep3B (obtained from NCCS Pune), were cultured at 37 °C, 5% CO2, in minimal essential medium (MEM) supplemented with 10% fetal bovine serum (FBS), 100 units per mL penicillin, and 100 μg mL−1 streptomycin. The cells were typically grown to 60–70% confluency, rinsed in phosphate-buffered saline (PBS) and placed into fresh medium prior to treatments.
2.2.9 MTT cytotoxicity assay. For determining the in vitro cytotoxicity, the cells were seeded at a density of 4000 cells per well in a 96 well plate and incubated overnight under optimum culture conditions. The drug stocks were prepared in DMSO. The cells were treated with various drugs or nanoparticles at different concentrations for 24 hours. A DMSO (0.2%) control was also performed. Following the treatment, 20 μL of MTT dissolved in 1× PBS was added to each well at a final concentration of 1 mg mL−1 and incubated for 4 h. Formazan crystals that were formed due to the presence of live cells were solubilized in DMSO. Readings were obtained at 495 nm with a differential filter of 630 nm using a microplate reader. The experiment was performed in triplicate, and a paired t-test was used to determine the statistical significance (at 5% level of significance).
2.2.10 Creation of resistant cell lines. The sensitivity of Hep3B cells to cisplatin was initially evaluated. IC50 was determined by MTT assay. To create drug-resistant cell lines, Hep3B cells were given an insult of a very high concentration of cisplatin (1 mM). The high dose drug treatment was repeated on cells that revived after each insult, and this cycle was continued for several times. Cells surviving the repeated cycles of drug treatment were found to be comparatively resistant to cisplatin (Hep3B-R) than parental untreated cells (Hep3B). Resistance to cisplatin was checked by MTT assay. The cells were subsequently maintained at IC50.
2.2.11 WST-1 cytotoxicity assay. Hep3B and Hep3B-R cells growing in log phase were briefly seeded at a density of 4000 cells per well in a 96 well plate and incubated for 24 hours with 5% CO2 at 37 °C. The cells were treated with vitD3–PI103–CDDP-NP, vitD3–CDDP-NP, free CDDP and empty-vitD3-NP at various concentrations for 24 hours. Following the drug treatment, WST1 reagent was added (10 μL in 100 μL media) in all the wells and incubated for 4 hours. Then, absorbance was measured at 450 nm using a microplate reader. The percentage of viable cells was calculated using the following formula:
Viability (%) = (mean absorbance value of drug treated cells)/(mean absorbance value of control) × 100.
2.2.12 Trypan blue cell viability assay. Hep3B and Hep3B-R cells growing in log phase were briefly seeded at a density of 4 × 10⁴ in a 6 well plate and incubated for 24 hours with 5% CO2 at 37 °C. The cells were treated with vitD3–PI103–CDDP-NP, vitD3–PI103-NP, vitD3–CDDP-NP, empty vitD3-NP and free CDDP at various concentrations with untreated cells as control for 24 hours. Post treatment, the cells were washed with 1× PBS and trypsinised. The cells were spun down and resuspended in fresh media, 20 μL of which was mixed with 2 μL of trypan blue dye and placed in a dual chamber cell counter slide. The viability was checked using an automated cell counter (BioRad, USA).
2.2.13 Western blot analysis for PARP. Cells were seeded at a density of 1 × 10⁶ in a 60 mm dish and maintained at 5% CO2 at 37 °C in an incubator. After the treatment for 24 hours, the cells were harvested by scraping in RIPA buffer supplemented with protease cocktail inhibitor. Briefly, 40 μg of protein was loaded per sample by standard SDS-PAGE on 10% gel and electrophoretically transferred onto a PVDF membrane. After blocking in 5% nonfat dry milk in 1× TBS and 0.01% Tween-20, proteins were immune-detected using antibodies against PARP (dilution 1[thin space (1/6-em)]:[thin space (1/6-em)]1000, Cell Signaling Technology). The equal loading of protein was verified using β-actin (1[thin space (1/6-em)]:[thin space (1/6-em)]2000, Santa Cruz Biotechnology) antibodies. Peroxidase conjugated antirabbit and antimouse IgG (1[thin space (1/6-em)]:[thin space (1/6-em)]10[thin space (1/6-em)]000 and 1[thin space (1/6-em)]:[thin space (1/6-em)]20[thin space (1/6-em)]000, Santa Cruz Biotechnology) were used as secondary antibodies followed by the detection of specific signals using ECL western blotting substrate. The densitometric quantification of PARP normalized to β-actin band intensities was done with ImageJ1.47 (National Institute of Health, Bethesda, MD, USA).
2.2.14 Caspase-3 protease assay. Caspase-3 activity was determined using CPP32 colorimetric protease assay. The cells were seeded at a density of 1 × 10⁶ in a 60 mm dish and maintained at 5% CO2 at 37 °C in an incubator. After treatment for 24 hours, the cells were harvested by cell lysis buffer and either 100 μg or 200 μg of protein lysate were loaded in a 96 well plate. Caspase-3 activity was determined by adding DEVD-pNA substrate and incubating for 2 hours in the dark at 37 °C. The samples were read at 405 nm using an enzyme-linked immunosorbent assay (ELISA) microplate reader.
2.2.15 Fluorescent imaging of nanoparticle internalization. Hep3B or Hep3B-R cells were seeded on sterile cover slips kept in 6 cm dishes at a density of 6000 cells per well. After overnight incubation in a normal cell culture conditions mentioned above, the media was removed and the cells were washed three times with 1× PBS and treated with vitD3–PI103–proflavine-NP at a concentration of 30 μM (in MEM media) for 3 minutes. The cover slips were washed thrice in 1× PBS and mounted on a slide and observed under fluorescence microscope using an FITC filter (emission wavelength 513–556 nm).

3. Results and discussion

3.1 Rationale for choosing the drug combinations

The drug combinations were selected very carefully to show the versatility of our vitamin D3 nanoplatform. We have selected a DNA damaging drug cisplatin, which is widely used in clinics for the treatment of different types of cancers.31–33 However, cisplatin leads to dose dependent nephrotoxicity in the patients.34,35 Moreover, very often cisplatin treatments result in the development of chemoresistance leading to the therapeutic failure due to various molecular mechanisms.36,37 Recently, it was shown that cisplatin upregulates PI3K signalling leading to apoptosis via survivin.38 As a result, a rational combination of cisplatin with a class I PI3K inhibitor PI103 showed synergistic enhancement in inducing apoptosis in liposarcoma.39 The phosphatidylinositol-3-kinase (PI3K) signalling and its downstream mammalian target of rapamycin (mTOR) are highly aberrant in different human malignancies.40,41 However, inhibiting mTOR with rapamycin and its analogues triggers the feedback mechanism to hyperactivate upstream Akt signalling through an IGF-1R dependent mechanism.42 Therefore, we have selected PI103, which is a dual Akt–mTOR inhibitor currently used in clinical study.43,44 Moreover, PI103 showed enhanced apoptosis in combination with another clinically approved DNA damaging drug doxorubicin in glioblastoma.45 However, PI103 has low hydrophilicity and rapid in vivo metabolism46 and doxorubicin shows dose dependent cardiotoxicity47,48 among the patients. Finally, we have selected a DNA minor groove binder fluorescent anticancer acridine derivative proflavine49,50 to incorporate into our nanoplatform in combination with PI103. However, there is no report of combination therapy using proflavine and PI103 in cancer to date.

3.2 Synthesis and characterization of vitamin D3 nanoparticles with dual drugs

We have conjugated PI103 with vitamin D3 (1, Fig. 1a) using ester linkage through a biocompatible succinic acid linker to obtain vitamin D3–succinic acid–PI103 conjugate (2) by a previously described method.30 We engineered vitamin D3 nanoparticles with dual drugs using a lipid-film hydration-extrusion method51 using L-α-phosphatidylcholine (PC), 1,2-distearoyl-sn-glycero-3-phosphoethanolamine-N-[amino (polyethylene glycol)2000] (DSPE-PEG), vitamin D3–succinic acid–PI103 conjugate (2) and drugs (cisplatin or doxorubicin or proflavine) in 2[thin space (1/6-em)]:[thin space (1/6-em)]0.2[thin space (1/6-em)]:[thin space (1/6-em)]1[thin space (1/6-em)]:[thin space (1/6-em)]0.4 weight ratio. PC was very carefully selected because of its biocompatibility. DSPE-PEG was chosen to cover the surface of the nanoparticles with polyethylene glycol (PEG) to reduce opsonisation, clearance by reticuloendothelial system (RES) and to ensure a long half-life in the blood circulation.52
image file: c4ra06475e-f1.tif
Fig. 1 Synthesis of dual drug loaded vitamin D3 nanoparticle. (a) Synthetic scheme of vitamin D3–PI103-conjugate and dual drug loaded nanoparticle. (b) Loading of different drugs in dual drug loaded nanoparticles determined by UV-vis spectroscopy.

The loading of different drugs in the nanoparticles were quantified using UV-vis spectroscopy by concentration versus absorbance graph at different characteristics wavelength, λmax = 340 nm, 444 nm, 490 nm and 706 nm for PI103, proflavine, doxorubicin and cisplatin, respectively (Fig. S1 and S2 in ESI). The mean drug loading in vitD3–PI103–CDDP-NP was found to be equal to 23.8 ± 2.4 μg of PI103 and 306.4 ± 17.6 μg of cisplatin (cisplatin encapsulation efficiency = 67.4%) per mg of formulation (Fig. 1b). Moreover, mean drug loading in vitD3–PI103–Dox-NP was 42.0 ± 2.2 μg for PI103 and 158.0 ± 7.9 μg for doxorubicin (doxorubicin encapsulation efficiency = 34.7%) per mg of final formulation. Finally, mean drug loadings for PI103 and proflavine in vitD3–PI103–proflavine-NP were found to be equal to 66.4 ± 9.4 μg and 149.5 ± 11.9 μg, respectively, (proflavine encapsulation efficiency = 32.9%) per mg of final formulation (mean ± SEM, n = 3).

We also quantified the loading efficiency and encapsulation efficiency using reverse phase high performance liquid chromatography (RP-HPLC) through concentration vs. peak area graphs (Fig. S3a and b in ESI). The loading of doxorubicin and proflavine were found to be 120.9 ± 6.2 μg (encapsulation efficiency = 26.6%) and 93.2 ± 4.3 μg (encapsulation efficiency = 20.4%) per mg of final formulation, respectively (Fig. S3c in ESI).

The hydrodynamic diameter and the polydispersity index (PDI) of the dual drug loaded nanoparticles were determined by dynamic light scattering (DLS). The hydrodynamic diameter were found to be equal to 193.79 ± 0.4 nm (PDI = 0.3 ± 0.006), 168.53 ± 0.2 nm (PDI = 0.09 ± 0.021) and 175.24 ± 0.6 nm (PDI = 0.1 ± 0.006) for vitD3–PI103–CDDP-NP, vitD3–PI103–proflavine-NP and vitD3–PI103–Dox-NP, respectively (Fig. 2a–c). We also visualized the size, shape and morphology of these dual drug loaded nanoparticles by field-emission scanning electron microscopy (FE-SEM, Fig. 2d–f), atomic force microscopy (AFM, Fig. 2g–i) and transmission emission microscopy (TEM, Fig. S4 in ESI). From DLS, FESEM, AFM and TEM data, it was evident that the dual drug loaded vitamin D3 nanoparticles are monodispersed and spherical in shape having sub 200 nm size, which was ideal for tumor internalization through passive targeting. We further confirmed the presence of cisplatin in vitD3–PI103–CDDP-NP by energy-dispersive X-ray spectroscopy (EDX) measurement (Fig. S5 in ESI). We also confirmed the presence of doxorubicin and proflavine in vitD3–PI103–Dox-NP and vitD3–PI103–proflavine-NP by fluorescence spectroscopy compared to free doxorubicin and proflavine, respectively (Fig. S6 in ESI).


image file: c4ra06475e-f2.tif
Fig. 2 Determination of size, shape and morphology of different dual drug loaded vitamin D3 nanoparticles. (a–c) DLS of vitD3–PI013–CDDP-NP, vitD3–PI103–proflavine-NP and vitD3–PI103–Dox-NP, respectively. (d–f) FESEM images of vitD3–PI013–CDDP-NP, vitD3–PI103–proflavine-NP and vitD3–PI103–Dox-NP, respectively. (g–i) AFM images of vitD3–PI013–CDDP-NP, vitD3–PI103–proflavine-NP and vitD3–PI103–Dox-NP, respectively.

Our previous study30 showed that hydrophilic drug encapsulation leads to considerably higher drug loading in vitamin D3 nanoparticles compared to the encapsulation of hydrophobic drugs. From this data, we anticipated that the vitamin D3 nanoparticle might have a very thin hydrophobic lipid layer with a hydrophilic core leading to a higher hydrophilic drug loading in the core and a lower hydrophobic drug loading in the lipid layer. In this current study, we further wanted to understand the localization of the encapsulated drugs inside the vitamin D3 nanoparticles. We performed a steady-state fluorescence anisotropy study that provides insight into the surrounding environment of proflavine and doxorubicin inside the nanoparticles. A high anisotropy value implies that the drug molecules experience a restricted environment. The mean fluorescence anisotropy of vitD3–PI103–proflavine-NP was found to be equal to 0.012 ± 0.0003, compared to the anisotropy of free proflavine, which is equal to 0.006 ± 0.0003 (Fig. S7 in ESI). However, vitD3–PI103–Dox-NP showed a mean anisotropy value of 0.148 ± 0.009, compared to the mean anisotropy of 0.053 ± 0.003 shown by free doxorubicin in water. These changes in steady-state fluorescent anisotropy values indicate that proflavine accumulated into the hydrophilic core of the nanoparticle leading to marginal change in anisotropy value, whereas doxorubicin enters into the more hydrophobic lipid layer leading to the significant 2.8 fold increase in anisotropy value.53,54

3.3 Release of dual drugs from vitamin D3 nanoparticles

We evaluated the release profiles of different drugs from the dual drug loaded vitamin D3 nanoparticles because the nanoparticles should release the dual drugs in a slow and sustained manner over a long period of time to be successful in the clinics. The nanoparticles were designed to be administered through intravenous injection into the blood stream to accumulate into tumor tissue through the EPR effect. Once inside the tumor tissues, the nanoparticles should be internalized into the cells through the lysosomal compartments. We incubated different drug loaded nanoparticles in pH = 5.5 solution at 37 °C in 1000 Dalton MWCO dialysis membrane. We selected the solution of pH = 5.5 because it mimicked the acidic lysosomal compartments inside the cells.55,56 We quantified the amount of released drugs in predetermined time points outside the dialysis bags using concentration versus absorbance graphs (Fig. S1 and S2 in ESI) by UV-vis spectroscopy at different characteristics λmax values for different drugs. The vitD3–PI103–CDDP-NP showed a slow and sustained release profile for 72 h, having released 79.22% ± 2.6% of cisplatin at 23 h and 78.83% ± 8.4% of PI103 in 47 h (Fig. 3a). However, vitD3–PI103–proflavine-NP released 86.15% ± 4.0% of proflavine at 48 h and 72.87% ± 2.1% of PI103 at 96 h (Fig. 3b). Finally, vitD3–PI103–Dox-NP demonstrated 47.05% ± 3.4% release of doxorubicin at 72 h and 91.55% ± 2.8% of PI103 release at 11 h (mean ± SEM, n = 3) (Fig. 3c). To mimic the blood stream, we also incubated the dual drug loaded nanoparticles in physiological pH of 7.4 at 37 °C and quantified the dual drug release. The vitD3–PI103–CDDP-NP released 41.8% ± 4.8% of cisplatin at 47 h and 61.4% ± 5.9% of PI103 at 25 h (Fig. 3a). However, vitD3–PI103–Dox-NP showed 48.8% ± 3% PI103 and 35.2% ± 1.9% doxorubicin release over 72 h (Fig. 3b). Finally, vitD3–PI103–proflavine-NP released 45.0% ± 3.1% of proflavine at 96 h and 48.1% ± 6% of PI103 at 72 h (Fig. 3c). We rationalized that the phenolic ester linkage in vitD3–PI103 conjugate (2) is more labile at pH = 5.5 compared to pH = 7.4, which triggered the enhanced release of PI103 at the acidic pH.
image file: c4ra06475e-f3.tif
Fig. 3 Release profile of different dual drugs from nanoparticles at pH = 5.5 and 7.4. (a) Release of cisplatin and PI103 from vitD3–PI103–CDDP-NP over 72 h. (b) Release of proflavine and PI103 from vitD3–PI103–proflavine-NP over 96 h. (c) Release of PI103 and doxorubicin from vitD3–PI103–Dox-NP over 72 h.

From these release kinetics experiments it was clear that higher amount of dual drugs were released from the nanoparticles in acidic pH compared to physiological pH in a slow and sustained manner over 72–96 h which would be advantageous for in vivo intravenous drug administration. This slow and sustained release of dual drugs in lysosomal compartment (pH = 5.5) could also lead to prolonged cytotoxicity effects of these nanoparticles in cancer cells and delay the mechanism to evolve drug resistance.

3.4 Stability of the vitamin D3 nanoparticles

To be successful in the clinics, the dual drug nanoparticles should be stable inside the blood circulatory system at 37 °C to reach the tumor by EPR effect. We evaluated the stability of the different dual drug loaded vitamin D3 nanoparticles by measuring their change in hydrodynamic diameter and PDI values over 15 days by incubating them at 37 °C. The size of the vitD3–PI103–CDDP-NP changed from 173.66 ± 0.5 nm to 166.40 ± 1.5 nm with change in PDI from 0.105 ± 0.011 to 0.156 ± 0.011 over 15 days (Fig. 4). However, vitD3–PI103–Dox-NP showed a change in size from 172.36 ± 1.1 nm to 163.83 ± 0.5 nm with change in PDI from 0.132 ± 0.014 to 0.180 ± 0.015 over 15 days. vitD3–PI103–proflavine-NP demonstrated a higher change in size from 170.20 ± 2.2 nm to 230.73 ± 7.14 with a significant change in PDI from 0.057 ± 0.012 to 0.389 ± 0.056 over 15 days. From this stability data, it is clear that vitD3–PI103–CDDP-NP and vitD3–PI103–Dox-NP are stable over 15 days at 37 °C. However, vitD3–PI103–proflavine-NP showed aggregation over 15 days.
image file: c4ra06475e-f4.tif
Fig. 4 Stability of different dual drug loaded vitamin D3 nanoparticles at 37 °C over 15 days. (a) Change in hydrodynamic diameter of different vitamin D3 nanoparticles. (b) Change in PDI values of different vitamin D3 nanoparticles.

Furthermore, we wanted to evaluate the stability of the dual drug loaded nanoparticles in the blood stream after intravenous injection. We incubated different dual drug loaded vitamin D3 nanoparticles in serum at 37 °C for 7 days and evaluated the hydrodynamic diameter and PDI values by DLS every alternate day. VitD3–PI103–CDDP-NP showed an increase in size from 181.9 ± 2.2 nm to 284.2 ± 17.9 nm (change in PDI = 0.45 to 0.92) over 7 days (Fig. S8 in ESI). Moreover, vitD3–PI103–Dox-NP showed an increase in size from 80.5 ± 1.3 nm to 262.0 ± 18.8 nm (change in PDI = 0.5 to 0.75) over 7 days. Finally, vitD3–PI103–proflavine-NP demonstrated negligible change in size from 91.7 ± 0.7 nm to 79.6 ± 1.8 nm (change in PDI = 0.5 to 0.6) over 7 days. From this stability study it was clear that vitD3–PI103–CDDP-NP and vitD3–PI103–Dox-NP were stable in serum for 5 days and vitD3–PI103–proflavine-NP was stable for 7 days, which was sufficient to allow the entry into the tumor by the EPR effect.

To apply these dual drug loaded vitamin D3 nanoparticles in clinics, the nanoparticles should also be stable for a longer time at lower temperature storage conditions. We also evaluated the stability of these nanoparticles at 4 °C. The size of the vitD3–PI103–CDDP-NP slightly increased from 173.60 ± 0.3 nm to 196.26 ± 0.7 nm with an increase in PDI value from 0.108 ± 0.008 to 0.166 ± 0.012 over 15 days (Fig. S9 in ESI). However, vitD3–PI103–Dox-NP showed negligible increase in size from 162.00 ± 1.7 nm (PDI = 0.105 ± 0.024) to 167.66 ± 0.6 nm (PDI = 0.116 ± 0.026) over 15 days. Finally, the size of the vitD3–PI103–proflavine-NP also increased from 143.00 ± 1.1 nm to 153.33 ± 0.8 nm with an increment in PDI value from 0.135 ± 0.007 to 0.198 ± 0.009 over 15 days. From the stability data at 4 °C, it was evident that all different dual drug loaded nanoparticles showed a steady increment in size and PDI values over 15 days, however, having sub 200 nm hydrodynamic diameter, which is ideal for extravasation into the tumor through the EPR effect. All the data were determined as mean ± SEM, n = 3.

3.5 In vitro cytotoxicity assay

We evaluated the in vitro cytotoxicity assay of our dual drug loaded vitamin D3 nanoparticles in human hepatocellular carcinoma cells-Hep3B. The cytotoxicity was quantified by MTT assay after 24 h post-incubation with the dual drug containing nanoparticles and free drugs as control. The vitD3–PI103–CDDP-NP showed considerably lower IC50 = 28.05 μM (cell viability = 13.1% at 80 μM cisplatin concentration) or more cytotoxicity compared to IC50 = 49.08 μM (cell viability = 34.7% at 80 μM) for free cisplatin (Fig. 5a). Similarly, vitD3–PI103–Dox-NP demonstrated IC50 = 6.9 μM (cell viability = 3.8% at 80 μM doxorubicin concentration) compared to free doxorubicin showing IC50 = 18.4 μM (cell viability = 15.5% at 80 μM) (Fig. 5b). Finally, in contrast, vitD3–PI103–proflavine-NP showed higher IC50 = 30.5 μM (cell viability = 12.6% at 80 μM proflavine concentration) compared to IC50 = 10.1 μM (cell viability = 18.5% at 80 μM) for free proflavine (Fig. 5c). To fully understand the effect of dual drug loaded nanoparticles, we also evaluated the cytotoxicity effect of the monodrug loaded vitD3-NPs as controls in Hep3B cells at 24 h post-incubation. VitD3–Dox-NP showed IC50 = 87.7 μM with 42.1% cell viability at 100 μM concentration (Fig. S10a in ESI). Moreover, vitD3–CDDP-NP demonstrated IC50 = 93.7 μM with 44.5% cell viability at 100 μM (Fig. S10b in ESI). Finally, vitD3–proflavine-NP showed improved IC50 = 47.5 μM having 12.6% cell viability at 80 μM (Fig. S10c in ESI). Interestingly, vitD3–PI103-NP showed almost negligible cytotoxicity in Hep3B cells with IC50 = 156.2 μM (Fig. S13a in ESI). Evidently, empty vitD3-NP showed almost negligible cytotoxicity (cell viability = 76.8%) even at 100 μM concentration (Fig. S10d in ESI). From this cell viability assay it was clear that different dual drug loaded vitamin D3 nanoparticles induced dose dependent cytotoxicity better than the single drug treatment in Hep3B cells. Proflavine was, however, an exception.
image file: c4ra06475e-f5.tif
Fig. 5 (a–c) In vitro cell viability assay of vitD3–PI103–CDDP-NP, vitD3–PI103–Dox-NP and vitD3–PI103–proflavine-NP, respectively, in Hep3B cells at 24 h post-incubation by MTT assay.

To evaluate the potential of the dual drug loaded nanoparticles to overcome the drug resistance, we developed cisplatin resistant Hep3B-R cells from Hep3B cells. We induced the cisplatin resistance in Hep3B cells by exposing them with a very high dose (1 mM) of cisplatin, recovering the small population of live cells and repeating the cisplatin treatment in several cycles till the cells become comparatively cisplatin resistant (Fig. S11 in ESI). We further evaluated the effect of dual drug loaded vitamin D3 nanoparticles in Hep3B-R cells by MTT assay. Interestingly, vitD3–PI103–CDDP-NP showed considerably lower IC50 = 36.3 μM with 24.0% viable cells (at 80 μM concentration of cisplatin) compared to IC50 = 70 μM with 63.1% viable cells (at 80 μM) for free cisplatin treatment in resistant cells (Fig. 6a). Similarly, vitD3–PI103–Dox-NP also showed considerably lower IC50 = 9.76 μM having 12.8% of viable cells (at 80 μM concentration of doxorubicin) compared to IC50 = 29.51 μM with 13.9% of viable cells for free doxorubicin (at 80 μM) (Fig. 6b). Finally, vitD3–PI103–proflavine-NP showed IC50 = 19.14 μM having 8.7% viable cells (at 80 μM proflavine concentration) compared to IC50 = 11.27 μM for free proflavine having 2.5% viable cells (at 80 μM) (Fig. 6c). We also evaluated the effect of monodrug loaded vitD3-NPs in Hep3B-R cells at 24 h post-incubation. VitD3–Dox-NP induced 42.6% cell viability at 100 μM with IC50 = 86.4 μM (Fig. S12a in ESI). Moreover, vitD3–CDDP-NP showed 40.3% cell viability at 100 μM with IC50 = 79.5 μM (Fig. S12b in ESI). Finally, vitD3–proflavine-NP demonstrated 9.7% cell viability at 80 μM having IC50 = 27.4 μM (Fig. S12c in ESI). Interestingly, vitD3–PI103-NP showed almost negligible cytotoxicity in Hep3B-R cell with IC50 = 93.9 μM (Fig. S13b in ESI). Empty vitD3-NP showed negligible cytotoxicity in Hep3B-R cells with 80.3% cell viability even at 100 μM concentration (Fig. S12d in ESI). From these MTT assays, it was evident that the dual drug loaded vitamin D3 nanoparticles induced considerably higher cytotoxicity in human hepatocellular carcinoma cells Hep3B and cisplatin resistant Hep3B-R cells compared to the monotherapy.


image file: c4ra06475e-f6.tif
Fig. 6 (a–c) In vitro cell viability assay of vitD3–PI103–CDDP-NP, vitD3–PI103–Dox-NP and vitD3–PI103–proflavine-NP, respectively, in Hep3B-R cells at 24 h post-incubation by MTT assay.

To understand the cytotoxicity of the dual drug loaded nanoparticles in Hep3B and Hep3B-R cells, we used the Chou-Talalay method57 to determine whether the drug combination effect was synergistic, additive or antagonistic. In Hep3B cells, vitD3–PI103–CDDP-NP and vitD3–PI103–Dox-NP showed combination index (CI) values that varied from 0.17 to 0.31, which clearly indicated the strong synergistic effect. However, vitD3–PI103–proflavine-NP showed CI value variation from 0.62 to 1.02, which showed slight synergy to nearly additive effect (Fig. S14 in ESI).

Similarly, in Hep3B-R cells, vitD3–PI103–CDDP-NP and vitD3–PI103–Dox-NP showed strong synergy (CI = 0.15 to 5.0), in contrast to vitD3–PI103–proflavine-NP, which showed weak synergy to nearly additive effect (CI = 0.60 to 0.92) (Fig. S15 in ESI). From this Chou-Talalay analysis, it was clear that the combination of PI103 with CDDP or doxorubicin showed strong synergistic effect both in Hep3B and Hep3B-R cells. However, the combination of PI103 with proflavine showed weak synergy to almost additive effect in both the hepatocellular carcinoma cell lines.

Moreover, we also evaluated the cytotoxicity of vitD3–PI103–CDDP-NP by WST-1 assay based on the enzymatic cleavage of the tetrazolium salt WST-1 to formazan by cellular mitochondrial dehydrogenase present in viable cells.58 VitD3–PI103–CDDP-NP showed IC50 = 32.2 μM with 13.1% cell viability at 100 μM concentration, whereas vitD3–CDDP-NP and free CDDP showed IC50 = 104.1 μM (with 52% cell viability at 100 μM) and IC50 = 50 μM (with 16.8% cell viability at 100 μM), respectively (Fig. S16 in ESI). Empty vitD3-NP showed almost negligible cytotoxicity in Hep3B cells with 76.4% cell viability at 100 μM. Similarly, we also evaluated the cytotoxicity of vitD3–PI103–CDDP-NP by WST-1 assay in Hep3B-R cells at 24 h post-incubation. In Hep3B-R cells vitD3–PI103–CDDP-NP demonstrated 24.4% cell viability at 100 μM concentration with IC50 = 44.8 μM (Fig. S17 in ESI). Moreover, vitD3–CDDP-NP and free CDDP showed considerably less cytotoxicity having 37.6% (IC50 = 82.2 μM) and 31.1% (IC50 = 72.8 μM) cell viability, respectively, at 100 μM (Fig. S17 in ESI). Empty vitD3-NP showed marginal cytotoxicity with 77.8% cell viability at 100 μM. These WST-1 assays supported the data of vitD3–PI103–CDDP-NP observed by MTT assay.

We further evaluated the cytotoxicity effect of vitD3–PI103–CDDP-NP using trypan blue assay to determine the number of viable cells after the treatments. In Hep3B cells, vitD3–PI103–CDDP-NP significantly reduced the number of viable cells to 1.1 × 10⁴ compared to the number of viable cells in no treatment control = 4.5 × 10⁴, vitD3-NP = 3.7 × 10⁴, vitD3–CDDP-NP = 1.4 × 10⁴ and free CDDP = 1.2 × 10⁴ (Fig. S18a in ESI). Similarly, in Hep3B-R cells, vitD3–PI103–CDDP-NP reduced the number of viable cells to 0.9 × 10⁴ compared to the number of viable cells in the control = 3.8 × 10⁴, vitD3-NP = 3.1 × 10⁴, vitD3–CDDP-NP = 1.3 × 10⁴ and free CDDP = 2.8 × 10⁴ (Fig. S18b in ESI). This trypan blue assay also validated the cytotoxicity effect of vitD3–PI103–CDDP-NP in Hep3B and Hep3B-R cells.

We also evaluated the potential of vitD3–PI103–CDDP-NP in a 5-fluorouracil (5-FU) resistant Hep3B cells because 5-FU has been widely used to treat the different types of cancers. However, overcoming 5-FU resistance remained one of the major obstacles in clinics.59 We treated 5-FU resistant Hep3B cells (Hep3B–5FU-R) with vitD3–PI103–CDDP-NP in a dose dependent manner and evaluated the cell viability at 24 h post-incubation. Interestingly, vitD3–PI103–CDDP-NP showed considerably less IC50 = 37.9 μM (Fig. S19 in ESI) compared to IC50 = 70 μM for free 5-FU (data not shown). This cell viability assay demonstrated that our dual drug loaded vitamin D3 nanoparticles can also be successfully used to overcome 5-FU resistance in cancer chemotherapy. These results can have a significant impact in the treatment of drug resistance in cancer.

3.6 Mechanism of action

To gain the insight into the cellular response evoked by vitD3–PI103–CDDP-NP and vitD3–PI103–Dox-NP, we monitored and quantified the poly (ADP-ribose) polymerase (PARP) as a marker for the DNA damage repair mechanism60 by western blot analysis in Hep3B cells after 24 h post-incubation. On treatment with vitD3–PI103–CDDP-NP and vitD3–PI103–Dox-NP, the cleaved PARP expression (carboxy-terminal catalytic domain having a molecular weight of 89 kDa) was significantly increased compared to that without treatment and 5-fluorouracil (5-FU, a positive control) treatment (Fig. 7), which was evident from the SDS-PAGE image by immunoblotting and quantification. However, vitD3–PI103–CDDP-NP and vitD3–PI103–Dox-NP showed increased cleaved PARP expression similar to the treatments with free CDDP and free doxorubicin, respectively. This western blot analysis clearly showed that the dual drug loaded vitD3-NPs induced cytotoxicity by DNA damage.
image file: c4ra06475e-f7.tif
Fig. 7 Western blot analysis of vitD3–PI103–CDDP-NP and vitD3–PI103–Dox-NP treatments in Hep3B cells to show cleaved PARP expression with β-actin as control.

Furthermore, we evaluated the mechanism of the action of the dual drug loaded NPs in inducing apoptosis. A colorimetric protease assay was performed to quantify the amount of caspase-3 as a marker of apoptosis61 after 24 h of post-incubation with vitD3–PI103–CDDP-NP and vitD3–PI103–Dox-NP. VitD3–PI103–CDDP-NP showed 1.6 fold and 1.3 fold increase of caspase-3 activity in Hep3B and Hep3B-R cells, respectively, with respect to un-treated controls (Fig. S20a in ESI). In contrast, vitD3–PI103–Dox-NP showed 0.9 fold and 1.1 fold increase in caspase-3 expression in Hep3B and Hep3B-R cells, respectively (Fig. S20b in ESI). This caspase-3 assay clearly demonstrated that vitD3–PI103–CDDP-NP and vitD3–PI103–Dox-NP showed cytotoxic effects by inducing apoptosis in both Hep3B and Hep3B-R cells.

3.7 Internalization of vitD3–PI103–proflavine-NP

To visualize the internalization of the dual drug loaded vitamin D3-NPs, we treated both Hep3B and Hep3B-R cells with green fluorescent vitD3–PI103–proflavine-NP and imaged the cells using fluorescence microscopy. The vitD3–PI103–proflavine-NPs were found to be rapidly internalized into the cisplatin resistant Hep3B-R cells within 3 minutes of post-incubation (Fig. 8, upper panel). However, vitD3–PI103–proflavine-NPs were considerably less internalized into the Hep3B cells within 3 minutes of post-incubation (Fig. 8, lower panel). From these epifluorescence images, it was evident that cisplatin resistant Hep3B cells rapidly internalized the vitD3–PI103–proflavine-NPs compared to the non-cisplatin resistant Hep3B cells. We anticipate that all the dual drug loaded vitamin D3-NPs were rapidly internalized into Hep3B-R cells compared to Hep3B cells leading to improved efficacy in the cisplatin resistant hepatocellular carcinoma cells compared to non-resistant cells. Interestingly, the electrical property of a cancerous cell is considerably different to that of a normal cell. Therefore, the cancer cells are found to exhibit lower electrical membrane potentials, lower electrical impedance and a complete alteration of the membrane lipid profile than their normal counterparts.62 The altered lipid profile in cancer cells leads to improved permeability. We speculate that a similar altered lipid profile is also exhibited in drug resistant cancer cells compared to the non-resistant counterpart. However, the mechanism of improved internalization in resistant cells needs further investigation. There are no existing reports about the changes in lipid profile and permeability of resistant cancer cells, and this does indicate the significant need to study the dynamics of the same. We are currently in the process of characterizing the changes in the membrane structure and dynamics between a cancerous cell and its resistant counterpart, which will enlighten the molecular mechanism for rapid internalization.
image file: c4ra06475e-f8.tif
Fig. 8 Internalization of vitD3–PI103–proflavine-NP in Hep3B-R (upper panel) and Hep3B (lower panel) cells visualized by epifluorescent microscopy at 3 minutes of post-incubation.

4. Conclusions

In this study, we have developed dual drug containing vitamin D3 nanoparticles having a size range below 200 nm, which would be ideal for tumor insertion by the EPR effect. These dual drug containing vitamin D3 nanoparticles contain phosphatidylinsositol-3-kinase (PI3K) inhibitor (PI103) in combination with different DNA damaging drugs (doxorubicin, cisplatin and proflavine). These nanoparticles showed high drug loading and increased dual drug release over 72 h at pH = 5.5 (mimics lysosomal compartments inside the cells) compared to pH = 7.4 (mimics blood stream). Moreover, these nanoparticles showed excellent stability over 2 weeks at 37 °C (body temperature), as well as at 4 °C (storage temperature). The nanoparticles showed improved efficacy in human hepatocellular carcinoma cells (Hep3B), as well as cisplatin resistant-Hep3B (Hep3B-R) cells compared to monotherapy by inducing apoptosis through a DNA damaging mechanism. Moreover, vitD3–PI103–CDDP-NP showed highly improved cytotoxicity in 5-FU resistant Hep3B–5FU-R cells compared to free 5-FU. Finally, these nanoparticles internalized into the cisplatin resistant Hep3B-R cells very quickly compared to the nonresistant Hep3B cells. In the future, in vivo efficacy of these dual drug containing nanoparticles needs to be evaluated in a cisplatin-resistant xenograft model to apply these strategies in the clinics, as well as to overcome the drug resistant mechanism by the rational combination of drugs.

Acknowledgements

We sincerely thank IISER-Pune, DBT (Ramalingaswami Fellowship) and SERB (Fast Track Scheme for Young Scientist) for financial support. We thank Dr Shouvik Datta for FE-SEM images. We thank Department of Science and Technology (DST) Nanoscience unit for providing the AFM facility. We also thank Dr Partha Hazra for helpful discussions on steady state fluorescent anisotropy experiments and analysis. S. P. thanks CSIR-UGC for providing the doctoral fellowship. J. N. would like to thank Department of Science and Technology (DST-INSPIRE), India, for providing a research fellowship. R. C. thanks Science and Engineering Research Board (SERB), India, for providing financial support for research, and BITS-Pilani, Rajasthan, for providing all the infrastructural facilities.

Notes and references

  1. Cancer Facts and Figures 2013, American Cancer Society, http://www.cancer.org/research/cancerfactsfigures/cancerfactsfigures/cancer-facts-figures-2013.
  2. Z. A. Knight, H. Lin and K. M. Shokat, Nat. Rev. Cancer, 2010, 10, 130–137 CrossRef CAS PubMed.
  3. C. Holohan, S. V. Schaeybroeck, D. B. Longley and P. G. Johnston, Nat. Rev. Cancer, 2013, 13, 714–726 CrossRef CAS PubMed.
  4. B. Al-Lazikani, U. Banerji and P. Workman, Nat. Biotechnol., 2012, 30, 679–692 CrossRef CAS PubMed.
  5. D. Peer, J. M. Karp, S. Hong, O. C. Farokhzad, R. Margalit and R. Langer, Nat. Nanotechnol., 2007, 2, 751–760 CrossRef CAS PubMed.
  6. Y. Matsumura and H. Maeda, Cancer Res., 1986, 46, 6387–6392 CAS.
  7. E. Ruoslahti, S. N. Bhatia and M. J. Sailor, J. Cell Biol., 2010, 188, 759–768 CrossRef CAS PubMed.
  8. P. Couvreur and C. Vauthier, Pharm. Res., 2006, 23, 1417–1450 CrossRef CAS PubMed.
  9. F. Yuan, M. Dellian, D. Fukumara, M. Leunig, D. A. Berk, V. P. Torchilin and R. K. Jain, Cancer Res., 1995, 55, 3752–3756 CAS.
  10. V. P. Torchilin, Nat. Rev. Drug Discovery, 2005, 4, 145–160 CrossRef CAS PubMed.
  11. S. K. Hobbs, W. L. Monsky, F. Yuan, W. G. Roberts, L. Griffith, V. P. Torchilin and R. K. Jain, Proc. Natl. Acad. Sci. U. S. A., 1998, 95, 4607–4612 CrossRef CAS.
  12. N. Kolishettia, S. Dhar, P. M. Valencia, L. Q. Lin, R. Karnik, S. J. Lippard, R. Langer and O. C. Farokhzad, Proc. Natl. Acad. Sci. U. S. A., 2010, 107, 17939–17944 CrossRef PubMed.
  13. H. Wang, Y. Zhao, Y. Wu, Y. Hu, K. Nan, N. Nie and H. Chen, Biomaterials, 2011, 32, 8281–8290 CrossRef CAS PubMed.
  14. L. Liao, J. Liu, E. C. Dreaden, S. W. Morton, K. E. Shopsowitz, P. T. Hammond and J. A. Johnson, J. Am. Chem. Soc., 2014, 136, 5896–5899 CrossRef CAS PubMed.
  15. J. A. MacDiarmid, N. B. Amaro-Mugridge, J. Madrid-Weiss, I. Sedliarou, S. Wetzel, K. Kochar, V. N. Brahmbhatt, L. Phillips, S. T. Pattison, C. Petti, B. Stillman, R. M. Graham and H. Brahmbhatt, Nat. Biotechnol., 2009, 27, 643–651 CrossRef CAS PubMed.
  16. S. Sengupta, D. Eavarone, I. Capila, G. Zhao, N. Watson, T. Kiziltepe and R. Sasisekharan, Nature, 2005, 436, 568–572 CrossRef CAS PubMed.
  17. T. Sun, J. Du, Y. Yao, C. Mao, S. Dou, S. Huang, P. Zhang, K. W. Leong, E. Song and J. Wang, ACS Nano, 2011, 5, 1483–1494 CrossRef CAS PubMed.
  18. S. Barua and S. Mitragotri, ACS Nano, 2013, 7, 9558–9570 CrossRef CAS PubMed.
  19. Z. J. Deng, S. W. Morton, E. Ben-Akiva, E. C. Dreaden, K. E. Shopsowitz and P. T. Hammond, ACS Nano, 2013, 7, 9571–9584 CrossRef CAS PubMed.
  20. L. Zhang, J. Xia, Q. Zhao, L. Liu and Z. Zhang, Small, 2010, 6, 537–544 CrossRef CAS PubMed.
  21. C. F. Chin, S. Q. Yap, J. Li, G. Pastorin and W. H. Ang, Chem. Sci., 2014, 5, 2265–2270 RSC.
  22. T. Jiang, R. Mo, A. Bellotti, J. Zhou and Z. Gu, Adv. Funct. Mater., 2014, 24, 2295–2304 CrossRef CAS.
  23. Y. Fang, G. Zheng, J. Yang, H. Tang, Y. Zhang, B. Kong, Y. Lv, C. Xu, A. M. Asiri, J. Zi, F. Zhang and D. Zhao, Angew. Chem., Int. Ed., 2014, 53, 5366–5370 CrossRef CAS PubMed.
  24. D. S. Kohane and R. Langer, Chem. Sci., 2010, 1, 441–446 RSC.
  25. E. R. Nelson, S. E. Wardell, J. S. Jasper, S. Park, S. Suchindran, M. K. Howe, N. J. Carver, R. V. Pillai, P. M. Sullivan, V. Sondhi, M. Umetani, J. Geradts and D. P. McDonnell, Science, 2013, 342, 1094–1098 CrossRef CAS PubMed.
  26. Q. Wu, T. Ishikawa, R. Sirianni, H. Tang, J. G. McDonald, I. S. Yuhanna, B. Thompson, L. Girard, C. Mineo, R. A. Brekken, M. Umetani, D. M. Euhus, Y. Xie and P. W. Shaul, Cell Rep., 2013, 5, 637–645 CrossRef CAS PubMed.
  27. H. Zhang, G. Grüner and Y. Zhao, J. Mater. Chem. B, 2013, 1, 2542–2567 RSC.
  28. K. Yang, L. Feng, X. Shi and Z. Liu, Chem. Soc. Rev., 2013, 42, 530–547 RSC.
  29. T. Liu, L. Li, X. Teng, X. Huang, H. Liu, D. Chen, J. Ren, J. He and F. Tang, Biomaterials, 2011, 32, 1657–1668 CrossRef CAS PubMed.
  30. S. Patil, S. Gawali, S. Patil and S. Basu, J. Mater. Chem. B, 2013, 1, 5742–5750 RSC.
  31. A. Rossi, M. D. Maio, P. Chiodini, R. M. Rudd, H. Okamoto, D. V. Skarlos, M. Früh, W. Qian, T. Tamura, E. Samantas, T. Shibata, F. Perrone, C. Gallo, C. Gridelli, O. Martelli and S.-M. Lee, J. Clin. Oncol., 2012, 30, 1692–1698 CrossRef CAS PubMed.
  32. A. Lorch, A. Kleinhans, A. Kramar, C. K. Kollmannsberger, J. T. Hartmann, C. Bokemeyer, O. Rick and J. Beyer, J. Clin. Oncol., 2012, 30, 800–805 CrossRef CAS PubMed.
  33. L. Staudacher, P. H. Cottu, V. Diéras, A. Vincent-Salomon, M. N. Guilhaume, L. Escalup, T. Dorval, P. Beuzeboc, L. Mignot and J. Y. Pierga, Ann. Oncol., 2011, 22, 848–856 CrossRef CAS PubMed.
  34. P. D. Sánchez-González, F. J. López-Hernández, J. M. López-Novoa and A. I. Morales, Crit. Rev. Toxicol., 2011, 41, 803–821 CrossRef PubMed.
  35. X. Yao, K. Panichpisal, N. Kurtzman and K. Nugent, Am. J. Med. Sci., 2007, 334, 115–124 CrossRef PubMed.
  36. Z. H. Siddik, Oncogene, 2003, 22, 7265–7279 CrossRef CAS PubMed.
  37. L. Galluzzi, L. Senovilla, I. Vitale, J. Michels, I. Martins, O. Kepp, M. Castedo and G. Kroemer, Oncogene, 2012, 31, 1869–1883 CrossRef CAS PubMed.
  38. L. L. Belyanskaya, S. Hopkins-Donaldson, S. Kurtz, A. P. Simões-Wüst, S. Yousefi, H. U. Simon, R. Stahel and U. Zangemeister-Wittke, Int. J. Cancer, 2005, 117, 755–763 CrossRef CAS PubMed.
  39. S. Guo, H. Lopez-Marquez, K. C. Fan, E. Choy, G. Cote, D. Harmon, G. P. Nielsen, C. Yang, C. Zhang, H. Mankin, F. J. Hornicek, D. R. Borger and Z. Duan, PLoS One, 2014, 9, e93996 Search PubMed.
  40. J. A. Engelman, Nat. Rev. Cancer, 2009, 9, 550–562 CrossRef CAS PubMed.
  41. D. M. Sabatini, Nat. Rev. Cancer, 2006, 6, 729–734 CrossRef CAS PubMed.
  42. X. Wan, B. Harkavy, N. Shen, P. Grohar and L. J. Helman, Oncogene, 2007, 26, 1932–1940 CrossRef CAS PubMed.
  43. Q. W. Fan, Z. A. Knight, D. D. Goldenberg, W. Yu, K. E. Mostov, D. Stokoe, K. M. Shokat and W. A. Weiss, Cancer Cell, 2006, 9, 341–349 CrossRef CAS PubMed.
  44. P. Workman, P. A. Clarke, F. I. Raynaud and R. L. van Montfort, Cancer Res., 2010, 70, 2146–2157 CrossRef CAS PubMed.
  45. M. A. Westhoff, J. A. Kandenwein, S. Karl, S. H. Vellanki, V. Braun, A. Eramo, G. Antoniadis, K. M. Debatin and S. Fulda, Oncogene, 2009, 28, 3586–3596 CrossRef CAS PubMed.
  46. F. I. Raynaud, S. Eccles, P. A. Clarke, A. Hayes, B. Nutley, S. Alix, A. Henley, F. Di-Stefano, Z. Ahmad, S. Guillard, L. M. Bjerke, L. Kelland, M. Valenti, L. Patterson, S. Gowan, A. de Haven Brandon, M. Hayakawa, H. Kaizawa, T. Koizumi, T. Ohishi, S. Patel, N. Saghir, P. Parker, M. Waterfield and P. Workman, Cancer Res., 2007, 67, 5840–5850 CrossRef CAS PubMed.
  47. M. S. Ewer and S. M. Ewer, Nat. Rev. Cardiol., 2010, 7, 564–675 CrossRef PubMed.
  48. G. Minotti, P. Menna, E. Salvatorelli, G. Cairo and L. Gianni, Pharmacol. Rev., 2004, 56, 185–229 CrossRef CAS PubMed.
  49. W. D. Sasikala and A. Mukherjee, J. Phys. Chem. B, 2012, 116, 12208–12212 CrossRef CAS PubMed.
  50. W. A. Denny, Curr. Med. Chem., 2002, 9, 1655–1665 CrossRef CAS.
  51. P. Sengupta, S. Basu, S. Soni, A. Pandey, B. Roy, M. S. Oh, K. T. Chin, A. S. Paraskar, S. Sarangi, Y. Connor, V. S. Sabbisetti, J. Kopparam, A. Kulkani, K. Muto, C. Amarasiriwardena, I. Jayawardene, N. Lupoli, D. M. Dinulescu, J. V. Bonventre, R. A. Mashelkar and S. Sengupta, Proc. Natl. Acad. Sci. U. S. A., 2012, 109, 11294–11299 CrossRef CAS PubMed.
  52. J. M. Harris and R. B. Chess, Nat. Rev. Drug Discovery, 2003, 2, 214–221 CrossRef CAS PubMed.
  53. J. R. Lackowicz, Principles of Fluorescence Spectroscopy, Springer Science, New York, USA, 3rd edn, 2006 Search PubMed.
  54. T. G. Burke and T. R. Tritton, Biochemistry, 1985, 24, 1768–1776 CrossRef CAS.
  55. Y. Urano, D. Asanuma, Y. Hama, Y. Koyama, T. Barrett, M. Kamiya, T. Nagano, T. Watanabe, A. Hasegawa, P. L. Choyke and H. Kobayashi, Nat. Med., 2009, 15, 104–109 CrossRef CAS PubMed.
  56. J. Gilleron, W. Querbes, A. Zeigerer, A. Borodovsky, G. Marsico, U. Schubert, K. Manygoats, S. Seifert, C. Andree, M. Stöter, H. Epstein-Barash, L. Zhang, V. Koteliansky, K. Fitzgerald, E. Fava, M. Bickle, Y. Kalaidzidis, A. Akinc, M. Maier and M. Zerial, Nat. Biotechnol., 2013, 31, 638–646 CrossRef CAS PubMed.
  57. T.-C. Chou, Cancer Res., 2010, 70, 440–446 CrossRef CAS PubMed.
  58. A. Guertler, A. Kraemer, U. Roessler, S. Hornhardt, U. Kulka, S. Moertl, A. A. Friedl, T. Illig, E. Wichmann and M. Gomolka, Radiat. Prot. Dosim., 2011, 143, 487–490 CrossRef CAS PubMed.
  59. D. B. Longley, D. P. Harkin and P. G. Johnston, Nat. Rev. Cancer, 2003, 3, 330–338 CrossRef CAS PubMed.
  60. P. Bounman and J. Jonkers, Nat. Rev. Cancer, 2012, 12, 587–598 CrossRef PubMed.
  61. A. G. Porter and R. U. Jänicke, Cell Death Differ., 1999, 6, 99–104 CAS.
  62. C. D. Cone, Ann. N. Y. Acad. Sci., 1975, 238, 420–435 CrossRef PubMed.

Footnotes

Electronic supplementary information (ESI) available: Further characterization data are available. See DOI: 10.1039/c4ra06475e
These authors contributed equally to this work.

This journal is © The Royal Society of Chemistry 2014