Systematic investigation on charge storage behaviour of multidimensional poly(3,4-ethylenedioxythiophene) nanostructures

Ji Eun Lee b, Seon Joo Parkc, Oh Seok Kwond, Hyeon Woo Shimb, Jyongsik Jangc and Hyeonseok Yoon*ab
aAlan G. MacDiarmid Energy Research Institute, School of Polymer Science and Engineering, Chonnam National University, 77 Yongbong-ro, Buk-gu, Gwangju 500-757, South Korea. E-mail: hyoon@chonnam.ac.kr; Fax: +82-62-530-1779; Tel: +82-62-530-1778
bDepartment of Polymer Engineering, Graduate School, Chonnam National University, 77 Yongbong-ro, Buk-gu, Gwangju 500-757, South Korea
cSchool of Chemical and Biological Engineering, Seoul National University, Seoul 151-742, South Korea
dDepartment of Chemical and Environmental Engineering, School of Engineering and Applied Science, Yale University, New Haven, Connecticut 06511, USA

Received 24th June 2014 , Accepted 5th August 2014

First published on 6th August 2014


Abstract

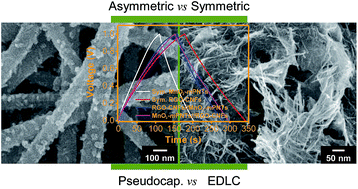
We provide in-depth insight into the electrochemical capacitive behaviour of multidimensional poly(3,4-ethylenedioxythiophene) (PEDOT) nanotubes (mPNTs) with unique surface substructures, such as nanonodules and nanorods (NR). NRs–mPNT had a capacitance of 153 F g−1 in acidic electrolyte, which corresponded to 73% of the theoretical maximum capacitance (210 F g−1). Moreover, they showed a 17% increase in specific capacitance when coupled to another pseudocapacitive component, namely, manganese dioxide (MnO2). MnO2mPNTs were further tested in both symmetric and asymmetric cell configurations without using binders or conductive fillers, where reduced graphene oxide (RGO)–carbon nanofibers (CNFs) were employed as an electric double layer electrode material. The asymmetric MnO2mPNTs (+)//RGO–CNFs (−) cell exhibited better performances than other asymmetric or symmetric cells of the MnO2mPNTs/RGO–CNFs combination in terms of specific capacitance, cycling stability, and coulombic efficiency. At the same weight, the energy capacity of MnO2mPNTs was similar to that of RGO–CNFs. The capacitive performance of asymmetric cells depended on the weight ratio of MnO2mPNTs//RGO–CNFs. The optimized weight ratio of MnO2mPNTs to RGO–CNFs in an asymmetric cell was 1[thin space (1/6-em)]:[thin space (1/6-em)]1. In terms of conductivity, chemical stability and solubility, PEDOT has superior advantages over other conducting polymers. It is expected that further optimization of electrode materials and cell systems will lead to the development of high-performance PEDOT-based electrochemical capacitors.

Introduction

Owing to their high power capability and long cycle life, electrochemical capacitors are attracting much interest as competitive energy storage devices.1 There have been many efforts to improve the performance of electrochemical capacitors from materials and device perspectives.2 Two different charge storage mechanisms, which depend on the nature of electrode materials, have been identified for electric double-layer (EDL) capacitors and pseudocapacitors, respectively.3 Carbon materials, such as carbon nanotubes and graphene, are currently the most popular materials for enhancing the performance of EDL capacitors.4 For example, the intrinsic capacitance of single-layer graphene was found to be ca. 21 μF cm−2, which suggests that graphene can theoretically provide a capacitance as high as ca. 550 F g−1.5 On the other hand, transition metal oxides and conducting polymers are involved in surface redox reactions that lead to pseudocapacitance.6,7 Pseudocapacitance commonly exceeds the EDL capacitance of carbon-based materials. Metal oxides such as ruthenium oxide, nickel oxide, and manganese oxide have been studied due to their high energy densities and fast redox reactions.6 However, these metal oxides suffer from poor conductivity, which hinders their practical applications in energy storage devices. For example, the conductivity of MnO2 is as low as 10−5 to 10−6 S cm−1.6 To overcome this conductivity issue, the metal oxides have been combined with conductive materials such as noble metals, carbon, and conducting polymers. Conducting polymers, including polypyrrole and polyaniline, have been also used as active electrode materials.7 Although conducting polymers have shown many promising results in electrode applications, their morphology and physical properties are still difficult to control at the nanoscale to enhance electrode performance.8

Nanostructural evolution of materials has driven paradigm shifts in device technology. EDL capacitors can be developed by using nanoporous electrode materials.9 Using electrode materials with larger surface areas, EDL capacitors exhibit at least two orders of magnitude greater energy density than conventional electrolytic capacitors. Compared with batteries, nonetheless, EDL capacitors exhibit limited energy density, although higher power density and longer cycle life. Thus, EDL capacitors have been recognized as an auxiliary power source bridging the gap between conventional capacitors and batteries in various device systems. Like batteries, pseudocapacitors take advantage of the redox reaction between the electrode material and the electrolyte to store charge. However, the energy outputs of pseudocapacitors are not on the same level as those of batteries. Hence, there is an increasing demand for new electrode materials or storage devices that can deliver both desirable power and energy densities.

Poly(3,4-ethylenedioxythiophene) (PEDOT) is one of the most promising conductive polymers used in various fields including energy storage/conversion.10 Herein, we investigate the charge storage behavior of poly(3,4-ethylenedioxythiophene) (PEDOT) nanotubes with unique surface substructures, namely, multidimensional PEDOT nanostructures. The morphology of the PEDOT exhibits a nanometer-scale hierarchical structure, which provides a larger effective surface area and efficient charge transfer. Specifically, one-dimensional PEDOT nanotubes have vertically grown surface substructures that can act like tentacles to harvest more charges from the electrolyte. To further enhance the charge storage characteristics of the PEDOT nanotubes, manganese dioxide (MnO2) nanolayers were introduced on PEDOT nanotubes by simply treating them with a manganese precursor, which allows additional pseudo-faradaic contribution. Reduced graphene oxide (RGO)–carbon nanofibers (CNFs) were also employed as another electrode material to examine the effect of the kind and content of an electrode material on the cell capacitance. CNFs were intercalated between RGO sheets to prevent the restacking of the RGO sheets and to strengthen the nonfaradaic charge storage. Importantly, these studies offer in-depth insight into the charge storage behavior of PEDOT nanostructures.

Experimental

Materials

Poly(methyl methacrylate) (PMMA, Mw = 350[thin space (1/6-em)]000), 3,4-ethylenedioxythiophene (EDOT), and potassium permanganate (KMnO4) were obtained from Aldrich. Dimethylformamide (DMF, Aldrich) was used as a solvent for PMMA. Polylacrylonitrile (PAN, Mw = 150[thin space (1/6-em)]000) and polyvinylpyrrolidone (PVP, Mw = 1[thin space (1/6-em)]300[thin space (1/6-em)]000) were purchased from Aldrich. DMF (Aldrich) was used as a solvent for PAN and PVP. Graphite flakes were also obtained from Aldrich. Poly(vinylidene fluoride) (PVDF) was used as the binder to fabricate electrodes for a three-electrode configuration.

Multidimensional PEDOT nanotubes (mPNTs)

First, NRs– and NNs–mPNTs were obtained by a previously reported method.11 Briefly, 1 g of PMMA was dissolved in DMF at 70–80 °C. Then, the PMMA/DMF solution was electrospun at a flow rate of 12 μm min−1 with an applied voltage of 15 kV. The resulting nanofibers were impregnated in 40 mL FeCl3–methanol solution, and subsequent vapor-deposition polymerization of the EDOT monomer yielded multidimensional PEDOT nanofibers. mPNTs were obtained after etching the PMMA core from the nanofibers using the DMF solution. To deposit MnO2 onto the mPNTs, 0.1 g of mPNTs were mixed with 1 mL of 0.01 M KMnO4 in 50 mL of water. Then the final products were washed by suction filtration using excess water. PEDOT nanotubes with a smooth surface was also fabricated as a control.

RGO–CNFs

RGO–CNFs were prepared through a partial modification of the previous method.12 First, 2.0 g of PAN was dissolved in 20 mL of DMF at 80 °C, and 2 g of PVP was dissolved in 40 mL of DMF at 50 °C. The solutions were mixed at 90 °C for 3 h with vigorous stirring. The resulting mixture was electrospun at a flow rate of 5 μL min−1 with an applied voltage of 13 kV. The obtained nanofibers were calcined at 400 °C for 2 h in air and then carbonized at 900 °C for 1 h in nitrogen atmosphere, which finally yielded CNFs. Graphene oxide (GO) was prepared from graphite powder using a modified Hummers and Offeman method and then dispersed in distilled water at the ratio of 3 mg GO per 1 mL H2O, and then 50 wt% CNFs relative to GO were introduced into the solution. After sonication and stirring for 1 h at 30 °C, the resulting mixture was exposed to 5 μL of 35 wt% hydrazine solution for 1 h at 95 °C. The final product was washed with distilled water and dried under vacuum.

Electrochemical measurements

Electrochemical experiments were conducted by using a Metrohm Autolab B.V. PGSTAT101 potentiostat/galvanostat. Cyclic voltammetry (CV) and charge/discharge tests in a three-electrode cell containing 1 M H2SO4 solution were performed using a Pt auxiliary electrode and a Ag/AgCl reference electrode. The electrode material was dissolved in NMP with carbon black (Denka Black, 5 wt%) and PVDF (5 wt%) and then coated onto stainless steel as a working electrode. Two electrode cells were built with the same acidic electrolyte, glass fiber separator and stainless steel current collectors using both symmetric and asymmetric configuration, where the electrode materials were assembled without any additional binder and conductive filler. A commercially available two-electrode test fixture was used to mimic the unit cell configuration (Fig. 1),13 and the specific mass of active electrode materials was regulated in the order of 10 mg cm−2. Discharge specific capacitance was calculated using the formula C (F g−1) = I/m × (dt/dV), where I notes discharge current, dt/dV is calculated from the slope of the discharge curve, and m is the electrode mass.
image file: c4ra06161f-f1.tif
Fig. 1 Scheme of the cross-section of a two-electrode test fixture used for examining the cell performance.

Characterization

A home-made electrode substrate was used to measure current–voltage curves of mPNTs (see Fig. S1, ESI). The morphology of MnO2mPNTs and RGO–CNFs was observed using scanning electron microscopy (SEM) and transmission electron microscopy (TEM). The specimens were coated with a thin layer of gold to eliminate charging effect, and SEM was carried out using a JEOL JSM-7500F microscope. TEM observation was performed with a JEOL EM-2000 EX II microscope. X-ray photoelectron spectroscopy (XPS) was performed using a Thermo VG Scientific Multilab 2000 spectrometer with an Mg/Al twin-anode excitation source. The specimens were pelletized and then mounted on the standard sample studs by means of double-sided adhesive tape. Peak fitting of the collected spectra was conducted with VG Avantage software supplied by the manufacturer. BET surface areas were measured through nitrogen sorption experiments using a Micromeritics ASAP2020 instrument.

Results and discussion

First, multidimensional PEDOT nanotubes with tentacle-like surface substructures were fabricated via electrospinning of sacrificial template nanofibers, followed by vapor-deposition polymerization of PEDOT.11 Two kinds of mPNTs with different surface substructures, namely nanonodules (NNs) and nanorods (NRs), were prepared (Fig. 2a) and their electrochemical properties were examined, respectively (Fig. 3). The electrical properties of the mPNTs were estimated from the current–voltage curves (Fig. 2b). The dI/dV values increased in the order control < NNs–mPNTs < NRs–mPNTs. The dI/dV value is proportional to the conductivity under the ohmic contact. Thus, it turned out that NRs–mPNTs have better electrical properties than others. The surface areas of NNs–mPNTs and NRs–mPNTs were measured to be 48 and 62 m2 g−1, higher than that (31 m2 g−1) of the control nanotubes with a smooth surface. Consequently, the mPNTs showed enlarged CV curves and higher specific capacitances. Fig. 3a presents representative CV curves recorded at a scan rate of 0.5 mV s−1. CV curves were further examined in the range of 0.1 to 1.0 mV s−1, and peak currents in the CV curves were plotted (see Fig. S2, ESI). Anodic and cathodic peak currents increased linearly with scan rate, indicating that the electrode kinetics are subject to a surface-controlled redox process. Namely, surface or near-surface redox process would be dominant in the electrode, which may be attributed to the small dimensions of the nanostructured electrode material. Fig. 3b shows representative charge/discharge curves of the nanotube samples measured at a current density of 0.1 A g−1. At the voltage range of 1.2 V, the specific capacitance increased in the order of the control (27 ± 11 F g−1) < NN–mPNTs (113 ± 13 F g−1) < NR–mPNTs (153 ± 63 F g−1), implying that the specific capacitance from the PEDOT is sensitive to the effective surface area of the electrode material. Additionally, the nanotubes with surface subnanostructures retain internanotube porous structure, which might allow facile ion and charge transfer to increase the capacitance. As a result, it is believed that higher capacitance of NRs–mPNTs stem from (i) enhanced surface controlled redox reaction, (ii) efficient ion diffusion kinetics, and (iii) good electrical property. The capacitances of the mPNTs were slightly smaller than that (175 F g−1) of vapor-phase deposited PEDOT nanostructures recently reported.14 The capacitance of the control sample was similar with that (ca. 20 F g−1) of electrospun PEDOT nanofibers reported previously.15 Unfortunately, the capacitances of the mPNTs were lower than those of other conducting polymers such as polypyrrole and polyaniline. In fact, the capacitance of PEDOT is generally lower than those of polypyrrole, polyaniline, and even polythiophene. The theoretical specific capacitance of PEDOT is 210 F g−1 while those of polypyrrole, polyaniline, and polythiophene are 620, 750, and 485 F g−1, respectively.7 It is important to note that NRs–mPNTs exhibited 73% of the theoretical maximum of PEDOT in capacitance.
image file: c4ra06161f-f2.tif
Fig. 2 mPNTs: (a) TEM images (left: NN; right; NR). (b) Current–voltage curves.

image file: c4ra06161f-f3.tif
Fig. 3 mPNTs: (a) CV curves and (b) galvanostatic charge/discharge curves recorded at 0.5 mV s−1 and 0.1 A g−1, respectively, in acidic solution (1 M H2SO4).

To further enhance the capacitance of mPNTs, another pseudocapacitive component MnO2 was conjugated with PEDOT. NRs–mPNTs were chosen as the desirable structure that might lead to high-performance PEDOT-based capacitors. MnO2 nanolayers were readily deposited on the PEDOT nanotubes by treating the nanotubes with KMnO4, a strong oxidizing agent, in an aqueous solution. The oxidation level of the PEDOT was further increased by the KMnO4, whose concurrent reduction yielded MnO2.16 The thickness of the MnO2 nanolayers was controlled by adjusting the KMnO4 concentration and reaction time (see Fig. S3 and S4, ESI). Fig. 4a and b show the SEM images of MnO2mPNTs (ca. 50 wt% MnO2 content) with an average nanotube diameter of 106 nm at the optimized condition. MnO2 formed layered nanostructures on the nanotube surface. The surface tentacle structures of the nanotubes were well preserved after the deposition of the MnO2 nanolayers, providing advantages such as high surface area and efficient charge transfer to/from electrolytes. XPS was used to qualitatively characterize the MnO2mPNTs (Fig. 4c and d). The XPS S 2p spectrum displayed two doublets, which arose from the sulfur atoms of the PEDOT in the neutral (ca. 163.3 and 164.5 eV) and the oxidized (ca. 164.3 and 165.5 eV) state, respectively. The percentage of positively charged sulfur atoms in the PEDOT chains (AOS/ANS+OS) was calculated to be 0.31, which reflects the oxidation level of the PEDOT. The XPS Mn 2p spectrum revealed Mn 2p3/2 and 2p1/2 peaks centered at 642.0 and 653.7 eV, respectively. Namely, the spin–orbit splitting was 11.7 eV, indicating that the predominant oxidation state was Mn(IV).12 A broad peak was additionally observed at 646.3 eV, which may be attributed to the permanganate ions doped in PEDOT.


image file: c4ra06161f-f4.tif
Fig. 4 MnO2mPNTs: SEM images taken at (a) low- and (b) high-magnifications. (c) S 2p and (d) Mn 2p XPS curves.

The electrochemical properties of the electrode materials were examined by CV analysis. Fig. 5a displays the CV curves of the MnO2mPNT electrodes recorded at different scan rates. Two pairs of peaks appeared on the CV curves, corresponding to the redox transitions of MnO2 and PEDOT, respectively. Such faradaic cathodic and anodic currents in the CV curves indicate that the MnO2mPNTs were electroactive. The potential window was extended to 1.6 V (from −0.6 to 1.0 V, vs. Ag/AgCl) at a scan rate of 100 mV s−1, in which the sharp increase in current at 1.0 V is attributed to the overoxidation of PEDOT. Galvanostatic charge/discharge curves were recorded at different current densities for the same electrolyte, as shown in Fig. 5b, and the calculated specific capacitances are plotted in Fig. 5c. The voltage range was 1.2 V. The charging and discharging currents on the CV curves tended to join into a tail at the high or low potential end. Thus, the exploitable voltage ranges on the charge/discharge curves became narrower than the potential ranges on the CV curves. The maximum capacitance was 179 F g−1 at a current density of 0.1 A g−1. Namely, the specific capacitance of the mPNTs increased by 17% after application of the MnO2 nanolayers.


image file: c4ra06161f-f5.tif
Fig. 5 MnO2mPNTs: (a) CV curves at different scan rates, (b) galvanostatic charge/discharge curves and (c) calculated specific capacitances at different current densities. 1 M H2SO4 was used as the electrolyte.

Owing to the limited performance of electrochemical capacitors, recent research has investigated the use of conducting polymers in hybrid systems.17 Carbon nanomaterials show high potential for hydrogen evolution, good EDL capacitive behavior, excellent cycling stability and conductivity. An EDL capacitive nanocomposite consisting of only carbon species was thus employed as a counter electrode material to the pseudocapacitive MnO2mPNTs. Specifically, RGO–CNFs were fabricated through a self-assembly process between CNFs (Fig. 6a) and RGO sheets (Fig. 6a inset),12 which are commonly used to construct hybrid systems. Fig. 6b presents the SEM image of RGO–CNFs prepared at the RGO-to-CNF weight ratio of 1[thin space (1/6-em)]:[thin space (1/6-em)]1. A three-dimensional nano-architecture with an open structure was observed, in which the CNFs were well intercalated between the RGO sheets. The intercalated CNFs with an average diameter of 49 nm prevented the restacking of the RGO sheets and facilitated the charge transfer in the nanocomposite. The unique open structure of the RGO–CNF nanohybrid had a higher surface-to-volume ratio and ion/charge transfer efficiency, which provided high nonfaradaic charge storage.


image file: c4ra06161f-f6.tif
Fig. 6 RGO–CNFs: SEM images of (a) CNFs (inset: RGO) and (b) RGO–CNFs.

RGO–CNFs generated CV curves with a stable potential window between −0.5 and 1.0 V (vs. Ag/AgCl), as shown in Fig. 7a. The CV curves were not completely rectangular in shape. A broad redox couple was observed around 0.4 V, probably due to the redox reactions of RGO functional groups. It is believed that the residual functional groups in RGO can enhance the wettability of carbon and contribute to capacitance through faradaic reactions. Fig. 7b and c display the galvanostatic charge/discharge curves of RGO–CNFs recorded at different current densities and the specific capacitances calculated from them, respectively. Except the maximum capacitance (223 F g−1) at 0.1 A g−1, the specific capacitances of RGO–CNFs were found to be slightly lower than those of MnO2mPNTs.


image file: c4ra06161f-f7.tif
Fig. 7 RGO–CNFs: (a) CV curves at different scan rates, (b) galvanostatic charge/discharge curves and (c) calculated specific capacitances at different current densities. 1 M H2SO4 was used as the electrolyte.

The two different electrode materials were assembled in symmetric and asymmetric cell structures, where a stainless cell was used with a glass-fiber separator, to systematically examine their capacitive behaviors. To exclude the effect of binders or conductive fillers, the electrode materials of 10 mm diameter and 200 μm thickness were assembled in the test cell without using any additives. The voltage ranges of the two symmetric cells consisting of MnO2mPNT electrodes and RGO–CNF electrodes, respectively, were extended up to the maximum 1.2 V and 1.1 V, respectively. The asymmetric cell with a MnO2mPNT positive electrode and a RGO–CNF negative electrode showed the maximum, exploitable voltage range of 1.2 V. However, at this maximum voltage range, there could be undesirable side reactions, such as PEDOT overoxidation. Thus, a narrower voltage range of 1.0 V was chosen as the working cell voltage range for fast switching and cycling stability in an aqueous electrolyte. Fig. 8a shows representative galvanostatic charge/discharge curves of the symmetric and asymmetric capacitor cells, where the IR drop was negligibly small in all curves. Fig. 8b displays the calculated specific capacitances of the four different capacitor cells according to current density. First, in the symmetric cells, the capacitance of RGO–CNFs//RGO–CNFs was 1.4–1.5 times higher than that of MnO2mPNTs//MnO2mPNTs, which was consistent with the result obtained from the three-electrode configuration. In the asymmetric cells, the capacitance was dependent on which materials were used for the positive electrode and negative electrode, respectively. When MnO2mPNTs were employed as the positive electrode, the asymmetric cell showed higher capacitances for all current densities. The capacitance of the asymmetric MnO2mPNTs (+)//RGO–CNFs (−) cell was almost similar with that of the symmetric RGO–CNFs//RGO–CNFs cell.


image file: c4ra06161f-f8.tif
Fig. 8 Symmetric and asymmetric cells: (a) representative charge/discharge curves measured at 0.1 A g−1 and (b) specific capacitances measured at different current densities.

Additionally, the coulombic efficiency of the asymmetric MnO2mPNTs//RGO–CNFs cell was also comparable to that of the symmetric RGO–CNFs//RGO–CNFs cell, as shown in Fig. 9a. The other asymmetric RGO–CNFs (+)//MnO2mPNTs (−) cell had the lowest coulombic efficiency, although it had higher capacitance than the symmetric MnO2–mPNTs//MnO2mPNTs cell. Fig. 9b exhibits the cycling stability of the symmetric and asymmetric cells tested over 1000 cycles. The capacitance of the symmetric cell with two MnO2mPNTs electrodes decreased by 18% after charge/discharge cycling. However, the cycling stability of a cell based on MnO2mPNTs was improved when used in the asymmetric configuration. Namely, the cycling stability (avg. 97.6% retention) of the asymmetric MnO2mPNTs//RGO–CNFs cell was comparable to that (avg. 99.1% retention) of the symmetric RGO–CNFs//RGO–CNFs cell. PEDOT can be classified as a p-type semiconductor. Moreover, when MnO2mPNTs are used for the negative electrode, side effects, such as the dissolution of Mn ions, can arise on the MnO2mPNTs. As a result, MnO2mPNTs are suitable for the positive electrode, and their capacitive performance can be increased with the aid of EDL negative electrode materials. Note that the capacitive performance may also depend on the constituents of the cell such as electrolytes.


image file: c4ra06161f-f9.tif
Fig. 9 Symmetric and asymmetric cells: (a) coulombic efficiencies calculated at different current densities and (b) long-term cycling performances.

The capacitive performances of the asymmetric cells were further examined in terms of the weight ratio of the positive/negative electrode materials. The weight ratio of the positive/negative electrode materials kept at 1.0 was changed to gain more insight about the capacitive behavior of MnO2mPNTs. Considering the following correlation between the amount of energy (E), and the capacitance (C) and the voltage (V)

E = 1/2CV2
the energy capacity of MnO2mPNTs would be similar with that of RGO–CNFs at the same weight: the lower capacitance of MnO2mPNTs is compensated by their higher voltage.

As presented in Fig. 10, the weight ratio of MnO2mPNTs to RGO–CNFs was adjusted from 5[thin space (1/6-em)]:[thin space (1/6-em)]1 to 1[thin space (1/6-em)]:[thin space (1/6-em)]5. At the weight ratio of 5[thin space (1/6-em)]:[thin space (1/6-em)]1, the capacitance of the asymmetric cell showed little change while the coulombic efficiency decreased. Upon increasing the weight of RGO–CNFs, the capacitance of the asymmetric MnO2mPNTs//RGO–CNFs cell decreased while the coulombic efficiency increased. Namely, the capacitive performances of the asymmetric cells were highly dependent on the weight ratio of MnO2mPNTs//RGO–CNFs, and the optimized weight ratio of MnO2mPNTs (+) to RGO–CNFs (−) in an asymmetric cell was found to be 1[thin space (1/6-em)]:[thin space (1/6-em)]1.


image file: c4ra06161f-f10.tif
Fig. 10 Effect of electrode weight: (a) representative charge/discharge curves measured at 0.1 A g−1, and (b) specific capacitances and (c) coulombic efficiencies measured at different current densities.

Conclusions

The capacitive behaviour of multidimensionally structured PEDOT materials was systematically explored. The unique structure of the PEDOT nanostructures led to a high specific capacitance, close to the theoretical maximum value. Subsequent MnO2 introduction to mPNTs further increased the specific capacitance. Considering the main performance parameters such as capacitance, cycling stability, and coulombic efficiency, the asymmetric cell structure with MnO2mPNTs at the positive electrode and RGO–CNFs at the negative electrode was found to be appropriate in an acidic electrolyte. The relationship between the weight ratio of positive/negative electrode materials and the electrochemical performance of the cell was examined. The optimized weight ratio of positive/negative electrode materials was 1[thin space (1/6-em)]:[thin space (1/6-em)]1. The objective of this work was to provide scientific insight into the capacitive behaviour of hierarchically nanostructured PEDOT electrodes, especially in terms of the effect of negative to positive electrode materials' weight ratio on the capacitive behaviour. Any additives were not used to improve the capacitance of the cells. It is believed that the optimization of capacitor cell design including electrolyte, separator, and binder, as well as the electrode materials will further enhance the performance of PEDOT-based electrochemical capacitors.

Acknowledgements

This research was financially supported by the Basic Science Research Program (2012R1A1A1042024) and Global Research Laboratory (2013056090) through the National Research Foundation of Korea (NRF) funded by the Ministry of Science, ICT and Future Planning.

Notes and references

  1. K. Naoi, S. Ishimoto, J. Miyamoto and W. Naoi, Energy Environ. Sci., 2012, 5, 9363 Search PubMed; S. A. Sherrill, P. Banerjee, G. W. Rubloff and S. B. Lee, Phys. Chem. Chem. Phys., 2011, 13, 20714 RSC.
  2. P. J. Hall, M. Mirzaeian, S. I. Fletcher, F. B. Sillars, A. J. R. Rennie, G. O. Shitta-Bey, G. Wilson, A. Cruden and R. Carter, Energy Environ. Sci., 2010, 3, 1238 Search PubMed; K. Fic, G. Lota, M. Meller and E. Frackowiak, Energy Environ. Sci., 2012, 5, 5842 Search PubMed; J. Shen, A. Liu, Y. Tu, G. Foo, C. Yeo, M. B. Chan-Park, R. Jiang and Y. Chen, Energy Environ. Sci., 2011, 4, 4220 Search PubMed; C. Peng, S. Zhang, D. Jewell and G. Z. Chen, Prog. Nat. Sci., 2008, 18, 777 CrossRef CAS PubMed.
  3. G. Wang, L. Zhang and J. Zhang, Chem. Soc. Rev., 2012, 41, 797 RSC; P. Simon and Y. Gogotsi, Nat. Mater., 2008, 7, 845 CrossRef CAS PubMed.
  4. Y. Sun, Q. Wu and G. Shi, Energy Environ. Sci., 2011, 4, 1113 CAS.
  5. J. Xia, F. Chen, J. Li and N. Tao, Nat. Nanotechnol., 2009, 4, 505 CrossRef CAS PubMed.
  6. S. W. Zhang and G. Z. Chen, Energy Mater., 2008, 3, 186 CrossRef CAS PubMed.
  7. G. A. Snook, P. Kao and A. S. Best, J. Power Sources, 2011, 196, 1 CrossRef CAS PubMed.
  8. J. Baxter, Z. Bian, G. Chen, D. Danielson, M. S. Dresselhaus, A. G. Fedorov, T. S. Fisher, C. W. Jones, E. Maginn, U. Kortshagen, A. Manthiram, A. Nozik, D. R. Rolison, T. Sands, L. Shi, D. Sholl and Y. Wu, Energy Environ. Sci., 2009, 2, 559 CAS.
  9. X. Zhao, B. M. Sánchez, P. J. Dobson and P. S. Grant, Nanoscale, 2011, 3, 839 RSC; S. W. Lee, B. M. Gallant, H. R. Byon, P. T. Hammond and Y. Shao-Horn, Energy Environ. Sci., 2011, 4, 1972 Search PubMed.
  10. O. S. Kwon, S. J. Park, J. S. Lee, E. Park, T. Kim, H.-W. Park, S. A. You, H. Yoon and J. Jang, Nano Lett., 2012, 12, 2797 CrossRef CAS PubMed; C.-W. Kung, Y.-H. Cheng, H.-W. Chen, R. Vittal and K.-C. Ho, J. Mater. Chem. A, 2013, 1, 10693 Search PubMed; F.-C. Tang, J. Chang, F.-C. Wu, H.-L. Cheng, S. L.-C. Hsu, J. S. Chen and W.-Y. Chou, J. Mater. Chem., 2012, 22, 22409 RSC; D. Zanuy and C. Alemán, Soft Matter, 2013, 9, 11634 RSC; J. S. Fan, W. Shao, G. Xu, X. T. Cui and X. Luo, RSC Adv., 2014, 4, 24328 RSC; B. Anothumakkool, Arun Torris A. T., S. N. Bhange, M. V. Badiger and S. Kurungot, Nanoscale, 2014, 6, 5944–5952 RSC; D. Aradilla, D. Azambuja, F. Estrany, M. T. Casas, C. A. Ferreira and C. Alemán, J. Mater. Chem., 2012, 22, 13110 RSC; T. Lindfors, Z. A. Boeva and R.-M. Latonen, RSC Adv., 2014, 4, 25279 RSC.
  11. O. S. Kwon, S. J. Park, H.-W. Park, T. Kim, M. Kang, J. Jang and H. Yoon, Chem. Mater., 2012, 24, 4088 CrossRef CAS.
  12. O. S. Kwon, T. Kim, J. S. Lee, S. J. Park, H.-W. Park, M. Kang, J. E. Lee, J. Jang and H. Yoon, Small, 2013, 9, 248 CrossRef CAS PubMed.
  13. M. D. Stoller and R. S. Ruoff, Energy Environ. Sci., 2010, 3, 1294 CAS.
  14. J. M. D'Arcy, M. F. El-Kady, P. P. Khine, L. Zhang, S. H. Lee, N. R. Davis, D. S. Liu, M. T. Yeung, S. Y. Kim, C. L. Turner, A. T. Lech, P. T. Hammond and R. B. Kaner, ACS Nano, 2014, 8, 1500 CrossRef PubMed.
  15. A. Laforgue, J. Power Sources, 2011, 196, 559 CrossRef CAS PubMed.
  16. M. Chang, T. Kim, H.-W. Park, M. Kang, E. Reichmanis and H. Yoon, ACS Appl. Mater. Interfaces, 2012, 4, 4357 CAS.
  17. J.-G. Wang, Y. Yang, Z.-H. Huang and F. Kang, J. Mater. Chem., 2012, 22, 16943 RSC.

Footnotes

Electronic supplementary information (ESI) available: Plots of the peak current vs. the scan rate, SEM images of mPNTs at different synthetic conditions, representative galvanostatic charge/discharge curves of the capacitor cells at different current densities, and so forth. See DOI: 10.1039/c4ra06161f
These authors equally contributed to this work.

This journal is © The Royal Society of Chemistry 2014
Click here to see how this site uses Cookies. View our privacy policy here.