 Open Access Article
Creative Commons Attribution 3.0 Unported Licence
Rice husk as bio-source of silica: preparation and characterization of PLA–silica bio-composites
Daniele Battegazzore*a,
Sergio Bocchini b,
Jenny Alongia and
Alberto Frachea
aDipartimento di Scienza Applicata e Tecnologia, Politecnico di Torino, sede di Alessandria, Viale Teresa Michel 5, 15121 Alessandria, Italy. E-mail: daniele.battegazzore@polito.it; Fax: +39-0131229399; Tel: +39-0131229343
bCenter for Space Human Robotics@PoliTo, Istituto Italiano di Tecnologia, Corso Trento 21, 10129 Torino, Italy
First published on 6th October 2014
Abstract
Silica powder has been extracted from rice husk employing a simple extraction procedure for preparing poly(lactic acid) bio-composites with differing filler contents (namely, 5, 10, 20 and 30 wt%). These materials have been obtained through a semi-industrial process of extrusion. The thermal, mechanical and morphological properties have been investigated. Despite a broad distribution of silica particle size, the prepared bio-composites have exhibited improved storage modulus and reduced oxygen permeabilities. The collected values at 10 and 30 wt% have been compared with those of homologous samples prepared using a commercial silica. Two micro-mechanical models (Voigt and Halpin–Tsai) have been used to also fit the mechanical data. Finally, an economic analysis of material and energetic costs has been performed on samples containing silica from rice husk in order to establish if the proposed process is sustainable or advantageous.
1. Introduction
Rice husk (RH) is an agricultural by-product abundantly available: indeed, its accounts is one out of five of the annual worldwide rice production. The yearly global rice production has been estimated at 729 million tons for 2012, which implies more than 150 million tons of RH production, on the basis of the data published by the Food and Agriculture Organization (FAO) of the United Nations in the “Rice Market Monitor” report.1 Although RH has been already employed in different fields (namely, as bio-fertilizer, as material for animal husbandry, as absorbent and building material or pest control agent2), it is still often considered as a waste product of rice milling, and thus, often burned in open air or dumped on wasteland. Furthermore, it is well-known that RH can be also used as a renewable fuel in cogenerating plants, considering its high calorific value (4012 Kcal kg−1).3 Indeed, during its combustion, about 20–25 wt% of rice husk ash (RHA), containing more than 90% silica, with traces of other metal oxides, is produced.4In the present scenario, many researchers have focused their efforts on the possible uses of RH and RHA, considering their abundance and cheap cost as industrial wastes. RH main components are cellulose (38.3%), hemicellulose (31.6%), lignin (11.8%) and silica (18.3%),5 respectively. Because of its high content, the different extraction procedures of cellulose from RH6,7 and rice straw8 have been explored. On the other hand, the abundant presence of silica is judged to be very interesting and useful for a possible industrial exploitation. Several reports on the extraction of silica from RH have been published in the literature.9–11 As an example, Real et al.12 found a homogeneous size distribution of nanometric silica particles by burning RH in the 873–1073 K range in a pure oxygen atmosphere. In addition, Della et al.13 observed that active silica with a high specific area can be produced from RHA after heat-treating at 973 K in air. Alternatively, Kalapathy et al.14 and Kamath and Proctor15 proposed a new route for producing silica, by suspending RH in sodium hydroxide, and then precipitating it with an acid for extracting a silica gel.
For the arising interest in the environmental pollution aspects and necessity to conserve energy and material resources, the use of RHA and derived silica in various applications (namely, fillers in cements, fertilizers, and catalyst carriers) has been encouraged.16–19 Furthermore, such silica has proven to be good filler also for different polymer matrices.20–29 As an example, Fuad et al.,25 prepared polypropylene-based composites containing silica from RHA and assessed the resulting properties. Silica from RH has also been employed for preparing high density polyethylene (HDPE)-based composites; indeed, Panthapulakkal et al.;26 Yao et al.29 and Ayswarya et al.21 have shown the two-fold advantages of reducing the pollution and modifying the properties of HDPE by a cost effective and reliable method. The main polymers compounded with silica from RH are usually polyolefins or natural rubbers. Only recently, a few attempts for poly(lactic acid) – PLA – have been published30,31 with particular attention to the effect of silica on its thermal and mechanical properties. Indeed, these features together with the high oxygen permeability represent the main drawbacks of PLA, beyond its high price: in comparison with polymers commonly used in packaging, its price strongly limits an industrial exploitation.
Thus, the use of a cheap filler like neat RH or silica (better if derived from RH) may be extremely advantageous, in particular, if an economical and sustainable process is foreseen, notwithstanding the environmental impact. To the best of our knowledge, no one has conducted a study and published a scientific paper on the use of silica from RH as filler for poly(lactic acid), PLA, even though it represents the most common bio-based and compostable material, currently employed in food packaging.
Therefore, the aim of the present manuscript was to prepare composites consisting of PLA and silica derived from RH with enhanced performance through an economical and sustainable process, using an industrial technology, such as extrusion, or an easily scaled up process, such as water heating. In addition, the mechanical and permeability properties of some of these materials (10 and 30 wt%) have been compared with those of other samples containing a commercial silica.
With this purpose, a first exploratory economic analysis of material and energetic costs has also been carried out, and the resulting data are discussed at the end of the manuscript. This raw analysis could be the basis for future fine improvements.
2. Material and methods
2.1 Materials
Poly(lactic acid) (3051D grade, MFI = 10–25 g/10 min, relative viscosity = 3.0–3.5 from manufacturer data sheet) and rise husk as by-products were kindly supplied by NatureWorks LLC and by S.P. S.p.A., respectively. A commercial silica, namely SIDISTAR® T120 purchased from Elkem (especially designed for polymer applications and based on a spherically-shaped amorphous silicon dioxide with an average primary particle size of 150 nm) was used for preparing some samples for comparison.2.2 Silica extraction from RH
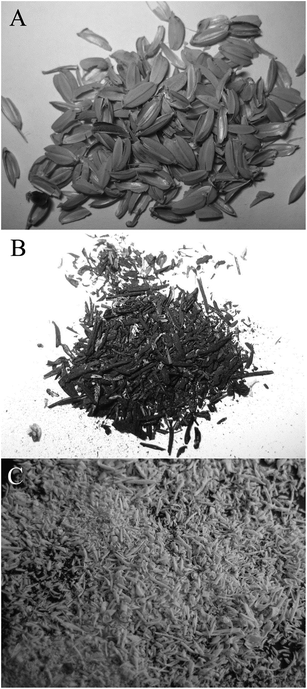
In a typical experiment, 40 g of milled RH were placed in a beaker containing 386 g of distilled water and 14 g of sulfuric acid under stirring for 3 h at 80 °C. Such an operation was used as a preparation step to a further calcination in order to prevent the formation of black particles because of the presence of impurities, such as potassium as reported by Krishnarao et al.32 The solid residue was separated by filtration, washed with deionized water and dried. Subsequently, the residue was calcined in a muffle furnace at 800 °C for 1 h to obtain 15% of the original material weight as silica.Fig. 1 shows a picture of the original material (namely, RH), silica with and without previous treatment in sulfuric acid (Fig. 1A–C, respectively).
2.3 PLA–silica-based bio-composite preparation
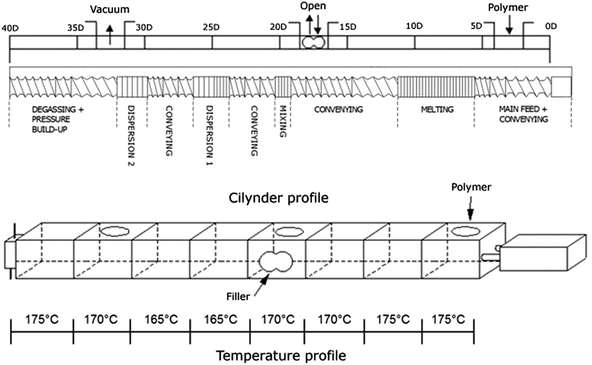
PLA was dried at 80 °C for 6 h in a vacuum convection oven before extrusion, reaching <200 ppm of water content, assessed by Karl-Fisher titration. Analogously, both extracted and commercial silica were dried before the extrusion in an oven at 200 °C for 3 h.PLA-based silica composites with different filler content (namely, 5, 10, 20 and 30 wt% for extracted and 10 and 30 wt% for the commercial one, respectively) were melt blended using a co-rotating twin screw extruder LEISTRITZ ZSE 18/40 D (diameters). The screw speed was fixed at 100 rpm. The heating temperature was set from 175 to 165 °C into the eight thermo-stated barrel blocks (as reported in Fig. 2) and the melt temperature was measured to be 195 °C. Two gravimetric feeders were used: namely, the main hopper for the polymer was placed at the beginning of the screw and the second one (side feeder) for the filler after 17–18 D. Close to the screw end, corresponding to 32–33 D, a degassing hole in the barrel connected to a vacuum pump was present. The total extrusion flow rate was fixed at 2 kg h−1. The used screw profile is reported to Fig. 2.
Furthermore, the samples will be coded on the basis of their nominal compositions and filler origin: as two examples, PLA10S and PLA10SIDI refer to the bio-composite nominally loaded with 10 wt% of extracted or commercial silica, respectively.
Pellets obtained by extrusion were dried at 80 °C for 6 h in a vacuum convection oven before the preparation of suitable specimens for dynamic-mechanical thermal (DMTA) and stress–strain analyses, and oxygen permeability tests (OP).
The samples for DMT and OP tests (60 × 60 × 1 mm3 and 100 × 100 × 0.2 mm3 specimens, respectively) were prepared using a hot compression molding press at 180 °C for 3 min (pressure of 5 MPa).
The samples for stress–strain analyses (5B type specimens according to the standard ISO527) were prepared by injection molding using a Babyplast 6/10P machine (200 °C barrel temperature and 130 bar of injection pressure).
2.4 Characterization techniques
The chemical structure of RH and silica was evaluated by attenuated total reflectance (ATR)-infrared spectroscopy (FTIR). ATR spectra were recorded at room temperature in the 4000–600 cm−1 range (16 scans and 4 cm−1 resolution), using a Frontier FTIR/FIR spectrophotometer, equipped with a diamond crystal.The surface morphology of the fillers and bio-composites was studied using a LEO-1450VP scanning electron microscope (beam voltage: 20 kV); a X-ray probe (INCA Energy Oxford, Cu-Kα X-ray source, k = 1.540562 Å) was used to perform elemental analysis. The samples were obtained by fracturing 1 mm thick films in liquid nitrogen (5 × 1 mm2). These pieces were pinned up to conductive adhesive tapes and gold-metallized. Powders of RH and extracted silica (5 × 5 mm2) were also metallized with gold.
A measurement of silica particle sizes (at 90 degree scattering angle) was performed using a dynamic light scattering apparatus (Malvern Zetasiser Nano-S90 model).
Thermogravimetric analysis (TGA) was performed by placing samples (ca. 10 mg) in open alumina pans, and using a Q500 TA Instruments analyser, from 50 to 800 °C at 10 °C min−1 with an air flow of 60 ml min−1. The data collected were Tmax (temperature at maximum rate of weight loss) and final residue at 800 °C.
Dynamic-mechanical thermal experiments (DMTA) were performed using a DMA Q800 TA Instruments with tension film clamp. The experimental conditions were: temperature range from 30 to 120 °C, heating rate of 3 °C min−1, 1 Hz of frequency and 0.05% of oscillation amplitude in strain-controlled mode. In addition, measurements in isothermal conditions at 30 °C were carried out.
Tensile tests were performed at room temperature (23 ± 1 °C) using a Zwick Roell Z100 machine, following the ISO 527 standard, under a loading cell of 5 kN and a rate of 1 mm min−1. By this first step, the tensile modulus was calculated; subsequently, the rate was increased up to 5 mm min−1 until the specimen reached its breaking point.
Six specimens were used for each formulation and the average values and corresponding standard deviations were calculated. These tests provided the Young's modulus values (E), elongation at break (ε) and maximum tensile strength (σ) of the bio-composites.
Prior to mechanical tests, all the specimens were conditioned at 23 ± 1 °C and 50% relative humidity in a climatic chamber for 48 h.
Oxygen permeability (OP) was measured using a Multiperm ExtraSolution instrument. The experimental conditions were set at 23 °C and 65% relative humidity, with an initial conditioning time of 4 h. The end of the test was established when the collected data reached an oxygen transmission rate (OTR) accuracy of 0.5%. An OTR value was automatically obtained by the instrument on the basis of the atmospheric pressure depending on weather conditions. OP was calculated following the eqn (1), after measuring film thickness by a micrometer device.
 | (1) |
2.5 Mechanical data analysis
DMT and stress–strain analyses were employed to mechanically characterize the samples containing both extracted and commercial silica in order to:(i) assess the effect of filler content on PLA storage modulus in the 30–120 °C range;
(ii) assess the effect of filler content on PLA Young's modulus, elongation at break and maximum tensile strength.
As already described in our previous study,33 models of Voigt (eqn (2)) and Halpin–Tsai (eqn (3)) can be used to assess the filler modulus.
| Ec = ϕmEm + ϕfEf | (2) |
 | (3) |
For the application of these micro-mechanical models, it is necessary to know the volumetric fractions, and thus, the silica real content and density within PLA composites. In order to assess silica density, Archimedes law was exploited, performing weight measurements in air and water and estimating the silica real content by TGA final residues. Subsequently, the found density values were used for calculating the volumetric fractions (ϕ) required by micro-mechanical models, from the weight fractions, once again estimated as TGA final residues.
Finally, the best fitting line of the experimental modulus values of bio-composites was calculated using the two micro-mechanical models cited above; in this manner, also the silica modulus was assessed.
2.6 Evaluation of filler-matrix interactions
The effect of polymer-filler interactions can be quantitatively described using Pukanszky model for particle-based composites, as described in eqn (4) and (5).34 More specifically, eqn (5) derived from eqn (4) allows to investigate a linear relationship existing between the natural logarithm of reduced yield stress σred (defined as follows) and the filler content.35,36
 | (4) |
 | (5) |
In our manuscript, such a model was used for assessing PLA–silica interactions and for establishing if some differences occur in relation to the silica type (namely, extracted or commercial silica).
3. Results and discussion
3.1 Silica characterization
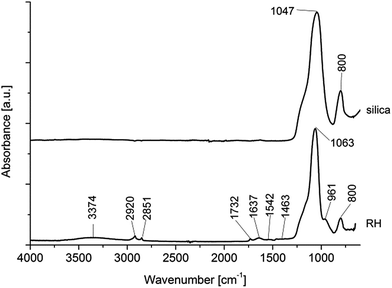
Infrared spectroscopy provided suitable information on the chemical structure of the original RH and extracted silica: their ATR spectra are reported in Fig. 3.As far as RH is concerned, numerous peaks are evident: in particular, a broad band between 3750 and 2800 cm−1 (centered at 3374 cm−1) and a peak at 1542 cm−1 can be assigned to the O–H stretching and bending vibrations of adsorbed water, respectively. The most intense adsorption peaks are located at 1047 and 800 cm−1 that can be ascribed to the presence of silica (Si–O–Si stretching and bending vibrations).37 The other peaks can be assigned to cellulose, hemicellulose and lignin, the main components of RH, as already described in the introduction.5 Among these peaks, it is possible to discriminate the contribution of each component, even though, most of them are ascribed to cellulose and hemicellulose (namely, ν(OH) at 3374, ν(CH2) at 2920, δ(OH) at 1637, δ(CH2) at 1463, δ(CH), and δ(OH) at 961 cm−1. In addition, for the hemicellulose a less intense peak at 1730 cm−1 can be attributed to the C![[double bond, length as m-dash]](https://www.rsc.org/images/entities/char_e001.gif) O stretching vibration of carboxyl groups). On the other hand, the presence of lignin is detectable only for the presence of methyl groups and aromatic skeletal vibrations (at 2851 and 1637 cm−1, respectively).
O stretching vibration of carboxyl groups). On the other hand, the presence of lignin is detectable only for the presence of methyl groups and aromatic skeletal vibrations (at 2851 and 1637 cm−1, respectively).
After silica extraction, all the bands of cellulose, hemicellulose and lignin disappear and only the Si–O–Si stretching and bending vibrations are still detectable (i.e. 1047 and 800 cm−1, Fig. 3).
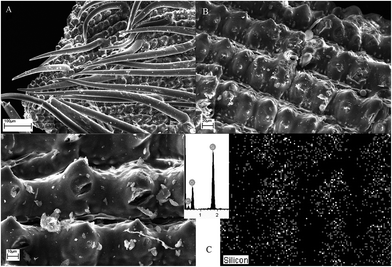
From the morphological point of view, RH is characterized by an ordinated structure in which regular and geometric elements are repeated (Fig. 4A and B). In addition, some elongated structures, such as “whiskers”, are well visible on the shield tips (Fig. 4A). The elemental analysis reported in Fig. 4C inlet and the corresponding map (Fig. 4D) show a homogeneous distribution and fine dispersion of elemental Si in the entire area taken into consideration.
When silica is extracted from RH, its morphology is extremely inhomogeneous (Fig. 5A); only after a milling treatment, a more homogeneous distribution of polyhedral “chips” can be achieved (Fig. 5B). However, a broad distribution of silica particles has been observed (from 10–20 μm to 0.5–2 μm). Further confirmation about the smallest particles obtained from light scattering analyses: once again, a broad distribution consisting of three peaks centered at 0.25, 1.15 and 5.50 μm with a proportion of 74%, 25% and 1%, respectively, has been found.
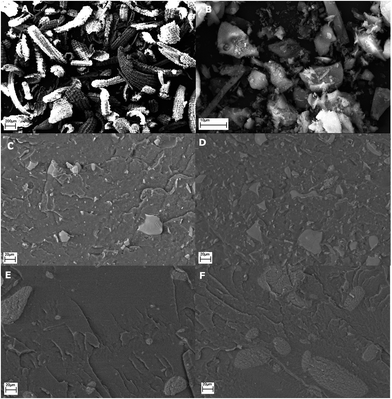 | ||
| Fig. 5 SEM magnifications of silica powder (A and B) and bio-composites containing 10 and 30 wt% of extracted (C and D) and of commercial silica (E and F). | ||
3.2 PLA–silica bio-composite characterization
When homologous samples containing 10 and 30 wt% of a commercial silica were observed by SEM (Fig. 5E and F), no significant differences in terms of aggregate sizes have been easily detected; only the shape of the aggregates formed by the two fillers can be considered slightly different: polyhedral-like for extracted silica and globular-like for the commercial one.
However, in some areas, the aggregates are bigger than those observed with extracted silica (up to 100 μm, Fig. 5F).
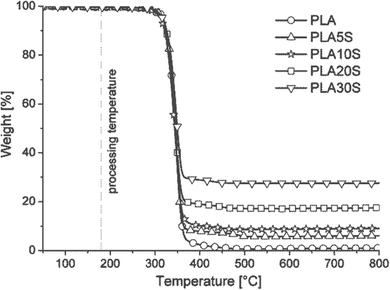
Such technique has been primarily used to check the thermal stability of the bio-composites containing extracted silica in air in comparison with the behavior of PLA. Fig. 6 reports the weight loss as a function of temperature (TG curve) and Table 1 summarizes the collected data.
| Sample | Tmax [°C] | Residue at 800 °C [%] | Estimate filler content [%] |
|---|---|---|---|
| PLA | 347 | 1.0 | 0.0 |
| PLA5S | 346 | 6.0 | 5.0 |
| PLA10S | 345 | 9.0 | 8.0 |
| PLA20S | 347 | 17.5 | 16.5 |
| PLA30S | 346 | 27.5 | 26.5 |
| PLA10SIDI | 348 | 11.0 | 10.0 |
| PLA30SIDI | 348 | 30.0 | 29.0 |
For PLA, its thermal degradation occurs in air by a single step in which the maximum weight loss is registered (347 °C). Taking in consideration the accuracy of the employed TG, there is an experimental error of 0.5 wt%, and neat PLA leaves an almost negligible residue at the end of the test (residue at 800 °C).
Referring to bio-composites, regardless of their silica content, Tmax remains constant within the experimental error; on the other hand, the final residue at 800 °C increases by increasing filler loading (Fig. 6 and Table 1). These findings were expected as silica is thermally stable up to 800 °C, and therefore, the prepared materials are stable at the PLA processing temperature (namely, 180 °C).
Comparing the final residues with the theoretical contents of silica within bio-composites, the real content of filler inside was estimated: these data were reported in Table 1 (last column). We concluded that PLA5S, PLA10S, PLA20S and PLA30S actually contain 5.0%, 8.0%, 16.5% and 26.5% of silica, respectively. This suggests an imprecise control of the gravimetric feeder during extrusion; this is probably because silica particles that exhibited a high tendency to agglomerate and compact themselves. Such a disadvantage was not spotted using the commercial silica under investigation: indeed, the real contents of filler for PLA10SIDI and PLA30SIDI were 10.0% and 29.0% (Table 1), respectively.
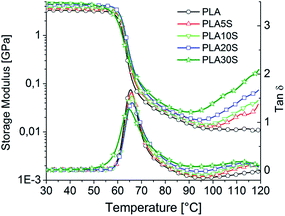
The dynamic thermo-mechanical analysis in strain controlled mode has been used in order to establish the effect of the temperature and filler content on the storage modulus of PLA: Fig. 7 reports the trend of the storage modulus (E′) vs. temperature. This aspect is fundamental for those applications at different conditions from room temperature, in particular if some significant temperature leaps occur. From an overall consideration, a general increase of E′ has been observed under the glass transition temperature (Tg) for all the prepared bio-composites, revealing that the filler modulus could be higher than that of PLA, as expected (Table 2). In addition, E′ turned out to be a function of the silica content: indeed, it increases, by increasing filler content. For all the formulations and neat PLA, the mechanical property collapse occurs at 65 °C, estimated as maximum of tan![[thin space (1/6-em)]](https://www.rsc.org/images/entities/char_2009.gif) δ. At high temperatures (>100 °C), the bio-composites exhibited higher storage modulus than that of PLA, although very low.
δ. At high temperatures (>100 °C), the bio-composites exhibited higher storage modulus than that of PLA, although very low.
| PLA | Filler content | |||||
|---|---|---|---|---|---|---|
| 5 wt% | 10 wt% | 20 wt% | 30 wt% | |||
| a Δ = x PLA-x biocomposite/x PLA, x can be E, E′ or E/density. | ||||||
| DMTA of silica from RH at 30 °C | E′ [GPa] | 3.34 ± 0.07 | 3.62 ± 0.07 | 3.86 ± 0.08 | 4.40 ± 0.09 | 5.14 ± 0.1 |
| ΔE′a [%] | — | +8 | +16 | +32 | +54 | |
| Stress–strain analysis of silica from RH at 23 °C | E [GPa] | 3.72 ± 0.07 | 4.04 ± 0.07 | 4.32 ± 0.02 | 4.94 ± 0.05 | 5.62 ± 0.47 |
| ΔEa [%] | — | +9 | +16 | +33 | +51 | |
| ε [%] | 9.21 ± 1.72 | 5.42 ± 1.29 | 5.48 ± 1.12 | 2.75 ± 0.94 | 2.46 ± 0.43 | |
| σmax [MPa] | 57.15 ± 1.56 | 54.47 ± 2.52 | 52.65 ± 1.66 | 54.43 ± 2.55 | 50.71 ± 1.32 | |
| E/density [MPa m3 Kg−1] | 2.98 ± 0.05 | 3.16 ± 0.05 | 3.33 ± 0.02 | 3.68 ± 0.05 | 3.93 ± 0.1 | |
| ΔE/densitya [%] | — | +6 | +12 | +24 | +32 | |
| Stress–strain analysis of commercial silica at 23 °C | E [GPa] | 3.72 ± 0.07 | — | 4.27 ± 0.13 | — | 5.51 ± 0.17 |
| ΔEa [%] | — | — | +15 | — | +48 | |
| ε [%] | 9.21 ± 1.72 | — | 2.68 ± 0.62 | — | 0.69 ± 0.04 | |
| σmax [MPa] | 57.15 ± 1.56 | — | 51.39 ± 1.55 | — | 32.35 ± 1.59 | |
DMTA data confirm that PLA and also the bio-composites, regardless of their filler content, may be used only under 60–65 °C, where the mechanical properties fail.
Pursuing our research, some stress–strain analyses at room temperature have been performed for assessing the toughness of composites. The collected data are listed in Table 2. As expected, a significant increase of the Young's modulus of PLA as a function of the filler content has been found (4.04, 4.32, 4.94, 5.62 vs. 3.72 GPa for PLA5S, PLA10S, PLA20S, PLA30S and PLA, respectively). Referring to the deformation at break, a significant decrease, depending on filler content, has been observed.
Surprisingly, the presence of extracted silica, regardless of its content, slightly reduces the maximum strain value of PLA (σmax). Actually, such a trend is an unusual behavior that could be ascribed to the broad distribution of silica, already discussed in section 3.2.1 Morphological analysis. These findings confirm the possibility to use such bio-composites for applications where the deformation or maximum loading required should be similar to that of PLA.
Bio-composites containing commercial silica have exhibited a different mechanical behavior when compared with those containing silica obtained from RH. Indeed, apart from the increase of Young's modulus observed also in this case, and comparable with that of extracted silica (Table 2), the elongation at break and the maximum strain value of PLA have been strongly reduced by the presence of commercial silica. At the highest filler content (30 wt%), ε passed from 9.2 (PLA) to 2.46% or 0.69%, as well as σmax from 57.15 to 50.71 or 32.35 MPa for PLA30S and PLA30SIDI, respectively. This finding can be ascribed to a different interaction level between filler and matrix: confirming our hypothesis Pukanszky model was applied. Fig. 8 plots reduced stress at yield data (log![[thin space (1/6-em)]](https://www.rsc.org/images/entities/char_2009.gif) σred) as a function of volumetric fractions. If such a model works, a straight line should be obtained, the slope of which represents the B parameter of eqn (4) and (5). As already explained, B is a term corresponding to the load carrying capability of the filler and depends on filler-matrix interactions and is influenced by all factors affecting the load-bearing capacity of the filler, i.e. on the strength of interaction (which depends on surface energy/chemistry of the constituent) and on the size of the contact surface.35 It means that at higher B, there are stronger filler-matrix interactions.
σred) as a function of volumetric fractions. If such a model works, a straight line should be obtained, the slope of which represents the B parameter of eqn (4) and (5). As already explained, B is a term corresponding to the load carrying capability of the filler and depends on filler-matrix interactions and is influenced by all factors affecting the load-bearing capacity of the filler, i.e. on the strength of interaction (which depends on surface energy/chemistry of the constituent) and on the size of the contact surface.35 It means that at higher B, there are stronger filler-matrix interactions.
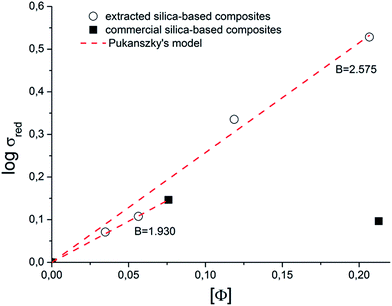 | ||
| Fig. 8 Reduced stress data of PLA and bio-composites with extracted and commercial silica with the fitting lines according to Pukanszky's model. | ||
Comparing the two silica, it is noteworthy that at 10 wt% loading, the trend, and thus, B value of the two silica are almost comparable; on the contrary, at 30 wt%, silica derived from RH still exhibits a linear trend, the slope of which is significantly higher than that of composite containing commercial silica (2.575 vs. 1.930, Fig. 8). In this manner, we can conclude that a higher filler-matrix interaction level was verified when silica from RH is used. This can explain the mechanical properties discussed above.
The mechanical analysis has been completed by fitting the experimental E data by micro-mechanical models. As already mentioned, this study could be useful for correctly choosing the composite formulation when a specific E is required. To this aim, an estimation of the silica density with Archimedes law and silica modulus were carried out. A density value of 1.82, 1.88 and 1.25 g cm−3 for the extracted silica, commercial silica and PLA has been found, respectively. Subsequently, these values have been used for calculating the volumetric fractions (ϕ) required by micro-mechanical models (0.035, 0.056, 0.119 and 0.207 for PLA5S, PLA10S, PLA20S and PLA30S, respectively) determined from the weight fractions estimated from TGA residues (Table 1, column of the estimate filler content).
As already described in a previous study,33 models of Voigt (eqn (2)) and Halpin–Tsai (eqn (3)) can be used to assess the modulus of a filler in a polymer matrix. Referring to pure polymer, the Em value adopted was 3.72 GPa, obtained from the stress–strain tests on PLA (Table 2). Simultaneously, the evaluation of Ef has been proven to be difficult enough. Thus, Voigt and Halpin–Tsai models have been used to valuate Ef from Ec values measured by stress–strain tests (Table 2). As results, Ef values calculated using Voigt and Halpin–Tsai models are 13.8 and 65 GPa with a maximum punctual error of 0.8% and 1% (up to 20 wt% loading), respectively. Subsequently, (Ec − EPLA)/EPLA values as a function of the volumetric fraction obtained from both models have been plotted (Fig. 9) and the experimental results with corresponding error have also been included. It is noteworthy that the Halpin–Tsai model resulted in a theoretical value of silica modulus that is very close to that of a glass.
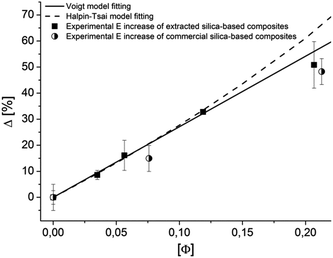 | ||
| Fig. 9 Experimental modulus (E) increase of extracted and commercial silica and modulus fitting curves with Voigt and Halpin–Tsai models. | ||
Referring to the volume fraction calculation, the bio-composites have showed a density higher than unloaded PLA, due to the presence of silica; this aspect can be considered relevant for the packaging transport cost. In this optics, for evaluating if the weight increase is higher than the modulus one, the specific modulus was calculated as E/density: these data (Table 2) showed that the presence of silica favors an increase of E, even though the values were normalized on density.
The oxygen barrier properties of the prepared bio-composites have been tested and the collected data are summarized in Table 3, where the permeability was calculated using the eqn (1). These data showed that the oxygen permeability of PLA is significantly affected by the presence of both silica, but the trend is completely opposite. Indeed, with extracted silica OP decreases, while with commercial one it increases. In both cases, the reduction or improvement is significant and almost linearly dependent on silica content (Table 3). The reduction may be gradual due to the silica particle, which turns out to be less permeable to the oxygen diffusion than matrix. In addition, the presence of silica particles within PLA may create a more tortuous pathway in the matrix, through which oxygen diffusion is difficult. The last aspect can be ascribed to the good adhesion and filler-matrix interaction level (demonstrated with Pukanszky's model), as well as the homogeneous distribution of the filler within the polymer matrix (observed by SEM).
| Sample | Thickness [mm] | OTR [cm3/(m2 bar 24 h)] | OP [cm3 mm/(m2 bar 24 h)] | δa [%] |
|---|---|---|---|---|
| a δ = (OP bio-composite − OP PLA)/OP PLA. | ||||
| PLA | 0.32 | 47.5 | 15.2 | — |
| PLA5S | 0.24 | 58.6 | 14.1 | −7 |
| PLA10S | 0.30 | 41.2 | 12.4 | −19 |
| PLA20S | 0.29 | 37.1 | 10.8 | −29 |
| PLA30S | 0.35 | 15.6 | 5.4 | −64 |
| PLA10SIDI | 0.29 | 195.5 | 55.7 | +267 |
| PLA30SIDI | 0.31 | 817.2 | 253.3 | +1567 |
Conversely, with commercial silica, the aggregates are bigger than those observed with extracted silica (as already discussed in heading 3.2.1 Morphological analysis) and the filler-matrix interaction level is lower. Probably, some aggregates may also have sizes comparable with film thickness, causing some defects able to increase the oxygen permeability.
In addition, the aggregates seem to be formed by a large number of nanometric particles not completely adherent among them. All these aspects result in the formation of a film that is more permeable to the oxygen diffusion with respect to that containing extracted silica.
Referring to silica extraction, our attention was focused on material and energetic costs. First of all, we have calculated the total cost of 1 kg silica production, on the basis of the unit costs of each material used during extraction (namely, rice husk, sulfuric acid and water), following the recipe previously described in heading 2 Materials and methods; these data are summarized in Table 4. It is important to highlight that costs taken in consideration in our calculations refer to industrial (and not laboratory) quantities. The total cost for silica production was estimated 0.92 € kg−1. In addition, costs due to water heating and rice husk burning were considered (Table 5). As far as water heating is concerned, a consumption of 5.88 kW h has been assessed, taking into account that the efficiency of a common electrical heater is approximately 0.9. Otherwise, the RH burning occurs with a heat release, and thus, an energetic gain may be obtained (namely, 9.34 kW h with an efficiency of 0.3). In conclusion, the total energetic balance of such process is positive with a production of 3.46 kW h, corresponding to a gain of 0.69 € (considering the 2012 Italy energy cost).
| Material | RH | H2SO4 | Water |
|---|---|---|---|
| a Associazione Granaria di Milano – Borsa dei Cereali (http://borsa.granariamilano.org/visualizza_listino.php3).b Italian leader for sulfuric acid production (http://www.marchi-industriale.it/web/index.php/It/home/).c Italian quotation for 2012 (http://www.ilsole24ore.com/art/impresa-e-territori/2013-05-10/litalia-acqua-prezzi-geografia-201003.shtml?uuid=AbSBMtuH). | |||
| Cost [€ kg−1] | 0.07a | 0.14b | 0.002c |
| Material amount for 1 kg silica [kg] | 6.67 | 2.33 | 65.33 |
| Cost of material for 1 kg silica [€] | 0.47 | 0.33 | 0.13 |
| Total cost for 1 kg silica [€] | 0.92 | ||
| Process step | Water boiling | RH burning |
|---|---|---|
| a Evaluation carried out in our laboratory.b Tsai et al. 2007.3c In order to evaluate the energetic gain, 0.2 € kW−1 h−1 was used following the Italian National table of electric energy provided by “Autorità per l'energia elettrica e il gas” 2012, independent organism of Italian Government (http://www.autorita.energia.it/it/che_cosa/presentazione.htm). | ||
| Material amount for 1 kg silica [kg] | 65.33 | 6.67 |
| Energy [kW h kg−1] | −0.10a | +4.67b |
| Efficiency | 0.9 | 0.3 |
| Total energy [kW h] | −5.88 | +9.34 |
| Total energetic balance [kW h] | +3.46 | |
| Energetic gain [€] | 0.69c | |
Pursuing our economical assessment, the cost of PLA–silica-based bio-composites has been compared with that of pure polymer. To this aim, the concept of Break-Even Point (BEP) has been considered. On the basis of its value, it is possible to establish if the investigated formulations are economically sustainable. More specifically, BEP represents the percentage of silica that should be added to PLA in order to have the cost of the bio-composite equal to that of pure polymer. Thus, the process turns out to be economically advantageous only when the employed silica amount exceeds the BEP. On the basis of the costs reported in Table 6 for PLA, silica and extrusion process, it was calculated that approximately 25 wt% filler is needed to exceed the BEP value, and thus this amount guarantees economical outcomes, notwithstanding the environmental aspect. In addition, such material exhibited higher mechanical and barrier properties with respect to neat PLA.
BEP value is strongly reduced from 25 down to 18 wt% filler, when the energetic gain of 0.69 € for 1 kg of silica is included in its calculation.
It is noteworthy that the cost used for extrusion (0.4 € kg−1) is a typical industrial cost for 10 tons of materials in 2012; obviously, this cost can be further reduced by increasing the produced quantity. Furthermore, the cost of polymer was quoted 2.5 € kg−1, although such value strongly depends on market requests. Finally, the improved mechanical and barrier properties of composites may allow a reduction of package thickness with respect to the use of unloaded polymer, making even more economic our approach.
4. Conclusions
In the present study, bio-composites consisting of poly(lactic acid) and silica derived from rice husk have been prepared by melt compounding. The possibility to obtain injection molded objects or films was verified obtaining samples for the characterization analysis. The collected data by thermogravimetry and mechanical analyses have shown that all the formulations under investigation can be taken into account as materials for several applications in the packaging field such as boxes, containers, crates, other objects and thick films. Indeed, the presence of extracted silica has induced significant improvements of the Young's modulus as well as a slight reduction of the oxygen permeability of PLA. The achieved mechanical properties turned out to be higher than those exhibited by the homologous samples prepared by using a commercial silica.The economic analysis of the materials and whole process (namely, silica extraction and bio-composite preparation) has highlighted that the production of a formulation containing 20 wt% silica can be considered economically sustainable, when the energy recovered from the rice husk burning is reused.
Acknowledgements
The Authors would like to thank the ECOFOOD project within “Ricerca & Innovazione per il Miglioramento della Sostenibilità della Filiera Agro-alimentare” program, economically supported by the POR-FESR resources of the Economy and Finance Ministry, the European Union and the Piedmont Region – Publication no. 13.References
- FAO Rice Market Monitor, November 2012, Vol. XV, issue no. 4 Search PubMed.
- R. Prasad and M. Pandey, Bull. Chem. React. Eng. Catal., 2012, 7(1), 1–25, DOI:10.9767/bcrec.7.1.1216.1-25.
- W. T. Tsai, M. K. Lee and Y. M. Chang, Bioresour. Technol., 2007, 98(1), 22–28, DOI:10.1016/j.biortech.2005.12.005.
- M. Patel, A. Karera and P. Prasanna, J. Mater. Sci., 1987, 22(7), 2457–2464, DOI:10.1007/bf01082130.
- M. M. Hessien, M. M. Rashad, R. R. Zaky, E. A. Abdel-Aal and K. A. El-Barawy, J. Mater. Sci. Eng. B, 2009, 162(1), 14–21, DOI:10.1016/j.mseb.2009.01.029.
- N. Johar, I. Ahmad and A. Dufresne, Ind. Crops Prod., 2012, 37(1), 93–99, DOI:10.1016/j.indcrop.2011.12.016.
- D. Battegazzore, S. Bocchini, J. Alongi, A. Frache and F. Marino, Cellulose, 2014, 21, 1813–1821, DOI:10.1007/s10570-014-0207-5.
- P. Lu and Y. L. Hsieh, Carbohydr. Polym., 2012, 87(1), 564–573, DOI:10.1016/j.carbpol.2011.08.022.
- A. Chakraverty, P. Mishra and H. D. Banerjee, J. Mater. Sci., 1988, 23(1), 21–24, DOI:10.1007/bf01174029.
- K. Kamiya, A. Oka and H. Nasu, J. Sol-Gel Sci. Technol., 2000, 19(1–3), 495–499, DOI:10.1023/a:1008720118475.
- K. G. Mansaray and A. E. Ghaly, Biomass Bioenergy, 1999, 17(1), 19–31, DOI:10.1016/s0961-9534(99)00046-x.
- C. Real, M. D. Alcala and J. M. Criado, J. Am. Ceram. Soc., 1996, 79(8), 2012–2016, DOI:10.1111/j.1151-2916.1996.tb08931.x.
- V. P. Della, I. Kuhn and D. Hotza, Mater. Lett., 2002, 57(4), 818–821, DOI:10.1016/s0167-577x(02)00879-0.
- U. Kalapathy, A. Proctor and J. Shultz, Bioresour. Technol., 2002, 85(3), 285–289, DOI:10.1016/s0960-8524(02)00116-5.
- S. R. Kamath and A. Proctor, Cereal Chem., 1998, 75(4), 484–487, DOI:10.1094/cchem.1998.75.4.484.
- S. Turmanova, S. Genieva and L. Vlaev, Int. J. Chem., 2012, 4(4), 62–89, DOI:10.5539/ijc.v4n4p62.
- Y. Hamzeh, K. P. Ziabari, J. Torkaman, A. Ashori and M. Jafari, J. Environ. Manage., 2013, 117, 263–267, DOI:10.1016/j.jenvman.2013.01.002.
- J. Torkaman, A. Ashori and A. Sadr Momtazi, Constr. Build. Mater., 2014, 50, 432–436, DOI:10.1016/j.conbuildmat.2013.09.044.
- A. Nourbakhsh, F. F. Baghlani and A. Ashori, Ind. Crops Prod., 2011, 33(1), 183–187, DOI:10.1016/j.indcrop.2010.10.010.
- W. Arayapranee, N. Na-Ranong and G. L. Rempel, J. Appl. Polym. Sci., 2005, 98(1), 34–41, DOI:10.1002/app.21004.
- E. P. Ayswarya, K. F. Vidya Francis, V. S. Renju and E. T. Thachil, Mater. Des., 2012, 41, 1–7, DOI:10.1016/j.matdes.2012.04.035.
- D. S. Chaudhary, M. C. Jollands and F. Cser, Silicon Chem., 2002, 1(4), 281–289, DOI:10.1023/b:silc.0000018361.66866.80.
- M. Y. A. Fuad, I. Yaakob, Z. A. Mohd Ishak and A. K. Mohd Omar, Polym. Test., 1993, 12(2), 107–112, DOI:10.1016/0142-9418(93)90033-l.
- M. Y. A. Fuad, Z. Ismail, M. S. Mansor, Z. A. Mohd Ishak and A. K. Mohd Omar, Polym. J., 1995, 27, 1002–1015, DOI:10.1295/polymj.27.1002.
- M. Y. A. Fuad, J. Mustafah and M. S. Mansor, Polym. Int., 1995, 38(1), 33–43, DOI:10.1002/pi.1995.210380104.
- S. Panthapulakkal, S. Law and M. Sain, J. Thermoplast. Compos. Mater., 2005, 18(5), 445–458, DOI:10.1177/0892705705054398.
- S. Siriwardena, H. Ismail and U. S. Ishiaku, J. Reinf. Plast. Compos., 2003, 22(18), 1645–1666, DOI:10.1177/073168403027619.
- S. Turmanova, A. Dimitrova and L. Vlaev, Polym.-Plast. Technol. Eng., 2008, 47(8), 809–818, DOI:10.1080/03602550802188706.
- F. Yao, Q. Wu, Y. Lei and Y. Xu, Ind. Crops Prod., 2008, 28(1), 63–72, DOI:10.1016/j.indcrop.2008.01.007.
- J.-B. Li, X.-Y. Liu, W.-F. Li and J.-H. Zhu, J. Inorg. Mater., 2011, 26(9), 998–1002, DOI:10.3724/sp.j.1077.2011.11125.
- B. K. Chen, C. C. Shih and A. F. Chen, Composites, Part A, 2012, 43(12), 2289–2295, DOI:10.1016/j.compositesa.2012.08.007.
- R. V. Krishnarao, J. Subrahmanyam and T. Jagadish Kumar, J. Eur. Ceram. Soc., 2001, 21(1), 99–104, DOI:10.1016/s0955-2219(00)00170-9.
- D. Battegazzore, J. Alongi and A. Frache, J. Polym. Environ., 2013, 22(1), 88–98, DOI:10.1007/s10924-013-0616-9.
- B. Pukánszky, Composites, 1990, 21(3), 255–262, DOI:10.1016/0010-4361(90)90240-w.
- A. Dorigato, M. Sebastiani, A. Pegoretti and L. Fambri, J. Polym. Environ., 2012, 20(3), 713–725, DOI:10.1007/s10924-012-0425-6.
- A. Lazzeri and V. T. Phuong, Compos. Sci. Technol., 2014, 93, 106–113, DOI:10.1016/j.compscitech.2014.01.002.
- G. Socrates, Infrared and Raman Characteristic Group Frequencies: Tables and Charts, John Wiley & Sons, Chichester (UK), 2001 Search PubMed.
| This journal is © The Royal Society of Chemistry 2014 |

