
 Open Access Article
 This Open Access Article is licensed under a
 Creative Commons Attribution 3.0 Unported Licence
Piezoelectric fiber mats containing polar rod-shaped pigment particles
Kathrin
May
a,
Alexey
Eremin
*a,
Ralf
Stannarius
a,
Susanne
Klein
b,
Kristiaan
Neyts
c,
John
Harden
d and
Antal
Jákli
*d
aOtto-von-Guericke-Universität Magdeburg, FNW/IEP, Postfach 4120, 39016 Magdeburg, Germany. E-mail: alexey.eremin@ovgu.de
bHewlett-Packard Labs, Long Down Avenue, Stoke Gifford, Bristol, BS34 8QZ, UK
cLiquid Crystals and Photonics Group, ELIS Department, Ghent University, 9000 Ghent, Belgium
dLiquid Crystal Institute, Kent State University, Kent, OH 44242, USA. E-mail: ajakli@kent.edu
First published on 17th September 2014
Abstract
We demonstrate converse piezoelectric behavior of electrospun polylactic acid (PLA) fiber mats containing anisometric pigment nanoparticles (Novoperm Carmine HF3C). The effective piezoelectric constant of the fiber mats was estimated to be 2 nm V−1. These findings suggest polarity of the pigment particles obtained by a milling process. Transient electric current measurements were conducted to test the residual polarization of the particles. Piezoelectric fiber mats may be utilized to make colorful electro-active fiber mats and wearable smart clothing.
1. Introduction
Color pigments have been utilized for thousands of years: they were used by ancient humans to paint pictures on the walls of caves, and are still used today in inkjet printers. In contrast to dyes, pigments do not dissolve but form a colloidal dispersion. Recently suspensions of rod-shaped dichroic pigment particles were found to be promising for reflective display materials that can switch colors without the need for color filters. Anisometric nanoparticles exhibit a much higher degree of orientational order than small molecules, and they may exhibit a nematic phase in isotropic solvents above certain volume fractions.1,2 The suspensions also show strong electric-field induced birefringence in the isotropic state. In particular, the Pigment Red 176 (Novoperm Carmine HF3C) suspended in dodecane at a concentration above than 12 vol% exhibits a nematic-like phase. Linear electro-optical switching was observed in the paranematic state, suggesting that the pigment particles may have a permanent dipole moment, as large as 10−24 C m.1 Under field reversal, electric current peaks, similar to those found in ferroelectric thermotropic liquid crystals, have also been found. The existence of macroscopic polarization, however, is very difficult to prove, as complex electrokinetic effects involving ionic transport (for example due to micelles formed by surfactant used to stabilize the colloid) and electrophoresis, also take place. Polar properties of these anisometric colloidal pigment particles may be utilized in design of soft multifunctional materials. Driven by electric and magnetic fields, such materials have potential applications in production of actuators and touch sensors. One possibility for development of a soft material is to incorporate the particles into electrospun fibers and fiber mats. It has been shown these materials may exhibit piezoelectric properties.Piezoelectricity (a linear coupling between electric and mechanical signals) was discovered in non-centrosymmetric crystals by the Curie brothers in 1880.3 Since then, piezoelectricity has been observed, e.g. in ceramics,4–6 polymers,5 and ferroelectric liquid crystals.7,8 Piezoelectric effects in polymers are generally small, but can be enhanced with poling by strong DC electric fields at elevated temperatures.9 As a result of their flexibility and the possibility to prepare films of large area, these materials have been utilized as an active component in many applications ranging from infrared detectors to loudspeakers.10,11 The search for more adaptable, stronger and softer piezoelectric materials has led to the development of the internally charged cellular polymers (ferroelectrets).5,6 Recently, an even softer and lighter piezoelectric material has been produced with effective piezoelectric charge constant of d33 ∼ 1 nm V−1.10,12 This material is produced by dispersing ferroelectric BaTiO3 (BT) particles into a plant-based and biocompatible polylactic acid (PLA) fibers by utilizing the well-known electrospinning process13–17 that does not require a corona discharge. These features are attractive for various applications, but the BT particles are toxic, so pose a hazard for biological applications. Our pigment-based fiber mats may widen the range of the possible applications, since pigment particles are non-toxic and decomposable; they also provide color that can be attractive for smart textile applications. In this paper we demonstrate that the organic pigment particles can be used for preparation of soft piezoelectric mats of electrospun fibers. We characterize the optical and the converse piezoelectric response of the mats exhibiting unambiguously polar behavior.
2. Materials and methods
2.A. Preparation and polarization current measurements of pigment suspensions
Commercially available Novoperm Carmine HF3C (C.I. Pigment Red 176, Clariant, Frankfurt am Main, Germany) was used as received. It is a blue shade benzimidazolone pigment (density 1.40 g cm−3) with the chemical formula shown in Fig. 1.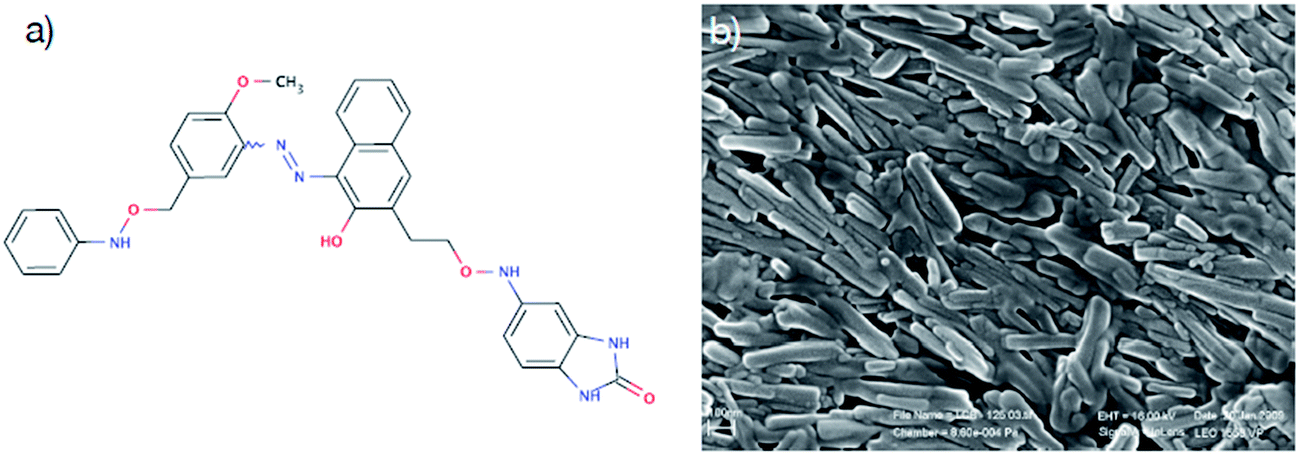 | ||
| Fig. 1 a) Chemical formula of a C.I. Pigment Red 176; (b) scanning electron microscopy (SEM) image of the pigment particles. | ||
The primary particles are rods with an average length of 230 nm ± 70 nm and an average diameter of 46 nm ± 20 nm. The suspensions of the particles were prepared in the nonpolar solvent dodecane (Sigma-Aldrich, Hamburg, Germany) with the help of a commercially available dispersant Solsperse 11200 (Lubrizol, Brussels, Belgium). Suspensions with pigment concentrations of 20 wt% and above were prepared by milling. 40 wt% of active dispersant on the weight of pigment was added to the solvent and dissolved. After the addition of the pigment, the mixture was milled in a planetary mill (Fritsch Pulverisette 7 premium line) using 0.3 mm yttria-stabilized zirconia beads in zirconia-lined pots for a total of 60 min at 500 rpm. Appropriate cooling cycles prevented the temperature inside the pots from rising above 60 °C. Concentrations below 20 wt% were made by stepwise dilution. To test the stability of the suspensions, samples were centrifuged at 10![[thin space (1/6-em)]](https://www.rsc.org/images/entities/char_2009.gif) 000 rpm for 60 minutes. None of the concentrations showed any phase separation into particle-rich and particle-poor zones. The samples left untouched for 12 months did not show any phase separation or aggregation either.
000 rpm for 60 minutes. None of the concentrations showed any phase separation into particle-rich and particle-poor zones. The samples left untouched for 12 months did not show any phase separation or aggregation either.
Measurements of the current transients were made in commercial ITO-coated glass cells (E.H.C., Japan) with sandwiched electrodes. The voltage was applied by a TGA1241 arbitrary waveform generator. We used rectangular and triangular waveforms with different offsets to study the switching dynamics on re-polarization and the relaxation dynamics after voltage removal. The transferred charge (and switched polarization) was determined by integration of the current transient curve. In order to distinguish the ionic (Pi) and polar (Pp) contributions to the measured polarization Pm = Pi + Pp, we carried out the measurements in cells of different thicknesses. Pp is the volume average of the particle dipole moment and hence it is independent of the cell thickness (at a constant electrode area). On the contrary, Pi depends on the number of charge carriers and it is proportional to the cell thickness. Detailed electrokinetic studies of the transient currents in the time domain from 0.1 ms to 100 s and measurements of particle mobility were made at Ghent University. The measurement setup consisted of a function generator, current/voltage converter Keithley 6517A, an oscilloscope and digital multimeter (Keithley 2000).18 Measurements of birefringence were made using polarizing microscope AxioImager Pol (Carl Zeiss GmbH) equipped with Abrio PolScope imaging system.
2.B. Preparation and characterization of pigment/PLA fibers
The pigment particles were dispersed in a biocompatible polymer, poly lactic acid (PLA) (MW: 186000, MW/MN: 1.76) that was purchased from Cargill Dow LLC, Minnetonka, MN. The pigment particles with and without dispersants were suspended in decane, and added to a 10 wt% PLA, 67.5 wt% chloroform and 22.5 wt% acetone mixture to create 5 and 15 wt% pigment to PLA ratios. The mixture was magnetically stirred at 400 rpm at room temperature for 2 hours. Following the procedure used recently to create a ferroelectric BaTiO3 particle-containing fiber mats,10,12 the pigment–PLA mixtures were electrospun onto indium tin oxide (ITO) coated glass plates. The mixture was dispensed in a 1 ml syringe with a 24-gauge needle and pumped at 0.6 ml per hour rate with a Braintree Scientific BSP 99 syringe pump while 21.8 kV electric potential difference was applied between the needle and the collector plate placed 10 cm apart. Electrospun fibers are formed by drawing a solution through a high electric field gradient generated between a nozzle and a collection plate by electric fields of about above 2 kV cm−1, which is well below the breakdown field of 30 kV cm−1 of dry air. This produces very thin fibers with diameters ranging from hundreds of nanometers to several microns.19,20 An optical image of the mat is shown in Fig. 2(a). The fiber mat has a characteristic red color of the pigment. The fibers appear birefringent in polarizing microscopy (Fig. 2(b)). The birefringence of the fibers prepared from the 15 wt% suspensions is around 0.001. The direction of the slow optical axis (largest birefringence) is along the fiber as shown in Fig. 2(c). Scanning Electron Microscopy (SEM), cryogenic Transmission Electron Microscopy (cryo-TEM) and Polarizing Optical Microscopy (POM) images of the electrospun fibers are shown in Fig. 3.
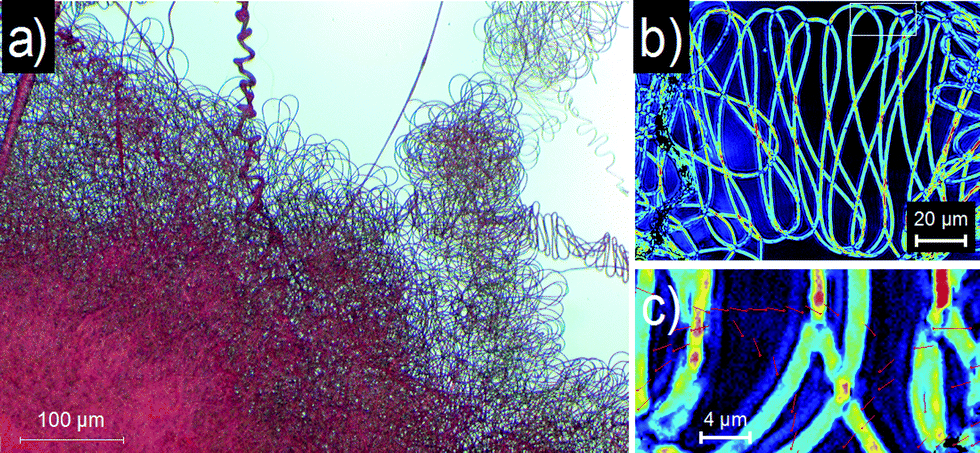 | ||
| Fig. 2 (a) Optical image of a corner of the fiber mat prepared from a 15 wt% pigment suspension. (b) PolScope image of single fibers on a glass substrate. The color marks birefringence. (c) Magnified image of the fiber showing the direction of optical slow axis in the fibers. | ||
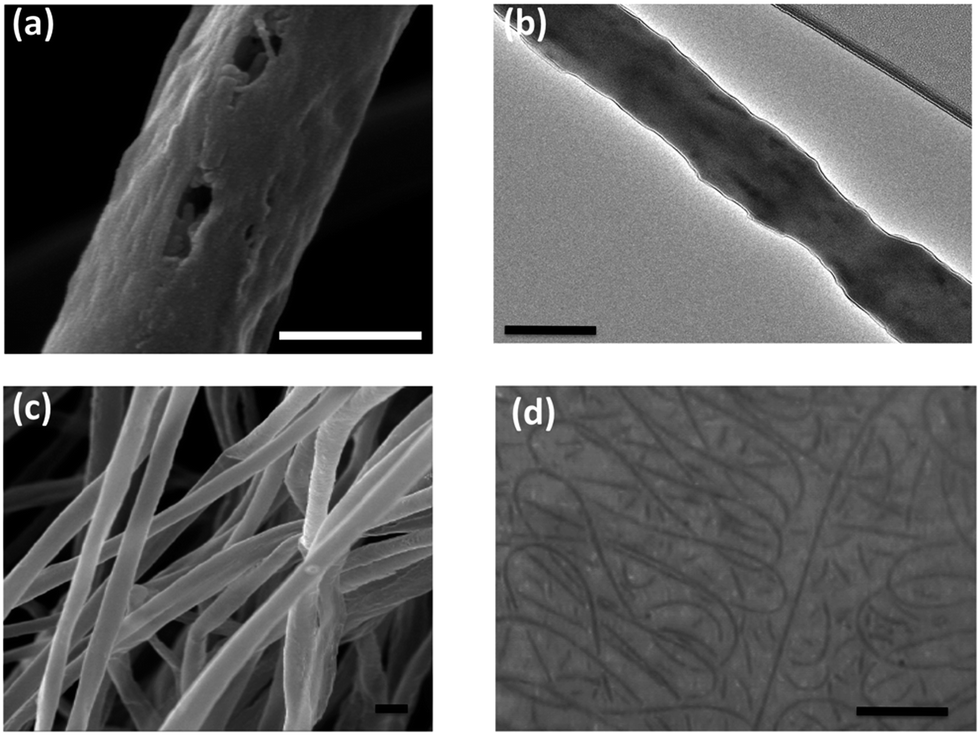 | ||
| Fig. 3 Images of electrospun fibers of Pigment Red 176 in PLA. (a) Scanning Electron Microscopy (SEM) image of a single fiber of PLA with 5 wt% pigment concentration showing some elongated holes along the fiber that might have formed by escaping pigments. (b) Cryo-TEM image of a PLA fiber with 15 wt% pigment concentration. Dark elongated spots aligned mainly parallel to the fiber are due to the pigments that have larger electron density, thus scatter more electrons. (c) SEM image of a bundle of PLA fibers with 5 wt% pigment content. (d) Polarizing Optical Microscopy (POM) image of a 150 μm thick 15 wt% pigment containing fiber mat focused at the lower layer of the collected fibers. Bars for (a–c) correspond to 300 nm lengths and to 10 μm for (d). | ||
Fig. 3(a) shows a SEM image of a fiber originally containing 5 wt% of pigments with two elongated holes that might originate the escape of pigment particles in the vacuum. The cryo-TEM image in Fig. 3(b), however, clearly shows the pigments that appear as darker elongated spots, due to the larger electron density of the pigment particles compared to PLA. It is seen that the pigments all align parallel to the fiber axis. This is presumably caused by the alignment of the elongated particles along the electric field and by shear flow during the electrospinning process. Fig. 3(c) shows the SEM image of a bundle of fibers. The typical fiber diameter is about 0.5 μm and the mesh size is a few microns. The pigments are not visible. Fig. 3(d) is a POM image of a 150 μm thick 15 wt% pigment-containing fiber mat taken at the lower layer of the collected fibers. The coiling of the fibers is the result of the whipping instability during the electrospinning process.21
The thickness L0 of the fiber mat spun on the collector plate depends on the pumping rate, the spinning time and composition. In order to measure it, a 1 μm resolution Mitutoyo Dial Indicator with magnetic base was used.
The dielectric constant ε of a fiber mats of area A was deduced from the impedance Z measured by a Schlumberger Sl1260 impedance analyzer in the frequency range 40 Hz < f < 10 MHz. Assuming that the fiber mat acts as a simple capacitor, Z = −L0/(2πεε0Af), ε can be obtained from the slope of Z (1/2πf) curve.
2.C. Piezoelectric and Young's modulus measurements of the fiber mats
In order to characterize quantitatively the piezoelectric properties of the pigment based electrospun fiber mats, we followed the procedure described by Morvan et al.12 to measure the converse piezoelectric (electric field induced mechanical strain) response. The collector glass substrate with ITO below the electrospun fiber mat was fixed to the microscope stage and was covered by another glass plate with ITO coating adjacent to the top of the fiber mat. Both the top and bottom ITO layers were electrically connected to electrodes. DC voltages were applied across the fiber mat from a power supply. The amplitude and polarity dependence of the voltage-induced displacement of the top plate was measured by a Leitz Mirau Interferometer. A green filter was utilized to provide a fringe pattern with constant periodicity L (see Fig. 4(a)). A displacement Δd of the top substrate causes a change in the path length of the light beam reflecting from the substrate. Consequently, a horizontal shift by Δx of the fringes occurs. The vertical displacement can be related to the horizontal shift by the relation, Δd = (λ/2)(Δx/L), where λ is the optical wavelength.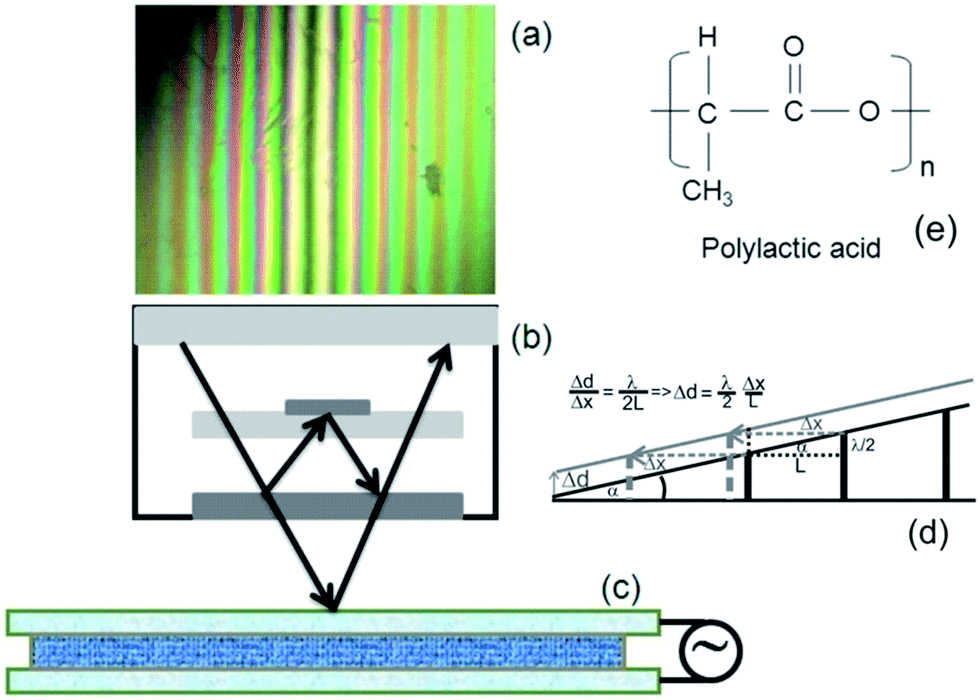 | ||
| Fig. 4 Experimental set-up for electro-mechanical characterization of fiber mats. The Mirau interference patterns (a) are created between a reflection reference mirror in the center of the objective lens (b) and the fiber cell top substrate (c). When the system is focused on the surface, localized interference fringes appear due to the reflected light. The cell compression or an expansion in an external field causes a shift in the interference pattern, which is recorded and analyzed. The molecular structure of PLA is shown on the right (e). | ||
By measuring the downward displacement ΔL of the top plate of area A caused by a known weight w placed on the top plate, we could also measure the Young's Modulus Y of the fiber mat by using the equation: Y = wL0/(ΔLA).
3. Experimental results
The results of the converse piezoelectric measurements are summarized in Fig. 5, where we plotted the displacement of the cover plate of the fiber mats with various pigment concentrations with and without dispersants at the function of applied voltage. The samples without pigment particles show a quadratic dependence of the displacement on the applied voltage (magenta triangles) indicating only electrostriction without a piezoelectric response. The fiber mats containing pigment particles exhibit displacement, which changes sign with the applied voltage indicating a predominantly linear relation between the strain and the applied voltage. The linear responses increase with the pigment concentration and thickness of the mats. The data were fit with a second order polynomial ΔL = aV + bV2 with the linear and quadratic coefficients a and b listed in Table 1, which also contains the measured sample area, thickness, dielectric constant and Young's modulus values. Large errors of the sample thicknesses, as in the 5 wt% sample, are due to thickness variation over the area (uneven thickness). The dielectric constants were found to be the same in the entire frequency range. The errors of the dielectric measurements are due to the uncertainty in the measurement of the film thickness, or due to the thickness variation over the film areas. The low values of the dielectric constant values are consistent with the fact that the majority of the sample is air that has a dielectric constant of unity. The Young moduli of the samples are less than 10 kPa, which is somewhat smaller than found in the BaTiO3-containing fiber mats,12 and are similar to that of biological cell tissues (such as muscles, liver, loin).22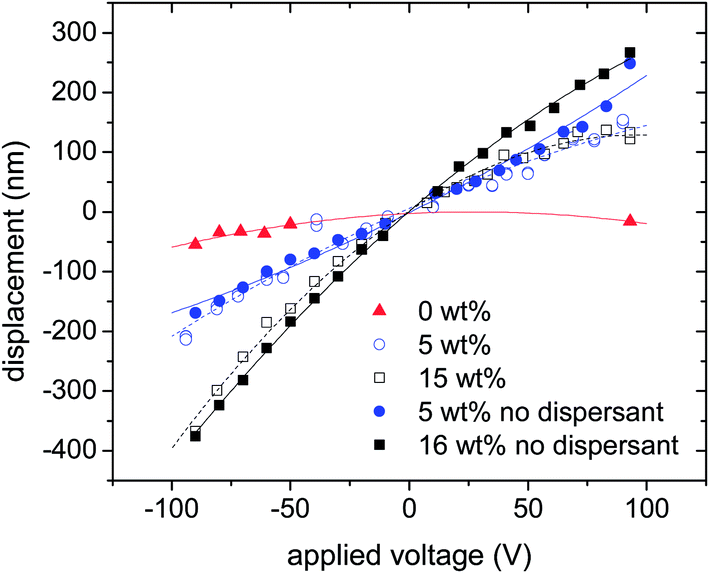 | ||
| Fig. 5 Piezoelectric response of the fiber mats: displacement as a function of applied voltage. Sample codes correspond to the pigment concentration in wt%. Open symbols fitted by dashed lines, solid symbols fitted by solid lines. | ||
| c (wt%) | A (mm2) | L 0 (μm) | ε | Y (kPa) | a (nm V−1) | b (pm V−2) |
|---|---|---|---|---|---|---|
| 0 | 580 | 106 ± 20 | 1.5 | 3.4 ± 0.3 | 0.2 ± 0.2 | 4 ± 1 |
| 5 | 375 | 130 ± 25 | 1.5 | 6.7 ± 0.7 | 1.8 ± 0.2 | 4 ± 1 |
| 15 | 220 | 160 ± 5 | 1.7 | 5.2 ± 0.5 | 2.6 ± 0.2 | 14 ± 1 |
| 5 (no dispersant) | 270 | 78 ± 4 | 1.5 | 6.6 ± 0.7 | 2.0 ± 0.2 | 3 ± 1 |
| 16 (no dispersant) | 200 | 140 ± 5 | 1.9 | 3.9 ± 0.3 | 3.4 ± 0.2 | 7.5 ± 1 |
Table 1 shows that the quadratic responses for the 0 wt% and 5 wt% samples are in the range of 3–4 pm V−1,2 and show a more than twofold increase for the samples with higher pigment concentrations. The quadratic effect is due to the electrostatic attraction stress, σE = εε0E2/2, where ε0 = 8.85 10−12 C V−1 m−1 is the permittivity of the vacuum, and ε is the relative dielectric constant of the material. Equating σE with the elastic stress σY = YΔL/L0, where Y is the compression modulus of the fiber mat, we get ΔL = ε0εV2/(2YL0), which means that the quadratic coefficient is b = ε0ε/(2YL0). Based on the values listed in Table 1, inserting typical values (L0 ∼ 150 μm, ε = 1.5 and Y = 5 kPa) for the thickness, dielectric constant and Young's modulus, we get b ∼ 10 pm V−2, which is of the same order of magnitude we obtained from the quadratic fits. Estimations of b from individual measurements agree with the theoretical prediction only qualitatively. This can be partially explained by a large uncertainty of the thickness, dielectric constant and Young's modulus measurement and may indicate some ionic screening processes. The linear fit parameter, a, corresponds to the piezoelectric charge constant d33, which couples the film thickness change with the voltage applied in the same direction. From the fit values we obtained d33 ∼ 2–3 nm V−1, which is larger than in conventional hard piezoelectric ceramics or polymers,23 and of the same order of magnitude as in the cellular ferroelectrets24 and the electrospun fiber mat containing BaTiO3 particles.10,12 Although the charge constant is not strictly proportional to the pigment concentration, c, it is practically zero without it and increases with the concentration. Comparing the same concentrations with and without the dispersants, we find that the piezoelectric effect is clearly present in the samples with and without the dispersant.
We also attempted to compare the direct piezoelectric response of our pigment-based PLA fiber mat with ferreoelectric barium titanate (BT)-based mats. For this, a simple drop test was used in which a moving striker rod of 2.3 g mass and 0.5 cm2 area was set to a predetermined drop height and released. The contact end of the striker rod had an inelastic putty to prevent bouncing. Upon striking the top of sample, a signal was produced and recorded on an oscilloscope. The peak values of our pigment-based mats were found to be almost an order of magnitude smaller than of the BT containing mat, although the time integral of the voltage were comparable. Most likely this is due to the much smaller young modulus of our mats, which result in slower recovery of the thickness of the mat.
After all these measurements the mats were peeled off and weighed, from which the densities of the mats were determined. The average densities of the fiber mats was found to be 0.14 ± 0.04 g cm−3, showing that the fiber mats are lightweight.
In order to clarify the origin of the piezoelectric effect, we studied the behavior of the colloidal suspensions in response to an electric field. A typical technique to determine the particle polarization and charge is to measure current transients across a thin glass cell filled with the sample material. In the first series of experiments, we applied rectangular waveform to the liquid suspensions of the pigment in dodecane confined in ITO-coated glass cells of various thicknesses. Fig. 6 shows the charge transferred across an ITO cell of an area A = 1 cm2 as a function of the cell thickness. It is seen that the charge is nearly proportional to the cell thickness with an intercept at 8 nC. Three effects may contribute to the current transient behavior: (a) orientation of the particles with permanent dipole moment; (b) motion of charged pigment particles and (c) motion of charged stabilizer molecules (or micelles). As (a) is an extensive parameter and independent of the film thickness, (b) and (c) are intensive parameters and their contributions are proportional to the film thickness. The results in Fig. 6 therefore indicate that a large contribution to the polarization comes from the ionic transport, and the permanent dipole moments contribute only Pp ∼ 8 nC cm−2. Although this contribution is relatively small, it indicates the presence of permanent dipole moments of the pigment particles.
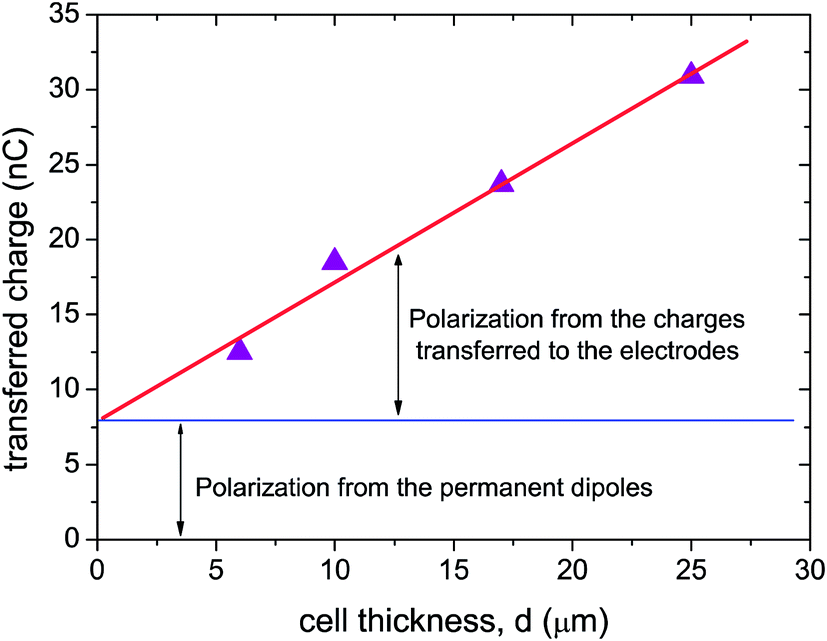 | ||
| Fig. 6 Charge transferred across an ITO cells filled with 15 wt% suspension as a function of the cell thickness. The charge was measured by applying a square-wave voltage Epp = 2.4 V μm−1, f = 2.0 Hz. Switched polarization is proportional to the transferred charge. | ||
In order to distinguish between the ionic contributions of the particles and the surfactant, detailed studies of the transient currents were made. Fig. 7 compares the current transients in 10 μm thick samples with different amounts of stabilizer. The current shows a transient behavior on a scale of 1 s followed by a quasi-steady part. This behavior is typical for non-polar liquids.18 It is seen that the reduction of the amount of the stabilizer significantly reduces the current (and the total charge transferred between the electrodes). It indicates that the stabilizer charge is responsible for the largest part of the current response. Only a small part of the ionic current originates from the pigment particles.
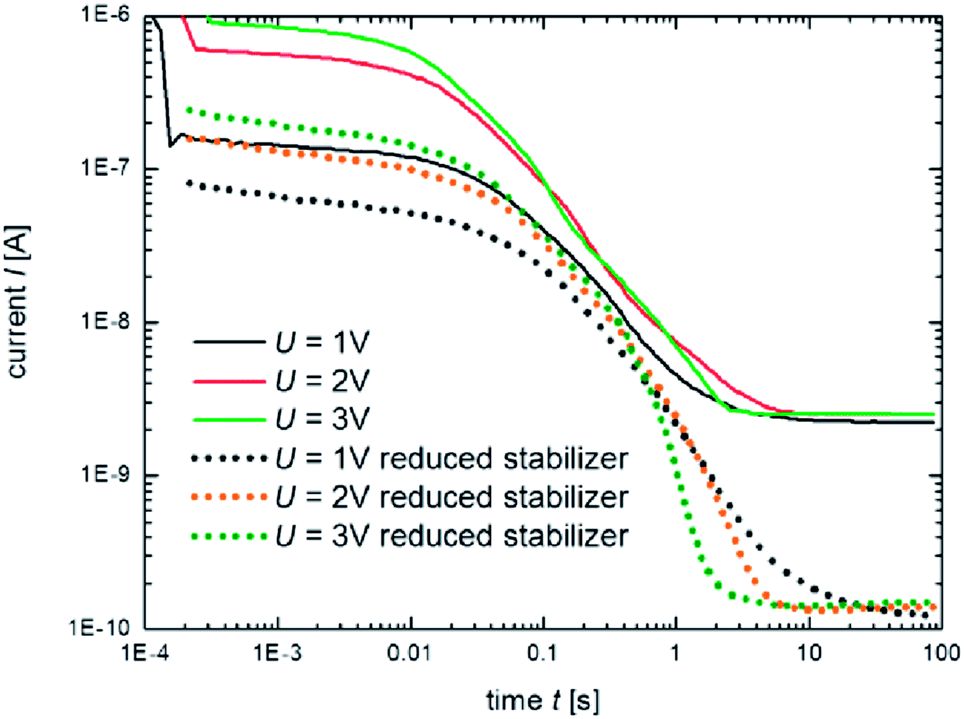 | ||
| Fig. 7 Comparison of current transient of 5 wt% suspension with reduced amount of stabilizer. Waveform: step from 0 V to +U, cell thickness 10 μm. | ||
To study the electric field induced reorientation of the particles, light transmission in 1 wt% and 5 wt% samples was investigated. Due to the dichroic character of the pigment particles the absorption by the particles is lower when they align along the incident light direction. A square waveform voltage was applied across the cell perpendicular to the substrate. A clear shift of the transmission was found under the action of an electric field (Fig. 8 at t = 1 s). Under sign inversion of the field only a transient decrease of the transmission could be seen. Since the lowest transient transmission values are smaller than of the zero field transmission, we think they indicate light scattering related to a flow of the particles associated with the charge transport at sign reversal.
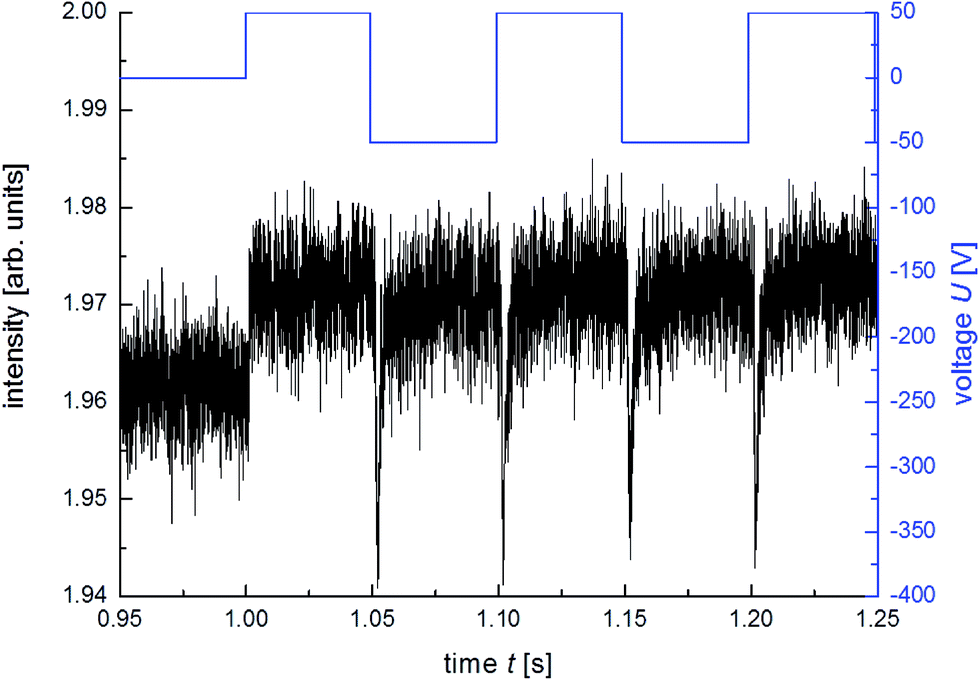 | ||
| Fig. 8 Transmission change in response to a square-wave electric field (1 wt% suspension, cell thickness 10 μm). | ||
The offset of the transmission curve under the field may indicate the tendency of the particles to align along the field direction. This is in agreement with our earlier polarizing microscopy observations, where small DC fields resulted in a reduction of the sample birefringence.1
4. Discussion
The experimental data on the electrospun fiber mats show that the pigment particles are responsible for the piezoelectric behavior. This suggests that the pigment particles may have a residual polarization, i.e. they are polar. To get an estimate of the value of the polarization, we start out from the definition of the charge constant, namely d33 = ΔL/V, and we utilize that the stress induced by the applied voltage is σ = PnE ≈ PnV/L0, where Pn is the net polarization of the film. This stress results in a strain ΔL/L as σ = YΔL/L, where Y is the Young modulus of the fiber mat. This yields d33 = Pn/Y. With Y ∼ 5 kPa and d33 ∼ 2 nm V−1 = 2 nC N−1, we obtain Pn = 104 nC m−2 = 1 nC cm−2. This macroscopic polarization may have an electrostatic origin related to the electrospinning process, or could be related to the residual polarization of the individual particles revealed by direct electric current measurements. The fact that Pn < Pp does not rule out this latter possibility, even though it is very difficult to relate the dipoles of the individual particles to the net polarization of a complex fiber mat. The polarity of the individual pigment molecules may be related to a non-centrosymmetric crystalline structure that allows a polar symmetry. Alternatively, dipole moments may occur due to a strain-induced polarization of the particles, which were subject to the milling process. Residual strain was shown to be responsible for the polarization stability of the single-domain BaTiO3 particles25 that also form piezoelectric fiber mats in similar conditions.12 Clearly, more studies are needed to understand the reason for the polarization.In conclusion, we demonstrated piezoelectric behavior of electrospun fiber mats containing anisometric pigment nanoparticles Novoperm Carmine HF3C. This finding along with electric current transient measurements suggest that the pigment particles posses a residual polarization. Our studies showed that these particles may be utilized to make colorful electro-active fiber mats that might find applications in wearable and smart clothing.
Acknowledgements
We thank N. Mantzel (IWF, OvGU Magdeburg) for SEM measurements and Prof. Yu. Reznikov (Inst. of Physics, NASU) for fruitful discussions. Financial support was provided by the German Academic Exchange Service (project no. 56038231), the DFG SPP 1681 (project no. STA 425/36-1), and Ohio Development Services Agency. The authors would like to acknowledge European Cooperation in Science and Technology (Action IC1208) for financial support of K. May.References
- A. Eremin, R. Stannarius, S. Klein, J. Heuer and R. M. Richardson, Adv. Funct. Mater., 2011, 21, 402 CrossRef.
- R. J. Greasty, R. M. Richardson, S. Klein, D. Cherns, M. R. Thomas, C. Pizzey, N. Terrill and C. Rochas, Philos. Trans. R. Soc., A, 2013, 371, 20120257 CrossRef PubMed.
- J. Curie and P. Curie, Bull. soc. min. de France, 1880, 3, 294–295 Search PubMed.
- B. M. Wul and I. M. Goldman, J. Phys., 1946, 49, 179–182 Search PubMed.
- W. Heywang, K. Lubitz and W. Wersing, Piezoelectricity: evolution and future of a technology, Springer Verlag, Berlin, Heidelberg, 2008 Search PubMed.
- S. Roberts, Phys. Rev., 1947, 71, 890 CrossRef CAS.
- P. Pieranski, E. Guyon and P. Keller, J. Phys., 1975, 36, 1005–1010 CAS.
- A. Jákli, L. Bata, A. Buka, N. Eber and I. Jánossy, J. Phys., Lett., 1985, 46, 759–761 CrossRef.
- N. Kawai, Jpn. J. Appl. Phys., 1996, 8, 975–976 CrossRef.
- M. Varga, J. Morvan, N. Diorio, E. Buyuktanir, J. Harden, J. L. West and A. Jákli, Appl. Phys. Lett., 2013, 102, 153903 CrossRef PubMed.
- T. Ikeda, Fundamentals of Piezoelectricity, Oxford University Press, 1990 Search PubMed.
- J. Morvan, E. Buyuktanir, J. L. West and A. Jákli, Appl. Phys. Lett., 2012, 100, 063901 CrossRef PubMed.
- J. Lekkala, R. Poramo and K. Nyholm, Med. Biol. Eng. Comput., 1996, 34, 67 Search PubMed.
- G. M. Sessler and J. Hillenbrand, Appl. Phys. Lett., 1999, 75, 3405–3407 CrossRef CAS PubMed.
- S. Bauer, R. Gerhard-Multhaupt and G. M. Sessler, Phys. Today, 2004, 57, 37–43 CrossRef CAS PubMed.
- C. Huang, S. Chen, C. Lai, D. H. Reneker, H. Qiu, Y. Ye and H. Hou, Nanotechnology, 2006, 17, 1558–1563 CrossRef CAS.
- D. H. Reneker and A. L. Yarin, Polymer, 2008, 49, 2387–2425 CrossRef CAS PubMed.
- K. Neyts, F. Beunis, F. Strubbe, M. Marescaux, B. Verboven, M. Karvar and A. Verschueren, J. Phys.: Condens. Matter, 2010, 22, 494108 CrossRef PubMed.
- J. Doshi and D. H. Reneker, J. Electrost., 1995, 35, 151–160 CrossRef CAS.
- H. Fong, I. Chun and D. H. Reneker, Polymer, 1999, 40, 4585–4592 CrossRef CAS.
- A. L. Yarin, S. Koombhongse and D. H. Reneker, J. Appl. Phys., 2001, 90, 4836 CrossRef CAS PubMed.
- V. Egorov, S. Tsyuryupa, S. Kanilo, M. Kogit and A. Sarvazyan, Med. Eng. Phys., 2008, 30, 206–212 CrossRef CAS PubMed.
- T. Karaki, K. Yan, T. Miyamoto and M. Adachi, Jpn. J. Appl. Phys., 2007, 46, L97–L98 CrossRef CAS.
- X. Zhang, G. M. Sessler and J. Hillenbrand, J. Electrost., 2007, 65, 94–100 CrossRef CAS PubMed.
- G. Cook, J. L. Barnes, S. A. Basun, D. R. Evans, R. F. Ziolo, A. Ponce, V. Y. Reshetnyak, A. Glushchenko and P. P. Banerjee, J. Appl. Phys., 2010, 108, 064309 CrossRef PubMed.
| This journal is © The Royal Society of Chemistry 2014 |