Robin J. Shannona,
Christophe Cossoubc,
Jean-Christophe Loisonde,
Philippe Caubetde,
Nadia Balucanif,
Paul W. Seakinsag,
Valentine Wakelambc and
Kevin M. Hickson*de
aSchool of Chemistry, University of Leeds, Leeds, LS2 9JT, UK
bUniversité de Bordeaux, Laboratoire d'Astrophysique de Bordeaux, UMR 5804, F-33270 Floirac, France
cCNRS, Laboratoire d'Astrophysique de Bordeaux, UMR 5804, F-33270 Floirac, France
dUniversité de Bordeaux, Institut des Sciences Moléculaires, UMR 5255, F-33400 Talence, France. E-mail: km.hickson@ism.u-bordeaux1.fr; Tel: +33 5 40 00 63 42
eCNRS, Institut des Sciences Moléculaires, UMR 5255, F-33400 Talence, France
fDipartimento di Chimica, Biologia e Biotecnologie, Universita' degli Studi di Perugia, 06123 Perugia, Italy
gNational Centre for Atmospheric Science, University of Leeds, Leeds, LS2 9JT, UK
First published on 6th June 2014
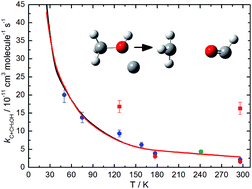
Rate constants for the C(3P) + CH3OH reaction have been measured in a continuous supersonic flow reactor over the range 50 K ≤ T ≤ 296 K. C(3P) was created by the in situ pulsed laser photolysis of CBr4, a multiphoton process which also produced some C(1D), allowing us to investigate simultaneously the low temperature kinetics of the C(1D) + CH3OH reaction. C(1D) atoms were followed by an indirect chemiluminescent tracer method in the presence of excess CH3OH. C(3P) atoms were detected by the same chemiluminescence technique and also by direct vacuum ultra-violet laser induced fluorescence (VUV LIF). Secondary measurements of product H(2S) atom formation have been undertaken allowing absolute H atom yields to be obtained by comparison with a suitable reference reaction. In parallel, statistical calculations have been performed based on ab initio calculations of the complexes, adducts and transition states (TSs) relevant to the title reaction. By comparison with the experimental H atom yields, the preferred reaction pathways could be determined, placing important constraints on the statistical calculations. The experimental and theoretical work are in excellent agreement, predicting a negative temperature dependence of the rate constant increasing from 2.2 × 10⁻¹¹ cm3 molecule−1 s−1 at 296 K to 20.0 × 10⁻¹¹ cm3 molecule−1 s−1 at 50 K. CH3 and HCO are found to be the major products under our experimental conditions. As this reaction is not considered in current astrochemical networks, its influence on interstellar methanol abundances is tested using a dense interstellar cloud model.
Gas-phase methanol CH3OH, is observed throughout the interstellar medium and is present under a wide range of physical conditions.11–13 Methanol can be formed directly in the gas-phase through a mechanism initially involving a radiative association reaction followed by dissociative recombination
| CH3+ + H2O → CH3OH2+ + photon |
| CH3OH2+ + e−→ CH3OH + H |
Observations of ground state atomic carbon by emission spectroscopy through its ground state fine structure line emission at 492 GHz (ref. 20 and 21) indicate that it could be one of the most abundant species in dense interstellar clouds so that current models22 adopt peak gas-phase C(3P) abundances equal to 10−4–10−5. Given the low reactivity of CH3OH towards other abundant interstellar species such as He, H, N, O, H2 and CO, the reaction between C and CH3OH could represent the major loss process for interstellar methanol were it found to occur rapidly at low temperature.
A recent quantum chemical investigation,23 at the CCSD(T)/cc-pVTZ level of theory, of the pathways involved in the C(3P) + CH3OH system, predicted that reaction occurs through the formation of one of two initial van der Waals complexes CH3O(C)H or (C)CH3OH formed by addition of atomic carbon to either the oxygen atom or the carbon atom of CH3OH respectively. The former complex was found to be lower in energy than the reagents (−47 kJ mol−1) with the latter being above the reagent level (+6 kJ mol−1). These complexes could then evolve through TSs which were all predicted to be higher in energy than the reagent level for all possible exit channels so that back dissociation of the complex was thought to be the major outcome at low temperatures. Nevertheless, two of the exit channels from the CH3O(C)H complex are seen to have TS energies only slightly higher than the reagent level taking into account zero point energy; one leading directly to the formation of bimolecular products CH3 + COH (TS energy +22 kJ mol−1) with the other resulting in the formation of an adduct CH3OCH (TS energy +5 kJ mol−1). The exit channel from the (C)CH3OH complex was predicted to lead to the CHCH2OH adduct through a TS only 1 kJ mol−1 higher than the reagent level.
Given the low energies of the exit TSs from the (C)CH3OH and CH3O(C)H van der Waals complexes and the high uncertainty generally associated with such calculations, further experimental and theoretical investigation of this reaction is warranted. Here we present the results of a combined experimental and theoretical study of this reaction. Experimentally, a supersonic flow reactor using pulsed laser photolysis for C(3P) production coupled with both direct laser induced fluorescence and indirect chemiluminescence detection was used to follow the kinetics of C(3P) loss in the presence of an excess of CH3OH over the 50–296 K range. In addition, secondary measurements of the formation of H atom co-products were also performed to elucidate the preferred reaction pathways. Theoretically, the experimental results are complemented by statistical calculations of the reaction using the MESMER (Master Equation Solver for Multi Energy Well Reactions) code to predict the low temperature rate constants and product branching ratios of the title reaction.24–26 MESMER utilizes the energies and structures of transition states and complexes calculated by quantum chemical calculations specifically undertaken for the present investigation.
| Laval nozzle | Mach2 (N2/SF6) | Mach2 N2 | Mach2 N2 (N2/Ar) | Mach2 N2 (using Ar) | Mach3 Ar | Mach4 Ar |
|---|---|---|---|---|---|---|
| a The errors on the Mach number, temperature and mean flow velocity, cited at the level of one standard deviation from the mean are calculated from separate measurements of the impact pressure using a Pitot tube as a function of distance from the Laval nozzle and the stagnation pressure within the reservoir.b Mole fraction N2/SF6 = 0.4/0.6. | ||||||
| Mach number | 2.1 ± 0.01a | 1.8 ± 0.02 | 1.9 ± 0.02 | 2.0 ± 0.03 | 3.0 ± 0.1 | 3.9 ± 0.1 |
| Carrier gas | (N2/SF6)b | N2 | (N2/Ar) | Ar | Ar | Ar |
| Density (× 1016 cm−3) | 9.0 | 9.4 | 10.4 | 12.6 | 14.7 | 25.9 |
| Impact pressure (Torr) | 11.5 | 8.2 | 9.1 | 10.5 | 15.3 | 29.6 |
| Stagnation pressure (Torr) | 18.6 | 10.3 | 12.0 | 13.9 | 34.9 | 113 |
| Temperature (K) | 241 ± 1 | 177 ± 2 | 158 ± 2 | 127 ± 2 | 75 ± 2 | 50 ± 1 |
| Mean flow velocity (ms−1) | 282 ± 2 | 496 ± 4 | 456 ± 4 | 419 ± 3 | 479 ± 3 | 505 ± 1 |
C(3P) atoms were generated by the pulsed multiphoton dissociation of CBr4 molecules using unfocused 266 nm radiation with ∼23 mJ of pulse energy. The photolysis laser was aligned along the supersonic flow, to create a column of carbon atoms of uniform density. CBr4 was entrained in the flow by passing a small amount of carrier gas over solid CBr4 held at a known pressure. An upper limit of 2 × 10¹³ molecule cm−3 was estimated for the gas-phase concentration of CBr4 in the experiments from its saturated vapour pressure at room temperature.
Methanol was introduced into the flow upstream of the Laval nozzle using a controlled evaporation mixing (CEM) system. A 1 litre reservoir containing methanol was held at a pressure of 2 bar relative to atmospheric pressure. It was connected to one of two different liquid flow meters to allow flows of between 0.1 and 5 g h−1 or between 0.02 and 1 g h−1 of liquid methanol to be passed into an evaporation device heated to 353 K. A fraction of the main carrier gas flow (Ar or N2) was introduced into the CEM through another mass flow controller, carrying methanol vapour into the reactor. To determine the gas-phase methanol concentration, the CEM output passed through a 10 cm absorption cell held at room temperature. The 185 nm line of a mercury pen-ray lamp was used to determine the gas-phase methanol absorption in the cell. The transmitted intensity was measured alternately in the presence and absence of methanol vapour to yield values of the attenuated and non-attenuated intensities, I and I0 respectively using a solar blind channel photomultiplier tube (CPM) operating in photon counting mode with a spectral response in the 115–200 nm range. Typically, the number of photons falling on the CPM per second was recorded at one second intervals throughout the entire duration of the kinetic measurement. The same procedure was used in the absence of methanol to obtain I0 both before and after the kinetic measurement to assess the magnitude of any potential variations of the lamp intensity. Unfortunately, it was also observed that the detector was slightly sensitive to short wavelength UV photons, although methanol itself has a negligible absorption cross-section at wavelengths greater than 220 nm. As the 254 nm mercury line is very much more intense than the 185 nm one, the measured values of I and I0 therefore contained a significant constant contribution from 254 nm photons. Consequently, calibration measurements were performed on a daily basis to evaluate the 254 nm contribution to the main experiments. During these calibrations a fixed methanol vapour flow was introduced into the absorption cell and values of I were recorded over a range of pressures (I0 remained constant). The gas-phase methanol concentrations calculated from the measured I and I0 values using the absorption cross-section of methanol vapour at 185 nm (6.05 × 10⁻¹⁹ cm2)30 and the Beer–Lambert law were then plotted against the total pressure and different trial values for the constant were subtracted from both I and I0 values until the methanol concentration versus total pressure plot yielded a straight line that passed through the origin. This correction factor, which represented approximately 47% of the total unattenuated intensity was then subtracted from all of the I and I0 values recorded during the experiments.
The output of the cell was connected to the CRESU reactor using a heating hose maintained at 353 K to avoid condensation. As the methanol vapour was diluted by at least a factor of five on entering the room temperature nozzle reservoir through mixing with the main carrier gas flow, we assume that no supplementary condensation losses occurred upstream of the Laval nozzle. In this way, gas-phase methanol concentrations as high as 6.6 × 10¹⁴ molecule cm−3 could be obtained in the cold flow.
The temporal profile of atomic carbon was followed using two different methods. In earlier experiments, C(3P) was detected indirectly by chemiluminescent emission of NO through its highly exothermic reaction with NO2 added to the flow
| C(3P) + NO2 → CO + NO, ΔHr = −769 kJ mol−1 |
The NO2 concentration was constant for any single series of measurements with a maximum estimated value of 5 × 10¹³ molecule cm−3. As the NO molecules (denoted NO*) are produced over a range of electronic states with transitions corresponding to the γ, β, δ and ε bands from 220–450 nm,31 we chose to observe NO* emission occurring in the 300–400 nm range (corresponding mostly to transitions originating in the β B2Πr – X2Πr band) using a bandpass filter and a UV sensitive photomultiplier tube (PMT). NO* detection allowed us to trace the entire C(3P) temporal profile for each individual laser shot, drastically reducing the time required for signal acquisition. The time dependent chemiluminescence signals consisted of 1000 time points acquired by a 500 MHz digital oscilloscope. The signal was averaged over 768 photolysis laser cycles for each kinetic decay, the characteristic decay time for each trace depending on the methanol concentration in the supersonic flow. The measurements were then repeated for a range of excess methanol concentrations at different temperatures.
In later experiments, C(3P) was detected directly through on-resonance VUV LIF using the 2s22p2 3P2 → 2s22p3d 3D30 transition at 127.755 nm and a solar blind PMT operating in pulsed mode coupled to a boxcar integration system through a fast preamplifer. For this purpose, a Nd:YAG pumped dye laser operating at 766.5 nm was frequency doubled in a type I beta barium borate crystal to produce UV radiation at 383.3 nm. The resulting UV beam was then steered and focused into a cell containing 30 Torr of xenon gas mounted at the level of the reactor observation axis, perpendicular to both the supersonic flow and the PMT. The tunable VUV radiation produced by third harmonic generation of the UV beam was collimated by an MgF2 lens positioned at the exit of the cell before interacting with the cold carbon atoms in the supersonic flow.
Given the multiphotonic nature of the CBr4 photodissociation process, it was also possible that carbon atoms in the first excited state, C(1D), could be produced (C(1D) is only 122 kJ mol−1 higher than C(3P) with each 266 nm photon providing 450 kJ mol−1 of energy) which might interfere with measurements of the ground state carbon atom reactions. In order to check for C(1D) production, two different methods were employed. Firstly, we attempted to detect C(1D) directly through its 2s22p2 1D2 → 2s22p7d 1F30 transition at 127.498 nm using the VUV generation method described above. Although some fluorescence was observed over a longer timescale to the C(3P) one, the signal was too weak to be able to perform quantitative measurements (this transition has an Einstein A coefficient which is 10 times weaker than the one used to detect C(3P)32). Secondly, as C(3P) atoms are unreactive with molecular hydrogen at low temperature, whereas C(1D) atoms react rapidly to produce CH and H,33 we performed a series of test experiments whereby H2 was added to the supersonic flow in the absence of other coreagent species to check for H atom formation. In these experiments, the frequency tripling setup described above was adapted, using a fundamental dye laser wavelength of 729.4 nm coupled with 45 Torr of krypton in the tripling cell to detect H(2S) atoms by VUV LIF via the Lyman α transition at 121.567 nm. H atom production was observed, confirming that the 266 nm photolysis of CBr4 results in at least some C(1D) formation. The C(1D)/C(3P) ratio was determined by comparing relative product H atom yields from the C(1D) + H2 and C(3P) + methylacetylene, C3H4, reactions. The C(3P) + C3H4 reaction is known to produce atomic hydrogen at room temperature at the 0.85 ± 0.07 level.34 In this case, we considered that the H atom branching ratio from the C(3P) + C3H4 reaction did not change at 127 K and that the corresponding C(1D) + C3H4 reaction also yielded 100% H atoms. This latter assumption was verified by test experiments in which identical H atom intensities from the C(3P)/C(1D) + C3H4 reactions were recorded in the presence and absence of a large excess H2 concentration ([H2] ≥ 3.2 × 10¹⁴ molecule cm−3), allowing us to check that all of the C(1D) was converted to atomic hydrogen in both cases. The C(1D)/C(3P) ratios were determined to be (0.15 ± 0.04) and (0.10 ± 0.02) at 296 K and 127 K respectively, both values representing weighted averages of five individual ratio measurements. Subsequent test measurements to check for potential interferences in the main experiments from C(1D) reactions or relaxation back to the ground state are outlined in the kinetic results section.
The H atom VUV LIF setup was also used in secondary experiments performed at 127 K and 296 K investigating H(2S) formation from the C(3P)/C(1D) + CH3OH reactions. As before, test experiments of these reactions were performed in the presence and absence of excess H2, allowing us to evaluate the H atom yield from the C(1D) + CH3OH reaction to be approximately 100%. The H atom fluorescence signals from the C(3P)/C(1D) + CH3OH and C(3P)/C(1D) + C3H4 reactions were thus compared to obtain the H atom yield from the C(3P) + CH3OH reaction. The results of the H atom yield measurements which are presented in the product branching ratio section provided important constraints for the statistical calculations.
VUV LIF signals from the reagent C(3P) (or product H(2S)) atoms were recorded as a function of delay time between photolysis and probe lasers. For a given excess coreagent (H2, CH3OH or C3H4) concentration, 30 datapoints were accumulated at each time interval with temporal profiles consisting of a minimum of 49 time intervals. Several time points were also recorded by firing the probe laser before the photolysis laser to establish the pre-trigger baseline value. This procedure was repeated several times for each value of the coreagent concentration producing a minimum of 23 individual decay profiles for each temperature. Both the LIF and chemiluminescence intensities were measured at a fixed distance from the Laval nozzle; the chosen distance corresponding to the maximum displacement from the nozzle possible whilst still maintaining optimal flow conditions so that the decays could be exploited over as large a time period as possible.
All gases were flowed directly from cylinders with no further purification prior to usage (Linde: Ar 99.999%, SF6 99.999%, Kr 99.99%, Xe 99.95%; Air Liquide: N2 99.999%, NO2/He 5%). The carrier gas and precursor flows were all passed into the reservoir via digital mass flow controllers. The controllers were calibrated using the pressure rise at constant volume method for the specific gas used.
![]() | ||
| Fig. 1 Potential energy diagram for the C(3P) + methanol reaction on the triplet surface calculated at the M06-2X/cc-pVQZ level. See Table S1† for the relative energies. The TS1, TS3 and TS4† energies were adjusted during the Master Equation calculations (for details see text). | ||
The C(3P0,1,2) + CH3OH(1A′) reaction leads to 3 surfaces in the entrance valley, one 3A′ surface and two 3A′′ surface when the C atom approaches in Cs geometry or 3 3A′ surfaces when the carbon atom approaches in C1 geometry (no symmetry). All further calculations were performed with C1 symmetry. At the CASPT2 level with CASSCF geometry optimized for non-relaxed CH3OH, only the first surface is attractive, leading to two different van der Waals complexes. The first complex (complex1) where the carbon atom is attached to the oxygen atom is strongly bound with a C–O bond length between 1.69 Å and 2.11 Å depending on the method used. The second complex (complex2), found only at the DFT and CCSD(T) levels, is closer in energy to the reagent level, the carbon atom being bound to an hydrogen atom of the methanol CH3 group with a C–H bond length close to 1.5 Å. It should be noted that complex2 could not be found using the CASSCF method. Further evolution of complex1 leads to a 3CH3OCH adduct through TS1 corresponding to C insertion into the O–H bond, or directly to CH3 + HOC products through TS3. Complex2 leads to the CHCH2OH adduct through TS4 corresponding to C insertion into the C–H bond. We did not examine the potential for insertion into the C–O bond as previous calculations have found that these pathways are characterized by transition states at much higher energies.23 It is worth noting that C insertion into the O–H and C–H bonds have similar TS energies, close to the entrance level at the CCSD(T)/avtz level. Moreover, the TS1 and TS4 energies are very different from the corresponding TSs for insertion of a carbon atom into the C–H bond for the C + CH4 reaction (barrier calculated to be +51 kJ mol−1 at the CCSD(T)/6-311G level36) and also for the O–H insertion of a carbon atom for the C + H2O reaction barrier calculated to be +30 kJ mol−1 at the CCSD(T)/vtz level.37
As shown in Table S1,† the calculated complex and TS energies are very method dependent, for example varying by 81 kJ mol−1 for TS4.† Our results are in agreement with previous calculations23 as well as with expectations on the accuracy of the methods. Indeed, as shown by Wagner,38 DFT methods usually underestimate energy barriers (even if the M06-2X functional leads to results in better agreement with experimental data than B3LYP). The reaction enthalpy, ΔHr, for the CH3 + HCO exit channel calculated at the M06-2X level is in very good agreement with thermochemical data39 (−326 kJ mol−1 in both cases). In contrast, MRCI methods usually overestimate energy barriers whereas CASPT2 calculations are likely to underestimate them (for example MCQDPT2 calculations lead to lower complex and TS energies than CCSD(T) methods for the C + H2O reaction40). In this case, RCCSD(T) and RCCSD(T)-F12 methods should lead to the more accurate values considering the T1 and D1 diagnostic values41,42 in agreement with the fact that CASSCF calculations lead to mono-configurational wavefunctions. The calculated TS energies themselves are expected to have large associated uncertainties (while it is difficult to provide a precise estimate, the TS energies could be as much as 10 kJ mol−1 higher or lower than the calculated value). The uncertainties on the well depth energies of complex1 and complex2 should be somewhat smaller than the TS one.
For all species, external rotations were considered to be rigid rotors whilst most vibrational modes were treated as harmonic oscillators. However there were a number of large amplitude torsions in the current work which were treated as separable hindered rotations. For these motions, torsional potentials were obtained through fully relaxed scans about the corresponding dihedral angle using the M06-2X/6-31+G** level of theory. Using discrete points from these potentials, energy levels for the hindered rotations were calculated using MESMER as previously described.24
For the current calculations a grain size of 50 cm−1 was used above 150 K though this was reduced to a value as low as 10 cm−1 at the lowest temperatures. Harmonic frequencies and rotational constants were taken from the M06-2X/cc-pVQZ calculations but given the large range of energies for the stationary points between the different levels of theory used here, some of the energies were varied during the master equation calculation as will be discussed in the results and discussion section. In preliminary calculations it was found that treating the reactions via TS1, TS3 and TS4 as irreversible introduced less than 0.01% error into the calculations. As such, the post transition state adducts were treated as sinks for the majority of the calculations.
This system includes two bimolecular source terms corresponding to the associations of C(3P) and CH3OH to form complex1 and complex2. For these two barrierless reaction steps, an inverse Laplace transform (ILT) method45 was used to convert high pressure limiting canonical rate constants for the association into microcanonical rate coefficients assuming the Arrhenius form:
In initial master equation calculations a temperature independent capture rate of 2.5 × 10⁻¹⁰ cm3 molecule−1 s−1 was assumed for both associations. However, as will be discussed, from these initial calculations combined with the experimental data, it became apparent that the product channel via complex1 and TS1 was the dominant one. In light of this, more detailed variational calculations were performed to give an a priori determination for the high pressure limiting capture rate to form complex1. These calculations were performed using the multifaceted variable reaction coordinate (VRC) methodology,46,47 as implemented in Polyrate 2008.48 Such calculations require a large amount of potential information to obtain sums of states for the transitional modes in the C(3P) + CH3OH association through phase space integration and this information was obtained through “on the fly” calculations at the M06-L/6-31G* level of theory using the Gaussian09 software package interfaced with Polyrate using Gaussrate 2009-A.49 In these calculations, a total of three pivot points were used. One was centred upon C(3P) and the other two were centred upon the O and H atoms of the methanol hydroxyl group.
Test experiments (described in the experimental section) showed that the C(1D) + C3H4 reaction resulted in an atomic hydrogen yield of approximately 100%. Similar test measurements performed on the C(3P)/C(1D) + CH3OH system in the presence and absence of a large excess of H2 also showed that the H atom signal did not change, indicating that the H atom yield of the C(1D) + CH3OH reaction is also approximately 100% within the experimental uncertainties. It can be seen from Fig. 2 that the long-time part of the H atom product trace for the C(3P)/C(1D) + CH3OH reaction (shown in red) decays more slowly than the corresponding H atom traces for the corresponding C(3P)/C(1D) + C3H4 and C(1D) + H2 reactions. This effect can almost certainly be attributed to the slow decomposition of product HCO to H + CO during the timescale of the experiment. While this secondary H atom production leads to a slight overestimation of the primary H atom signal amplitude, it is somewhat offset by fitting to the slower long-time decay leading to a smaller H-atom signal at time zero. As a result, it is expected that this effect should not lead to significant errors in the H-atom yield from the C(3P) + CH3OH reaction. The relative H atom yields from the C(3P) + CH3OH reaction were obtained from the following expression
| HC+CH3OH − HC(1D)+H2/((HC+C3H4 − HC(1D)+H2)/0.85) |
Considering only the black channel in Fig. 1, the VRC calculations predict a modest negative temperature dependence of the capture rate with a value of 1.6 × 10⁻¹⁰ cm3 molecule−1 s−1 at 300 K increasing to 2.0 × 10⁻¹⁰ cm3 molecule−1 s−1 at 50 K. It is noted that these VRC calculations have relatively large uncertainties, and when comparing initial theoretical results with the experimental data, it was found that the agreement between the two datasets was improved when the negative temperature dependence of the capture step was increased. In light of this effect, the ILT A factor was set to 1.6 × 10⁻¹⁰ cm3 molecule−1 s−1 at 300 K whilst the n∞ parameter was allowed to vary between −0.5 and −0.1 in order to fit the experimental data. Given the large range of barrier heights obtained for TS1 at the different levels of theory used in this study, this value was also varied in order to give a “best fit” barrier height. Calculations were performed using both the M06-2X and CCSD(T)-F12 values for the energy of complex1.
When using the M06-2X well depth of −69 kJ mol−1 the master equation calculations begin to predict substantial formation of stabilised complex1. In order to keep the amount of stabilised complex1 below 5%, consistent with the temperature dependence of the experimental H atom yields, the energy transfer parameter 〈ΔEdown〉 was set to 35 cm−1. For consistency, the same value was used for the calculations with the CCSD(T) well depth though it is noted that these calculations are relatively insensitive to changes in 〈ΔEdown〉 and doubling the value of 〈ΔEdown〉 to 70 cm−1 resulted in only a 1% increase in the theoretical rate constant at 50 K.
Methanol was held in large excess with respect to atomic carbon for all experiments so that simple exponential fits to the temporal profiles should have yielded pseudo-first-order rate constants (k1st) for the C + CH3OH reaction directly. Nevertheless, Fig. 3 clearly shows that fits to NO* chemiluminescence decays were biexponential, containing a fast early time component representing a large fraction of the signal amplitude with a slower component at longer times. As C(1D) atoms are also formed in the flow by CBr4 photolysis at the 10–20% level with respect to C(3P), the early time NO* signal originates from the C(1D) + NO2 → CO + NO reaction. Indeed, the NO* yield from the excited state reaction appears to overwhelm the NO* signal from the ground state one. Although the C(3P) and NO2(2A1) reactants correlate with NO(B2Πr) and CO(X1Σ+) products in Cs symmetry, by far the most likely (exothermic) products are the ground state ones NO(X2Πr) and CO(X1Σ+) (544 kJ mol−1 lower in energy than the NO(B2Πr) and CO(X1Σ+) products). In contrast, C(1D) and NO2(2A1) reactants correlate to the excited state NO(A2Σ+/B2Πr) and CO(X1Σ+) products (the B2Πr and A2Σ+ states of NO are separated by only 15 kJ mol−1) so that we would expect a much larger fraction of NO(B2Πr) state formation.31 Consequently, the fast decaying part of the chemiluminescence trace thus followed the sum of C(1D) losses through the reactions of C(1D) with both NO2 and CH3OH in addition to its losses by relaxation. As NO2 was constant for any series of measurements and C(1D) relaxation was dominated by collisions with the carrier gas which was also constant, any change in the k1st value was thus due to reaction with methanol. At 296 K, the two exponential parts of the kinetic decay are essentially decoupled; the rate constant for the C(1D) + methanol reaction is clearly substantially larger than the C(3P) + methanol one allowing us to extract rate constants for both the ground and excited state carbon reactions. Below 127 K, however, the situation was quite different. Here, the two decays occurred on very similar timescales (incidentally indicating that the rates for the two reactions converge at lower temperature) so that it was no longer possible to decouple the two constituent processes. As a result, it was not possible to use the chemiluminescence detection method at temperatures lower than 127 K to extract rate constants. No attempt was made to extract the C(3P) + CH3OH reaction rate constant by chemiluminescence at 127 K as this involved analysis of the weak signal in the tail of the decay profiles. Moreover, little or no biexponential behavior was observed in chemiluminescence measurements recorded with the 177 K N2 nozzle, indicating that N2 acts as a more efficient quencher of C(1D) than argon. As a result it was not possible to follow C(1D) kinetics with nitrogen based flows. Conversely, kinetic decays could be obtained using the direct C(3P) VUV LIF detection method at all temperatures and with all carrier gases. In contrast to the chemiluminescence measurements these profiles are seen in Fig. 3 to be well described by single exponential decays.
A range of methanol concentrations was used at each temperature (measurements were also performed in the absence of methanol) and the resulting k1st values were plotted against the corresponding methanol concentration. Examples of such plots are shown in Fig. 4 with their slopes (weighted by the statistical uncertainties of individual k1st values) yielding rate constants for the C(3P)/C(1D) + CH3OH reactions at specified temperatures.
![]() | ||
| Fig. 4 Pseudo-first-order rate constants for the C(3P)/(1D) + CH3OH reactions as a function of the methanol concentration. A weighted linear least squares fit yields the second-order rate constant. (Red filled circles) VUV LIF measurements of the rate constant for the C(3P) + CH3OH reaction at 177 K; (green filled triangles) chemiluminescence measurements of the rate constant for the C(3P) + CH3OH reaction at 177 K; (blue filled circles) VUV LIF measurements of the rate constant for the C(3P) + CH3OH reaction at 50 K; (black filled squares) chemiluminescence measurements of the rate constant for the C(1D) + CH3OH reaction at 127 K. The error bars reflect the statistical uncertainties at the level of a single standard deviation obtained by fitting to temporal profiles such as those shown in Fig. 3. | ||
The exploitable ranges of CH3OH concentrations at 50 K and 75 K were severely limited by apparent fall-offs in the observed k1st values at high methanol concentrations. This effect was interpreted as the onset of cluster formation leading to a reduction in the free gas-phase CH3OH concentrations, in a similar manner to our previous experiments on the reactivity of H2O at low temperature.29 Consequently, only experiments conducted in the linear regime were used in the final analysis.
Direct C(3P) VUV LIF detection allowed us to investigate the C(3P) + CH3OH reaction over the range 50–296 K. Test measurements of the C(3P) + CH3OH reaction at 127 K in the presence of a large excess of H2 ([H2] = 3.2 × 10¹⁴ molecule cm−3, (thereby removing C(1D) rapidly from the flow) yielded the same value for the second-order rate constant as the one obtained in the absence of H2, indicating the negligible influence of C(1D) on C(3P) decays recorded by the VUV LIF method. Chemiluminescence methods allowed us to obtain rate constants for the C(3P) + CH3OH reaction at 177 K and 296 K (thereby allowing a direct comparison of the two techniques). The chemiluminescence method yields rate constants for the C(3P) + CH3OH reaction which are slightly lower than those derived from direct LIF measurements. This difference is almost certainly due to a contribution to the long-time part of the decays (which are used to extract C(3P) rate constants) from NO* produced by the C(1D) + NO2 reaction. As the yield of NO* seems to be significantly larger than the one from the corresponding C(3P) + NO2 reaction, even a small amount of residual C(1D) atoms at long times could potentially interfere.
As the C(1D) + CH3OH reaction occurred on a shorter timescale than the C(3P) + CH3OH one (at 127 K and above), rate constants for the C(1D) + CH3OH reaction could be measured at 127 K and 296 K using the chemiluminescence method. The measured values of around 1.7 × 10⁻¹⁰ cm3 molecule−1 s−1 indicate that this reaction exhibits little or no temperature dependence, in a similar manner to the C(1D) + H2 reaction which has been studied both experimentally at 300 K33 and theoretically50 down to low temperatures, with rate constants in the range (1–2) × 10−10 cm3 molecule−1 s−1 above 100 K.
Measurements of the kinetics of the C(3P) + CH3OH reaction were also performed at 241 K using a Laval nozzle based on a mixture of SF6 and N2. Our previous work on the CH + H2O reaction29 has demonstrated that the use of SF6 in particular as the carrier gas can result in an enhancement in the measured rate at low temperature, compared to experiments employing argon, almost certainly due to the efficient collisional stabilization of complex1. It can be seen from Fig. 4 that a small enhancement of the rate constant (a 50% increase of the rate constant with respect to the calculated trend for argon) is observed in this case although the magnitude of the effect is lower than the corresponding effect for the CH + H2O reaction at the same temperature.29
In order to explore the difference between the experimental results using Ar and SF6 carrier gases, calculations were performed using SF6 as a bath gas. Given the relative sizes of the two bath gases, collision energy transfer is expected to be more efficient for SF6 compared to Ar. Calculations were performed at 241 K using a well depth for complex1 of −69 kJ mol−1. In order to predict the observed 50% increase, it was necessary to increase the 〈ΔEdown〉 value to 500 cm−1.
The temperature dependent rate constants obtained for both the ground and first excited state reactions and by both detection methods are presented in Fig. 5 and are summarized in Table 2 alongside the results of the MESMER calculated rates for the C(3P) + CH3OH reaction. It was found that good agreement between experiment and theory could be obtained using both the M06 and CCSD(T) well depths for complex1 and these two models gave fitted energies for TS1 of −4.13 kJ mol−1 and −4.12 kJ mol−1 with n factors of −0.43 and −0.60 respectively. The significant negative temperature dependence observed for the rate constants of the C(3P) + CH3OH reaction is apparent, and theoretically it is found that this can only be reproduced, through either significant stabilisation of complex1 or through a negative temperature dependence for the flux through the outer transition state. As the experimental H atom yields demonstrate that stabilisation into complex1 is relatively minor, a significant contribution from the outer transition state is crucial to obtain agreement between experiment and theory.
| T/K | [CH3OH]a | Nb | Measured k C(3P) + CH3OH | Calculated k C(3P) + CH3OH | Nb | Measured k C(1D) + CH3OH |
|---|---|---|---|---|---|---|
| a /1013 molecule cm−3.b Number of individual measurements.c (20.0 ± 2.1) ≡ (20.0 ± 2.1) × 10−11 cm3 molecule−1 s−1.d 22 ≡ 22 × 10−11 cm3 molecule−1 s−1.e (16.8 ± 1.7) ≡ (16.8 ± 1.7) × 10−11 cm3 molecule−1 s−1.f Uncertainties on the measured rate constants represent the combined statistical (1σ) and estimated systematic (10%) errors. Uncertainties on the calculated temperatures represent the statistical (1σ) errors obtained from Pitot tube measurements of the impact pressure. | ||||||
| 50 ± 1 | 0–4.3 | 36 | (20.0 ± 2.1)c | 22d | ||
| 75 ± 2 | 0–6.2 | 30 | (13.8 ± 1.5) | 13 | ||
| 127 ± 2 | 0–31 | 73 | (9.4 ± 1.0) | 6.9 | 39 | (16.8 ± 1.7)e |
| 158 ± 2 | 0–24 | 23 | (6.2 ± 0.7) | 5.3 | ||
| 177 ± 2 | 0–30 | 55 | (3.9 ± 0.4) | 4.6 | ||
| 0–22 | 54 | (3.0 ± 0.3) | ||||
| 241 ± 1 | 27 | (4.3 ± 0.5) | ||||
| 296 | 0–66 | 49 | (2.2 ± 0.3) | 2.9 | 39 | (16.3 ± 1.7) |
| 0–36 | 41 | (1.6 ± 0.2) | ||||
In order to test the impact of the C(3P) + CH3OH reaction on gas-phase interstellar methanol abundances (the reaction is not present in current astrochemical models), the statistical calculations have been used to extrapolate the rate constant to temperatures and pressures more representative of those found in dense interstellar clouds. As it was not possible to perform these calculations at 10 K due to numerical difficulties caused by energy transfer transition probabilities becoming vanishingly small, the value obtained at 20 K was used instead. At 20 K and at the low pressure limit, the calculations predict that the rate constant should be close to the capture rate limiting value of 4.0 × 10⁻¹⁰ cm3 molecule−1 s−1. Although this may slightly underestimate the rate at 10 K, it is a reasonable approximation given the inherent uncertainty in the statistical calculations at such low temperatures. The C(3P) + CH3OH reaction was introduced into the chemical network used by the astrochemical model Nautilus51 leading to HCO and CH3 as the exclusive products. Nautilus computes chemical abundances in the gas-phase and on the surface of interstellar grains as a function of time under the extreme conditions of the interstellar medium. In this particular case, the gas-grain interactions which mimic the uptake of gas-phase species are essential to simulate the presence of molecules such as methanol which are primarily formed on the surface of interstellar dust particles. Whilst the reactions of molecules on the surface of dust grains allow us to model the formation of larger more complex molecules on the interstellar grains themselves, they do not allow us to explain the presence of methanol in the gas-phase. Indeed, desorption mechanisms are required to return species formed in this way back to the gas-phase. Three processes are typically included; thermal desorption which obeys a standard Boltzmann law to overcome the energy barrier for the physisorbed molecules and cosmic ray desorption which involves whole grain heating through the collision of cosmic rays with dust grains. Both of these effects are too weak to be able to reproduce typical gas phase methanol abundances in dense clouds. The third desorption mechanism, namely non-thermal desorption, relies on the surface reaction energy to desorb the newly formed molecules. Models employing this reactive desorption approach assume a probability factor f for desorption which takes into consideration the exothermic energy of the reaction, the binding energy of the product molecule with the surface and the size of the newly formed species. Values of f of a few percent are generally required to reproduce gas phase methanol concentrations.52 A fourth mechanism, namely photodesorption by UV photons produced deep in the dark cloud itself by the radiative decay of electronically excited H2 could also be a non-negligible way to return molecules to the gas-phase53 although these processes are not included in the current model.
Supplementary details on the processes included in the present model can be found in Semenov et al.51 and Hersant et al.54 The kinetic data and other parameters (physical conditions, elemental abundances and initial chemical composition) used for the simulations are the same as in those used in Loison et al.55 for typical dark interstellar clouds. Two values of the oxygen elemental abundance have been employed (2.4 × 10⁻⁴ and 1.4 × 10⁻⁴ with respect to total hydrogen) resulting in C/O elemental ratios of 0.7 and 1.2. The temperature is held at 10 K and the total density is 2 × 104 cm−3. Fig. 6 shows the relative abundances of CH3OH as a function of time obtained using the gas-grain model with the C(3P) + CH3OH reaction included compared to those obtained without this reaction present for the two nominal C/O ratios. For both C/O elemental ratios, the CH3OH abundance in the gas-phase is much smaller at early times (before 3 × 10⁵ years) as the high abundance of atomic carbon in the gas-phase destroys CH3OH extremely efficiently. After 3 × 10⁵ years, the CH3OH abundance is still slightly decreased but it is somewhat closer to previous predictions. Using the reactive flux (equal to the product of the rate constant and the concentrations of carbon and methanol respectively) as the criterion for classifying the importance of the various gas-phase methanol destruction mechanisms, our simulations indicate that the C(3P) + CH3OH reaction is the most efficient gas-phase methanol destruction mechanism between 1 × 10⁴ years and 3 × 10⁶ years for both C/O ratios and can be as much as three orders of magnitude greater than the next most significant methanol loss process. The abundances of CH3 and HCO are relatively unchanged by the introduction of the C(3P) + CH3OH reaction as these species have many sources in current astrochemical models.
This result has important consequences for the gas-grain chemistry of current astrochemical models. The presence of large abundances of atomic carbon in the gas-phase in dark clouds (see for example Schilke et al.21) could reduce strongly the abundance of methanol. Observations of large abundances of methanol in the gas-phase (of a few 10−9 compared to the total hydrogen density) would then be an indicator of dark clouds older than a few 105 year, for which the atomic carbon has had time to be converted into other C-bearing species. Gas phase methanol abundances in the range (1–3) × 10−9 have been reported for dense clouds TMC-1 (ref. 56) and L134N.57 Since the abundance at the surface of the grains is larger by orders of magnitude, another explanation could be that methanol desorption mechanisms are more efficient than currently estimated. Recent experiments58 suggest that reactive desorption mechanisms could return larger percentages of species formed on ice grains to the gas-phase than the values used in current models although this effect depends to a large extent on the composition and morphology of the surface itself.
Alternatively, there could be reactive pathways other than the hydrogenation of CO, which might lead to methanol formation on interstellar ices. One potential source of methanol could begin with the barrierless reaction of C with H on the grain surface leading to CH radical formation. If the CH radicals are formed in sites adjacent to water molecules already present on the surface, it may be possible that reaction between these two species could occur efficiently. Indeed, experiments29 and calculations59 of the gas-phase reactivity of CH with H2O indicate that this reaction proceeds in the absence of a barrier and is fast at low temperatures, also leading to the formation of H2CO. As the initial hydrogenation step of the standard methanol formation mechanism (H + CO to form HCO) is characterized by an activation barrier of approximately 19 kJ mol−1,60 and is therefore rate limiting, this secondary source of H2CO could then lead to the formation of significant quantities of methanol through the subsequent hydrogenation of H2CO.
Footnote |
| † Electronic supplementary information (ESI) available. See DOI: 10.1039/c4ra03036b |
| This journal is © The Royal Society of Chemistry 2014 |