An ultrasensitive colorimetric aptasensor for ATP based on peptide/Au nanocomposites and hemin–G-quadruplex DNAzyme†
Shipeng Li‡
a,
Liqiang Wang‡a,
Yuanqiang Haoa,
Lili Zhanga,
Binbin Zhouab,
Liu Deng*a and
You-Nian Liu*a
aCollege of Chemistry and Chemical Engineering, Central South University, Changsha, Hunan, PR China. E-mail: liuyounian@csu.edu.cn; Fax: +86-731-8887-9616; Tel: +86-731-8883-6964
bHunan Institute of Food Quality Supervision Inspection and Research, Changsha, Hunan 410111, PR China
First published on 15th May 2014
Abstract
A peptide nanosphere-based colorimetric aptasensor for the ultrasensitive detection of adenosine triphosphate (ATP) has been fabricated. By conjugating gold nanoparticles (AuNPs) onto peptide nanospheres (PNS), the PNS/AuNPs nanocomposite was obtained and used as a carrier for single-strand ATP aptamer (S1) and signaling DNAzyme sequence. In the presence of ATP, the nucleic acids decorated PNS/AuNPs could immobilize to a 96-well plate which was modified with another single-strand ATP aptamer (S2) DNA. Then, upon addition of K+ and hemin, the designed signaling DNAzyme sequence on PNS/AuNPs could form the hemin–G-quadruplex DNAzyme and catalyze the conversion of TMB to coloured TMB2+. The colorimetric aptasensor adopting PNS/AuNPs nanocomposites as signal enhancers possesses much higher sensitivity towards ATP compared with the conventional AuNPs-based aptasensors. The PNS/AuNPs-based sensor is available for sensitively detecting ATP in a concentration range of 0.01–1 nM with a detection limit of 1.35 pM. Moreover, the constructed aptasensor displayed excellent selectivity for ATP over other analogues such as GTP, CTP and UTP. The proposed strategy for the construction of an aptasensor based on nanocomposites has great potential to become a universal technique for developing various aptasensors by using different aptamers.
1. Introduction
Aptamer-based sensors are of great interest, due to their high binding affinity and specificity to various target analytes including small inorganic and organic substances, proteins and cells.1,2 Recently, the development of ultrasensitive aptasensors based on the colorimetric method has attracted increasing attention because of their intrinsic advantages of low cost and high sensitivity.3,4 Signal amplification strategies for these ultrasensitive aptasensors were mainly based on nanocarriers, including carbon nanotubes,5 gold nanoparticles,6 and magnetic beads.7 However, structural defects (i.e. size and surface texture) of these nanomaterials limited their effectiveness for signal amplification, especially when enzymes and other large biomolecules were co-assembled on the nanoparticles. Therefore, the development of effective nanocarriers is highly required to overcome these limitations.Peptide based nanomaterials have attracted a great deal of attention due to their promising applications, including tissue repair scaffolds,8,9 drug delivery vehicles10,11 and structural templates for inorganic materials.12,13 Rationally designed peptides are able to self-assemble to various nanostructures, including nanotubes,14 nanofibers,15 and nanospheres.16 Recently, self-assembled peptide nanomaterials have also been successfully applied to fabricate biosensors. For instance, the diphenylalanine peptide nanotubes have demonstrated the ability to become an attractive component for the electrochemical biosensing platform.17 By using self-assembled ionic-complementary peptide nanofibers, Yang et al. fabricated an effective enzyme-based biosensor for biomolecular detection and disease diagnostics.18 And the ferrocene modified self-assembled peptide nanowires were also used to construct sensitive electrochemical immunosensor for tumor necrosis factor α.19 Until now, among various peptide-based nanostructures, only peptide nanofiber has been used in biosensors. However, the nanosphere is more attractive kind of structure in biosensor application, due to its high specific surface area, easy access to modification and high structural uniformity.
Though the enzymatic amplification strategy is one of the most widely used approaches for DNA sensing, it still has some serious drawbacks such as the instability of the enzyme and the time-consuming procedures. Alternatively, the use of nucleic acid-functionalized nanostructures as optical labels has been widely studied and utilized in optical sensors.20–22 One of the most extensively studied nucleic acid nanostructures is G-quadruplex which can act as a host for optical signal unit (i.e., fluorophores or porphyrin).23–25 Particularly, the G-quadruplex–hemin DNAzymes, which are able to effectively catalyze the H2O2-mediated oxidation of 2,2′-azino-bis(3-ethylbenzothiazoline-6-sulfonic acid)diammonium salt (ABTS)26 or 3,3′,5,5′-tetramethylbenzidine (TMB),27 have been widely used for the construction of optical sensors for detection of DNA, protein, small molecules and metal ions.28–30 The DNAzyme-catalyzed colorimetric reaction was also successfully used for the construction of sandwich-type assays which displayed ultra-high sensitivity.31,32 Moreover, DNAzymes can be superior to protein enzymes because of their high chemical stability, low cost, simple preparation and easy modification.33
In this work, we developed a new signal amplification strategy based on peptide nanosphere (PNS), gold nanoparticles (AuNPs), aptamer and DNAzyme. Firstly, the Cys-Phe-Phe tripeptides (CFF) were self-assembled into uniform PNS. Then AuNPs were immobilized on the surface of the formed PNS. Where, AuNPs not only increase the surface area of PNS, but also allow easy modification of thiol tethered DNA. The PNS/AuNPs nanocomposites were further functionalized with the ATP aptamer (sensing probe) and DNAzyme (signal label). This ELISA (enzyme-linked immunosorbent assay) ATP aptasensor based on PNS/AuNPs nanocomposites and DNAzyme is able to detect ATP with high sensitivity and selectivity.
2. Experimental
2.1. Materials
Chloroauric acid trihydrate (HAuCl4·3H2O), sodium citrate trihydrate, H2O2 and sodium borohydride (NaBH4) were purchased from SCRC (Shanghai, China). Potassium dihydrogen phosphate (KH2PO4), dipotassium hydrogen phosphate (K2HPO4), 3,3′,5,5′-tetramethylbenzidine (TMB), bovine serum albumin (BSA) and hemin were obtained from Sigma (St. Louis, MO). N-Hydroxybenzotriazole (HOBt), diisopropylcarbodiimide (DIC), Fmoc-Phe-OH and Fmoc-Cys-OH were received from GL Biochem (Shanghai, China). Adenosine triphosphate (ATP), cytidine triphosphate (CTP), guanosine triphosphate (GTP) and uridine triphosphate (UTP) were acquired from Thermo Fisher Scientific (Pittsburgh, PA). All other reagents were of analytical grade and deionized water (Mill-Q, 18 MΩ cm) was used throughout the study. Unlabeled oligonucleotides and thiolated oligonucleotides were obtained from Sangon Biotech (Shanghai, China) with the following sequences:S1: 5′-NH2-TTT TTT ACC TGG GGG AGT AT-3′;
S2: 5′-HS-TTT TTT TGC GGA GGA AGG T-3′;
S3: 5′-HS-TTT TTT GGT TGG TGT GGT TGG-3′.
The DNA-bind 96-well plate used in the experiments was purchased from Dingguo Biotech (Beijing, China).
2.2. Synthesis and purification of CFF
The CFF peptides were synthesized by the solid-phase method using the Fmoc strategy on the Peptide Synthesizer Division (CS Bio Co. CA). Amino acids were activated with HOBt/DIC and coupled for 60 min. The Fmoc groups were deprotected with 20% piperidine in DMF (v/v) after the coupling reaction. Subsequently, the peptide was cleaved from the resin using trifluoroacetic acid (TFA)/water/thioanisole (95![[thin space (1/6-em)]](https://www.rsc.org/images/entities/char_2009.gif) :
:![[thin space (1/6-em)]](https://www.rsc.org/images/entities/char_2009.gif) 2.5
2.5![[thin space (1/6-em)]](https://www.rsc.org/images/entities/char_2009.gif) :
:![[thin space (1/6-em)]](https://www.rsc.org/images/entities/char_2009.gif) 2.5, v/v/v). The peptide was then purified by semi-preparative reversed-phase high-performance liquid chromatography (RP-HPLC, Shimadzu 6AD, Columbia, MO) using a column (Jupiter-10 μm-C18-300 Å, dimension of 250 × 4.6 mm i.d.) from Phenomenex (Torrance, CA). The mobile phases were 0.1% TFA in water (v/v, mobile phase A) and 0.1% TFA in acetonitrile (v/v, mobile phase B), at a flow rate of 4.75 mL min−1. The elution gradient was 20–40% B for 20 min, the CFF peptide eluted at 9.8 min. The sample was lyophilized with a freeze-drier (VirTis Benchtop K, Warminster, PA) after the HPLC purification. The molecular weight of CFF was verified by electrospray ionization mass spectrometry (ESI-MS). ESI-MS for CFF: m/z: calcd for C21H25N3O4S [M + H]+: 416.16; found 416.06 (see Fig. S1†).
2.5, v/v/v). The peptide was then purified by semi-preparative reversed-phase high-performance liquid chromatography (RP-HPLC, Shimadzu 6AD, Columbia, MO) using a column (Jupiter-10 μm-C18-300 Å, dimension of 250 × 4.6 mm i.d.) from Phenomenex (Torrance, CA). The mobile phases were 0.1% TFA in water (v/v, mobile phase A) and 0.1% TFA in acetonitrile (v/v, mobile phase B), at a flow rate of 4.75 mL min−1. The elution gradient was 20–40% B for 20 min, the CFF peptide eluted at 9.8 min. The sample was lyophilized with a freeze-drier (VirTis Benchtop K, Warminster, PA) after the HPLC purification. The molecular weight of CFF was verified by electrospray ionization mass spectrometry (ESI-MS). ESI-MS for CFF: m/z: calcd for C21H25N3O4S [M + H]+: 416.16; found 416.06 (see Fig. S1†).
2.3. Preparation of PNS/AuNPs nanocomposites
The AuNPs were prepared according to a literature procedure34 with slight modification. To 100 mL of H2O, 1 mL 1% aqueous of HAuCl4 was added with vigorous stirring. After addition of 1 mL of 1% sodium citrate trihydrate aqueous, 1 mL of aqueous solution containing 0.075% NaBH4 and 1% sodium citrate trihydrate was added. The above mixture was stirred for 5 min to form AuNPs and then stored at 4 °C before use.Water (1 mL) was added to 2.0 mg of lyophilized CFF, and the sample was sonicated at 25 °C for 5 min in a bath sonicator to completely dissolve the solids. The solution was then incubated at room temperature for 24 h to form PNS. Then, the as-prepared PNS (0.2 mL) was mixed with an equal volume of AuNPs solution. The mixture was vibrated at room temperature for 15 min and left overnight. The resulting mixture was then centrifuged at 8000 rpm for 10 min at 4 °C to precipitate the PNS/AuNPs nanocomposites and the supernatant was discarded. The PNS/AuNPs nanocomposites were purified by several washing/centrifugation cycles.
2.4. Preparation of DNA functionalized PNS/AuNPs nanocomposites
PNS/AuNPs nanocomposites were modified with two kinds of thiol-modified DNA via the well-known gold–sulfur chemistry. PNS/AuNPs/DNA complexes were synthesized according to the literature35 with minor modification. Briefly, S2 (1 μM) and S3 (5 μM) were added simultaneously into 400 mL of PNS/AuNPs solution. The mixture was then incubated for 24 h to ensure the complete self-assembly of DNA on the AuNPs surface. After that, the mixture was centrifuged at 8000 rpm for 10 min at 4 °C, the supernatant was discarded to remove the unbounded S2 and S3. The obtained DNA-decorated PNS/AuNPs nanocomposites were rinsed three times with PBS (pH 7.4, 10 mM containing 100 mM NaCl). The final deposition was resuspended in PBS and stored at 4 °C for further use. The ratio of S2 to S3 was optimized.2.5. Apparatus
The spectrophotometric measurements were performed using a Microplate Reader (Biotek, Winooski). AFM images were obtained from an MFP-3D-SA microscope (Asylum Research, Santa Barbara, CA) using the tapping mode in air. X-ray photoelectron spectroscopy (XPS) was measured on a K-Alpha 1063 Instrument (Thermo Fisher Scientific).3. Results and discussion
3.1. Characterization of PNS and PNS/AuNPs nanocomposites
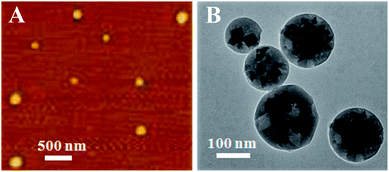
The CFF tripeptide was first self-assembled into extended pleated sheet by the stacking force between aromatic moieties of the peptides. This structure could be stabilized by both hydrogen bonds and aromatic stacking interactions, then the closure of the extended sheet along two axes of the two-dimensional layer allowed the formation of the spherical structures.16 The morphology of the PNS was characterized by AFM (Fig. 1A). The apparent diameter of the PNS is about 120 nm. Due to the existence of thiol group in the CFF unit, the self-assembled PNS possesses the exposed thiol groups available for convenient functionalization. Thus, the AuNPs could immobilize on the surface of the PNS through S–Au bonds. As shown in Fig. 1B, the diameter of PNS/AuNPs nanocomposites significantly increase to about 150 nm, which could be ascribed to the co-assembly between AuNPs and PNS.To further characterize the PNS/AuNPs nanocomposites, elemental analysis was also performed. The chemical forms of C, N, O, S and Au elements on the surface of PNS/AuNPs nanocomposites were investigated by XPS measurements (see Fig. 2). The high-resolution XPS spectrum in the C 1s region is depicted in Fig. 2A. Deconvolution of the C 1s spectrum includes three component peaks. These peaks located at 284.6 eV, 285.8 eV and 288.7 eV can be attributed to the carbon of C–C, benzene and O–C![[double bond, length as m-dash]](https://www.rsc.org/images/entities/char_e001.gif) O, respectively. The N 1s spectrum (Fig. 2B) indicates the presence of two types of nitrogen: O
O, respectively. The N 1s spectrum (Fig. 2B) indicates the presence of two types of nitrogen: O![[double bond, length as m-dash]](https://www.rsc.org/images/entities/char_e001.gif) C–NH (399.8 eV) and NH2– (401.6 eV). In the O 1s spectrum (Fig. 2C), the peak at 531.2 eV and 532.6 eV could be ascribed to hydroxyl and carbonyl group, respectively. The optimum curve fitting of the S 2p peak (163.2 eV) was a characteristic binding energy for the sulfide components (Fig. 2D). The binding energies of the doublet for Au 4f7/2 (83.9 eV) and Au 4f5/2 (87.5 eV) shown in Fig. 2E are characteristic of Au0,35 further demonstrating the existence of gold nanoparticles on peptide nanospheres. It should be noted that the introduction of AuNPs coating on the PNS not only facilitated the DNA immobilization on PNS surface, but also increased the active surface area of the PNS for DNA loading.
C–NH (399.8 eV) and NH2– (401.6 eV). In the O 1s spectrum (Fig. 2C), the peak at 531.2 eV and 532.6 eV could be ascribed to hydroxyl and carbonyl group, respectively. The optimum curve fitting of the S 2p peak (163.2 eV) was a characteristic binding energy for the sulfide components (Fig. 2D). The binding energies of the doublet for Au 4f7/2 (83.9 eV) and Au 4f5/2 (87.5 eV) shown in Fig. 2E are characteristic of Au0,35 further demonstrating the existence of gold nanoparticles on peptide nanospheres. It should be noted that the introduction of AuNPs coating on the PNS not only facilitated the DNA immobilization on PNS surface, but also increased the active surface area of the PNS for DNA loading.
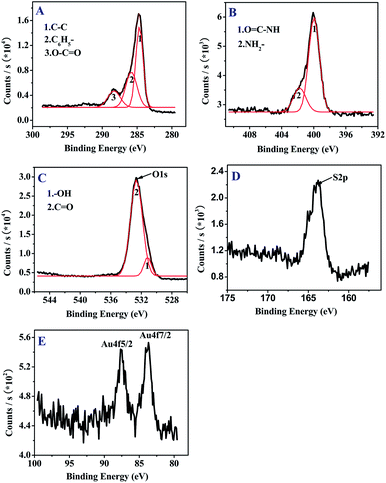 | ||
| Fig. 2 XPS spectra of the PNS/AuNPs nanocomposites. (A) C 1s spectra, (B) N 1s spectra, (C) O 1s spectra, (D) S 2p and (E) Au 4f. | ||
3.2. Fabrication of the colorimetric aptasensor based on PNS/AuNPs probe
Scheme 1 depicts the construction and detection mechanism of the PNS/AuNPs-based colorimetric aptasensor for ATP. The ATP aptamer was cut into two oligonucleotide sequences, S1 and S2 respectively. The aptamer split strategy was first proposed by Milan and co-workers36 for the construction of sandwich-type detection assay. And this strategy has been widely applied for the development of various biosensors.31,37–39 First, both of the sensing probe (S2) and signal probe (DNAzyme, S3) were modified with thiol and attached to PNS/AuNPs nanocomposites simultaneously. S1-attached 96-well plate was used as the substrate for signal recording. In the presence of target (ATP), the S2 loaded PNS/AuNPs nanocomposites would immobilize on the S1-attached 96-well plate and form intact structures based on aptamer–target interaction. Then upon addition of K+, S3 on PNS/AuNPs nanocomposites would fold into G-quadruplex structure. And this structure can strongly bind to hemin, and lead to the formation of the hemin–G-quadruplex DNAzyme which exhibits peroxidase-like activity. With hemin–G-quadruplex DNAzyme, H2O2 can oxidize the diamine of TMB directly to the diimine. And the produced diimine can interact with the original diamine to form blue charge-transfer complex which exists in rapid equilibrium with the radical cation. Under acidic condition, the blue charge-transfer complex can be further oxidized, yielding a yellow diimine with an absorption band centered at 450 nm. So the absorption signals at 450 nm can be used to monitor the analyte. The performance of the prepared ATP aptasensor was investigated by UV-vis spectroscopy measurements. In the absence of ATP and S2/S3 loaded PNS/AuNPs nanocomposites, the TMB–H2O2 and hemin/K+ system only displayed very weak absorbance at 450 nm (dash line in Fig. 3A), indicating that the inherent catalytic activity of hemin is very low in this assay. In the presence of ATP, a slight increase in the absorption signal at 450 nm was observed, illustrating the accumulation of a small amount of TMB˙+. This could be attributed to the interaction between ATP and hemin, which was reported by Kong et al.40 With the further addition of S2/S3 loaded PNS/AuNPs nanocomposites to the aptasensor system, a sharp increase in the absorption signal centered at around 450 nm (solid line in Fig. 3A) appeared, suggesting that the successful assembly of PNS/AuNPs-based probe on the sensing interface and the formation of hemin–G-quadruplex DNAzyme. As a control experiment, the probe of S2/S3 loaded AuNPs was used to detect the target instead of the PNS/AuNPs/aptamer/DNAzyme nanocomposites (Fig. 3B). Though a moderate increase in the absorption was observed, it is still much weaker than that by using S2/S3 loaded PNS/AuNPs nanocomposites, which was due to that there were more catalytic centers while using PNS/AuNPs nanocomposites (as displayed in Fig. 3 insets).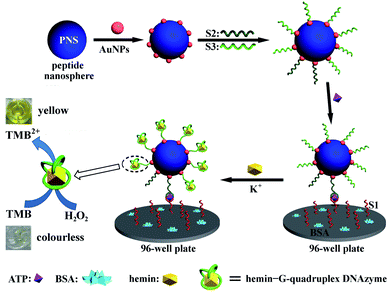 | ||
| Scheme 1 Schematic illustration of the construction of the PNS/AuNPs-based colorimetric aptasensor for ATP. | ||
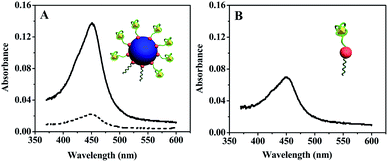 | ||
| Fig. 3 (A) UV-vis spectra of ATP detection using PNS/AuNPs-based probe (solid line) and blank test (dotted line). (B) UV-vis spectra of ATP detection using AuNPs-based probe. | ||
3.3. Optimization of the PNS/AuNPs-based probe
To achieve the best signal amplification efficiency in the colorimetric assay, the preparative condition of the PNS/AuNPs-based probe was optimized. The output signal of the prepared aptasensor depends mainly on the amount of S3 (signal probe), because S3 can form hemin–G-quadruplex DNAzyme and further catalyze the conversion of TMB to TMB˙+ to generate the measured optical signal. On the other hand, S2, as one part of the ATP aptamer, can fix the PNS/AuNPs to the S1-attached 96-well plate and maintain the structural stability of the whole aptasensor. Therefore, the ratio of S2 to S3 immobilized on the PNS/AuNPs nanocomposites is crucial for the performance of the aptasensor. The absorbance responses of the aptasensor with various S2/S3 ratios at 450 nm were examined (Fig. S2†). The signal enhanced by decreasing the S2/S3 ratio in the range from 1/5 to 1/20. This enhancement was due to the formation of more DNAzyme catalytic centers with more amount of S3 immobilized on PNS/AuNPs nanocomposites. While further increasing the S3 ratio, the absorbance change of the biosensor was decreased. This could be ascribed to that some PNS/AuNPs nanocomposites cannot be effectively modified by S2 under such low S2/S3 ratios (<1/20) which made these PNS/AuNPs nanocomposites unable to immobilize on the 96-well plate. So the ratio of S2/S3 applied in the following experiment was fixed at 1/20.3.4. Optimization of the ATP sensor
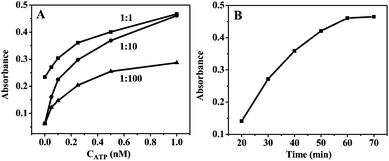
The stock solution of the PNS/AuNPs-based probe should be diluted when it was used in the incubation step of the assay for ATP-aptamer interaction. The absorbance responses of the ATP sensor were examined by varying the dilution ratio of the PNS/AuNPs-based probe stock solution. As shown in Fig. 4A, using the undiluted probe leads to a very high nonspecific signal even in the absence of ATP. The nonspecific signal was reduced while using diluted stock solution. However, when the dilution ratio was set at 1![[thin space (1/6-em)]](https://www.rsc.org/images/entities/char_2009.gif) :
:![[thin space (1/6-em)]](https://www.rsc.org/images/entities/char_2009.gif) 100, very low absorbance response was observed even at high ATP concentration. The output signals of aptasensor were enhanced by increasing the dilution ratio from 1
100, very low absorbance response was observed even at high ATP concentration. The output signals of aptasensor were enhanced by increasing the dilution ratio from 1![[thin space (1/6-em)]](https://www.rsc.org/images/entities/char_2009.gif) :
:![[thin space (1/6-em)]](https://www.rsc.org/images/entities/char_2009.gif) 100 to 1
100 to 1![[thin space (1/6-em)]](https://www.rsc.org/images/entities/char_2009.gif) :
:![[thin space (1/6-em)]](https://www.rsc.org/images/entities/char_2009.gif) 10. Therefore, to obtain both high selectivity and sensitivity of the aptasensor, a dilution ratio of 1
10. Therefore, to obtain both high selectivity and sensitivity of the aptasensor, a dilution ratio of 1![[thin space (1/6-em)]](https://www.rsc.org/images/entities/char_2009.gif) :
:![[thin space (1/6-em)]](https://www.rsc.org/images/entities/char_2009.gif) 10 was adopted in the assay. The incubation time of PNS/AuNPs-based probe with ATP in S1-attached 96-well plate was also an important factor for the ATP sensor. As shown in Fig. 4B, increasing the incubation time resulted in higher response of the assay, and the signal reached its peak values at 1 h. So in the following study, the incubation time was fixed at 1 h.
10 was adopted in the assay. The incubation time of PNS/AuNPs-based probe with ATP in S1-attached 96-well plate was also an important factor for the ATP sensor. As shown in Fig. 4B, increasing the incubation time resulted in higher response of the assay, and the signal reached its peak values at 1 h. So in the following study, the incubation time was fixed at 1 h.
3.5. Sensitivity and selectivity
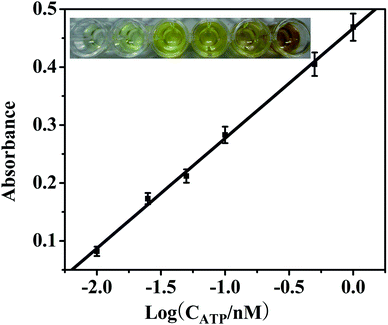
For quantitative analysis, the spectrophotometric measurements were performed using a Microplate Reader. As shown in Fig. 5, a good linear relationship between the absorbance and the logarithm of ATP concentration was obtained in the range of 0.01 to 1 nM. Especially, the detection process can be inspected with naked eyes (inset of Fig. 5). The LOD (limit of detection) of this aptasensor for ATP was calculated to be 1.35 pM (S/N = 3) which is more than two orders of magnitude lower than other methods.41–43 This can be attributed to the signal amplification strategy by using PNS/AuNPs-based nanocomposites which own large surface area for loading large amount of signal DNAzyme.The PNS/AuNPs-based colorimetric aptasensor also demonstrated good selectivity in the detection of ATP. ATP analogues such as GTP, CTP and UTP usually coexist with ATP in real samples and are generally selected as the interferences to inspect the specificity of ATP sensors. Control experiments showed that 1 nM ATP could give a remarkable absorbance response, while the signal resulting from 100 nM GTP, CTP and UTP did not show any significant differences to a blank sample (see Fig. S3†). This result indicated that the proposed aptasensor displayed an excellent sensitivity for ATP over its analogues.
4. Conclusions
In this work, PNS was first functionalized with AuNPs and used as a carrier for sensing and signal probes for a colorimetric ATP aptasensor. By adopting PNS/AuNPs nanocomposites for signal amplification, the aptasensor allows for sensitive detection of ATP with a LOD of 1.35 pM. In addition, the presence of other ATP analogs, such as UTP, GTP and CTP, have no interference on the ATP detection. Importantly, the proposed method for construction PNS/AuNPs-based probe has the potential to be a universal strategy for developing other sensitive aptasensor and to become an effective tool for molecular diagnostics in the future.Acknowledgements
We are grateful to the National Natural Science Foundation of China (no. 21276285 and 21105126) and the China Postdoctoral Science Foundation (nos. 2011M500126 and 2012T50656) for support. This research is also partly supported by the Open-End Fund for the Valuable and Precision Instruments of Central South University.References
- J. Liu, Z. Cao and Y. Lu, Chem. Rev., 2009, 109, 1948–1998 CrossRef CAS PubMed.
- I. Willner and M. Zayats, Angew. Chem., Int. Ed., 2007, 46, 6408–6418 CrossRef CAS PubMed.
- C. D. Medley, J. E. Smith, Z. Tang, Y. Wu, S. Bamrungsap and W. Tan, Anal. Chem., 2008, 80, 1067–1072 CrossRef CAS PubMed.
- X. Xu, J. Wang, K. Jiao and X. Yang, Biosens. Bioelectron., 2009, 24, 3153–3158 CrossRef CAS PubMed.
- Q. Zhang, B. Zhao, J. Yan, S. Song, R. Min and C. Fan, Anal. Chem., 2011, 83, 9191–9196 CrossRef CAS PubMed.
- A. Ambrosi, F. Airò and A. Merkoç, Anal. Chem., 2009, 82, 1151–1156 CrossRef PubMed.
- H. Yang, Curr. Opin. Chem. Biol., 2012, 16, 422–428 CrossRef CAS PubMed.
- H. Yokoi, T. Kinoshita and S. Zhang, Proc. Natl. Acad. Sci. U. S. A., 2005, 102, 8414–8419 CrossRef CAS PubMed.
- R. G. Ellis-Behnke, Y.-X. Liang, S.-W. You, D. K. C. Tay, S. Zhang, K.-F. So and G. E. Schneider, Proc. Natl. Acad. Sci. U. S. A., 2006, 103, 5054–5059 CrossRef CAS PubMed.
- Y.-b. Lim, E. Lee and M. Lee, Angew. Chem., Int. Ed., 2007, 46, 3475–3478 CrossRef CAS PubMed.
- X. Li, J. Li, Y. Gao, Y. Kuang, J. Shi and B. Xu, J. Am. Chem. Soc., 2010, 132, 17707–17709 CrossRef CAS PubMed.
- T. Scheibel, R. Parthasarathy, G. Sawicki, X.-M. Lin, H. Jaeger and S. L. Lindquist, Proc. Natl. Acad. Sci. U. S. A., 2003, 100, 4527–4532 CrossRef CAS PubMed.
- O. Carny, D. E. Shalev and E. Gazit, Nano Lett., 2006, 6, 1594–1597 CrossRef CAS PubMed.
- Y. Song, S. R. Challa, C. J. Medforth, Y. Qiu, R. K. Watt, D. Pena, J. E. Miller, F. v. Swol and J. A. Shelnutt, Chem. Commun., 2004, 1044–1045 RSC.
- V. Castelletto, I. W. Hamley and P. J. F. Harris, Biophys. Chem., 2008, 138, 29–35 CrossRef CAS PubMed.
- M. Reches and E. Gazit, Nano Lett., 2004, 4, 581–585 CrossRef CAS.
- M. Yemini, M. Reches, J. Rishpon and E. Gazit, Nano Lett., 2004, 5, 183–186 CrossRef PubMed.
- H. Yang, S.-Y. Fung, M. Pritzker and P. Chen, Langmuir, 2009, 25, 7773–7777 CrossRef CAS PubMed.
- Z. Sun, L. Deng, H. Gan, R. Shen, M. Yang and Y. Zhang, Biosens. Bioelectron., 2013, 39, 215–219 CrossRef CAS PubMed.
- V. Bagalkot, L. Zhang, E. Levy-Nissenbaum, S. Jon, P. W. Kantoff, R. Langer and O. C. Farokhzad, Nano Lett., 2007, 7, 3065–3070 CrossRef CAS PubMed.
- F. Wang, J. Elbaz, C. Teller and I. Willner, Angew. Chem., Int. Ed., 2011, 50, 295–299 CrossRef CAS PubMed.
- F. Wang, J. Elbaz, R. Orbach, N. Magen and I. Willner, J. Am. Chem. Soc., 2011, 133, 17149–17151 CrossRef CAS PubMed.
- B. Juskowiak, Anal. Chim. Acta, 2006, 568, 171–180 CrossRef CAS PubMed.
- J. Kosman and B. Juskowiak, Anal. Chim. Acta, 2011, 707, 7–17 CrossRef CAS PubMed.
- Y. Cai, N. Li, D.-M. Kong and H.-X. Shen, Biosens. Bioelectron., 2013, 49, 312–317 CrossRef CAS PubMed.
- Z. Lin, W. Yang, G. Zhang, Q. Liu, B. Qiu, Z. Cai and G. Chen, Chem. Commun., 2011, 47, 9069–9071 RSC.
- L. Zhang, J. Zhu, T. Li and E. Wang, Anal. Chem., 2011, 83, 8871–8876 CrossRef CAS PubMed.
- Y. Xiao, V. Pavlov, T. Niazov, A. Dishon, M. Kotler and I. Willner, J. Am. Chem. Soc., 2004, 126, 7430–7431 CrossRef CAS PubMed.
- T. Li, S. Dong and E. Wang, Anal. Chem., 2009, 81, 2144–2149 CrossRef CAS PubMed.
- T. Li, L. Shi, E. Wang and S. Dong, Chem.–Eur. J., 2009, 15, 1036–1042 CrossRef CAS PubMed.
- L. Tang, Y. Liu, M. Ali, D. Kang, W. Zhao and J. Li, Anal. Chem., 2012, 84, 4711–4717 CrossRef CAS PubMed.
- L. Stefan, T. Lavergne, N. Spinelli, E. Defrancq and D. Monchaud, Nanoscale, 2014, 6, 2693–2701 RSC.
- W. Chen, B. Li, C. Xu and L. Wang, Biosens. Bioelectron., 2009, 24, 2534–2540 CrossRef CAS PubMed.
- Y. Jin, X. Kang, Y. Song, B. Zhang, G. Cheng and S. Dong, Anal. Chem., 2001, 73, 2843–2849 CrossRef CAS.
- Y. Leng, F. Zhang, Y. Zhang, X. Fu, Y. Weng, L. Chen and A. Wu, Talanta, 2012, 94, 271–277 CrossRef CAS PubMed.
- M. Stojanovic, P. Prada and D. Landry, J. Am. Chem. Soc., 2000, 122, 11547–11548 CrossRef CAS.
- Z. Lin, F. Luo, Q. Liu, L. Chen, B. Qiu, Z. Cai and G. Chen, Chem. Commun., 2011, 47, 8064–8066 RSC.
- A. Sharma and J. Heemstra, J. Am. Chem. Soc., 2011, 133, 12426–12429 CrossRef CAS PubMed.
- N. Dave and J. Liu, Chem. Commun., 2012, 48, 3718–3720 RSC.
- D.-M. Kong, J. Xu and H.-X. Shen, Anal. Chem., 2010, 82, 6148–6153 CrossRef CAS PubMed.
- C.-Y. Li, X.-B. Zhang, L. Qiao, Y. Zhao, C.-M. He, S.-Y. Huan, L.-M. Lu, L.-X. Jian, G.-L. Shen and R.-Q. Yu, Anal. Chem., 2009, 81, 9993–10001 CrossRef CAS PubMed.
- F. Yan, F. Wang and Z. Chen, Sens. Actuators, B, 2011, 160, 1380–1385 CrossRef CAS PubMed.
- X. He, Z. Li, X. Jia, K. Wang and J. Yin, Talanta, 2013, 111, 105–110 CrossRef CAS PubMed.
Footnotes |
| † Electronic Supplementary Information (ESI) available: The MS spectrum of CFF, the results for selective experiment. See DOI: 10.1039/c4ra02823f |
| ‡ These authors contributed equally to this work. |
| This journal is © The Royal Society of Chemistry 2014 |

