Autohydrolysis and aqueous ammonia extraction of wheat straw: effect of treatment severity on yield and structure of hemicellulose and lignin†
Mika Henrikki Sipponen*,
Ville Pihlajaniemi,
Satu Sipponen,
Ossi Pastinen and
Simo Laakso
Aalto University School of Chemical Technology, Department of Biotechnology and, Chemical Technology, Kemistintie 1 D1, PO BOX 16100 FI-00076 Aalto, 02150 Espoo, Finland. E-mail: mika.sipponen@aalto.fi; Fax: +358 9462373; Tel: +358 503722468
First published on 14th May 2014
Abstract
The objective of this study was to elucidate the impact of autohydrolysis severity on the yield and structure of wheat straw hemicellulose and lignin. The autohydrolysis treatments were carried out at maximum temperatures between 170 °C and 200 °C. The autohydrolysis liquors were separated and the solids were successively extracted with aqueous ammonia either in moderate or high intensity extraction conditions to dissolve lignin for analysis. Increasing autohydrolysis severity decreased the molar mass of the aqueous ammonia extracts from 5450 g mol−1 to 1810 g mol−1, and carbohydrate content from 6% to 0.1%. The optimum autohydrolysis severity (log![[thin space (1/6-em)]](https://www.rsc.org/images/entities/char_2009.gif) R0 = 3.81) for xylan recovery released mainly oligomeric arabinoxylans at 66% xylan recovery yield. Drastic degradation of pentoses occurred beyond the optimum severity. As an indication of accumulation of “pseudo-lignin” during autohydrolysis, decreasing relative aromaticity in the aqueous ammonia extracts as a function of autohydrolysis severity was shown. The finding was confirmed by quantitative analysis of the cupric oxide oxidation products of lignin suggesting up to 55% decrease in the relative amount of native lignin at the highest severity. These results show the importance of distinguishing between lignin and “pseudo-lignin” in fractions obtained from lignocellulosic materials subjected to acidic pretreatment.
R0 = 3.81) for xylan recovery released mainly oligomeric arabinoxylans at 66% xylan recovery yield. Drastic degradation of pentoses occurred beyond the optimum severity. As an indication of accumulation of “pseudo-lignin” during autohydrolysis, decreasing relative aromaticity in the aqueous ammonia extracts as a function of autohydrolysis severity was shown. The finding was confirmed by quantitative analysis of the cupric oxide oxidation products of lignin suggesting up to 55% decrease in the relative amount of native lignin at the highest severity. These results show the importance of distinguishing between lignin and “pseudo-lignin” in fractions obtained from lignocellulosic materials subjected to acidic pretreatment.
1 Introduction
Utilization of lignocellulosic feedstock for production of liquid fuels dates back to the late nineteenth century when acid was used to hydrolyze wood and the sugars were fermented to ethyl alcohol.1 Today, renewable lignocellulosic biomass is still considered the preferred feedstock for production of biofuels and platform chemicals.2,3 Successful commercialization of lignocellulosic biorefineries requires development of cost-effective pretreatment technologies to overcome the resistance of lignocellulose materials against chemical and microbial attack.4 A preferential pretreatment process should aim at maximizing the yield of products while minimizing the environmental impact from the generated emissions and waste streams.Autohydrolysis (AH) process is a hydrothermal pretreatment that exploits generation of hydronium ions from autoionization of pressurized water at temperatures between 150 °C and 230 °C, leading to hydrolysis of acetyl groups from hemicellulose. In the further reactions, hydronium ions from acetic acid catalyze hydrolysis of glycosidic linkages of hemicellulose.5 AH releases mainly oligomeric hemicellulose and other water-soluble compounds while the solid fraction is enriched in cellulose and lignin.4 Lignin undergoes physico-chemical changes becoming partly deposited as droplets6 onto the solid fraction that shows increased susceptibility towards alkaline delignification.5 Formation of salt that occurs in alkaline treatment, or extensive neutralization required after dilute acid hydrolysis are avoided in AH.
Wheat straw is an interesting non-wood feedstock since it is abundantly available as agricultural residue in Europe. Characteristically high alkali solubility of straw lignin7 suggests that extraction of AH solid residues at moderate alkalinity could be carried out to isolate lignin. Aqueous ammonia might be advantageous extraction solvent because it could be recycled by evaporation. The two-stage process could thus efficiently fractionate lignocellulose into its main components, hemicellulose (soluble from AH), cellulose (insoluble), and lignin (soluble from extraction). Despite the promising aspects, there are few published studies combining AH and ammonia extraction of non-wood lignocellulosics.8 On the other hand, utilization of isolated hemicellulose and lignin in novel applications awaits better understanding of the structure–function properties of the fractions.
Pretreated wheat straw fractions were recently used as raw material for comparison of enzymatic hydrolysis processes.9 In view of emerging commercial scale biorefineries, it is important to understand how the AH process affects properties of both hemicellulose and lignin. These structural polymers are covalently linked in wheat straw,10 forming the lignin–carbohydrate network that is susceptible to degrade during AH. Consequently, formation of altered lignin termed “pseudo-lignin” has been suggested to occur during all pretreatments conducted under low pH conditions.11 However, it has not been elucidated how the severity of AH affects the yield and properties of wheat straw lignin, and how do these changes compare with the optimum severity for xylan recovery.
The objective of the present paper was to elucidate the impact of AH severity on decomposition of lignin–carbohydrate network and generation of “pseudo-lignin” from wheat straw. NH3 (aq) extraction of the solid fraction from AH was used to isolate soluble lignin fractions for analysis. In parallel, accumulation of soluble hemicellulose and degradation products as a function of AH severity was studied. Detailed evidence concerning the effect of severity on yield, molar mass properties, and structure of the soluble lignin and hemicellulose fractions is discussed.
2 Materials and methods
2.1 Materials
Wheat straw was milled using a Wiley mill to pass a 1 mm screen. Milled wheat straw material was washed with cold water three times, and the washed material was dried to 92% dry matter content in a convection oven at 40 °C and stored at −22 °C until use. This material was used as the feedstock, and is referred to as wheat straw in this study.2.2 Autohydrolysis of wheat straw
Wheat straw was suspended to deionized water giving liquid to solid ratio (LSR, g water per g dry feedstock) of 9 after adjustment by 0.1 M acetic acid to pH 4.5 (0.4 g L−1). The suspension (210 g) was heated to temperature of 170 °C, 180 °C, 190 °C, 195 °C or 200 °C in an autoclave reactor (Autoclave E92-10517-1, USA) equipped with a stirrer (125 rpm) and an electrical heating jacket (Meyer 080 g) that was operated at 250 °C. Treatments at 170 °C, 180 °C, and 190 °C were carried out in duplicates. After the reactor was cooled in an ice bath, the AH liquor was separated by filtration from the solid fraction that was washed with deionized water, pressed, and subjected to NH3 (aq) extraction. A type 175T3 temperature data logger (Testo AG, Germany) equipped with a K-type thermocouple was used to record the temperature data for calculation of the severity parameter.12
 | (1) |
2.3 Extraction of autohydrolysis solid residues with aqueous ammonia
Deionized water and 24.5% ammonium hydroxide (J. T. Baker, The Netherlands) were added into a poly(tetrafluoroethylene) (PTFE) vessel containing 5 g of AH solid residue on dry matter basis to give suspension at LSR = 19, containing either 5% or 20% ammonia on weight basis in the liquid phase. The vessel was instantly placed into the autoclave reactor and heated non-isothermally with continuous stirring at 125 rpm to either 140 °C or 160 °C, depending on the ammonia concentration (5% or 20%, respectively). The two conditions, based on the typical alkaline pulping temperatures of non-wood feedstock, were selected to study the effect of extraction intensity on lignin, and are hereafter referred to as moderate and high intensity extractions. When the target temperature was reached, the reactor was cooled down to 15 °C and the solid–liquid separation was carried out by filtration. The liquid phase was evaporated to dryness at 40 °C giving a fraction referred to as aqueous ammonia extract. The solid fraction was washed with deionized water, pressed, and stored at 4 °C. The studied fractionation procedure is shown in Fig. 1. It must be cautioned that gaseous ammonia is flammable and can form explosive mixtures with air. For this reason the treatments were carried out in a room equipped with automatic gas detection and fire extinguishing systems.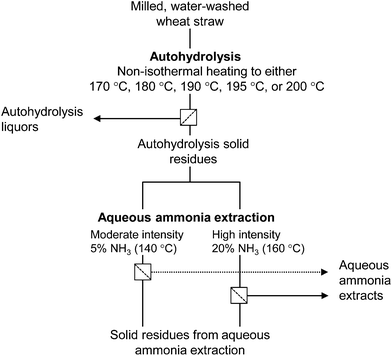 | ||
| Fig. 1 Scheme showing production and separation of AH liquors from wheat straw and successive isolation of aqueous ammonia extracts. | ||
2.4 Analytical procedures
All calculations were made based on dry matter content, which was determined gravimetrically by drying samples at 105 °C to constant weight. The analytical procedures were carried out in duplicates, and the mean values are reported, unless otherwise stated.![[thin space (1/6-em)]](https://www.rsc.org/images/entities/char_2009.gif) :
:![[thin space (1/6-em)]](https://www.rsc.org/images/entities/char_2009.gif) 0.1, v/v) and (B) acetonitrile–formic acid (99.1
0.1, v/v) and (B) acetonitrile–formic acid (99.1![[thin space (1/6-em)]](https://www.rsc.org/images/entities/char_2009.gif) :
:![[thin space (1/6-em)]](https://www.rsc.org/images/entities/char_2009.gif) 0.1, v/v), with B increasing from 9% to 80% in 45 min. The column effluent was monitored using UV detection at 280 nm. Calibration was based on reagent-grade phenolic compounds used as external standards (0.01 g L−1 to 0.2 g L−1).
0.1, v/v), with B increasing from 9% to 80% in 45 min. The column effluent was monitored using UV detection at 280 nm. Calibration was based on reagent-grade phenolic compounds used as external standards (0.01 g L−1 to 0.2 g L−1).![[thin space (1/6-em)]](https://www.rsc.org/images/entities/char_2009.gif) 000 g mol−1 to 150 g mol−1. Weight average molar masses (Mw) of the aqueous ammonia extracts were determined relative to poly(styrenesulfonate Na-salt) (Polysciences, USA) and ferulic acid (Sigma, Germany) standards in the molar mass range from 194
000 g mol−1 to 150 g mol−1. Weight average molar masses (Mw) of the aqueous ammonia extracts were determined relative to poly(styrenesulfonate Na-salt) (Polysciences, USA) and ferulic acid (Sigma, Germany) standards in the molar mass range from 194![[thin space (1/6-em)]](https://www.rsc.org/images/entities/char_2009.gif) 000 g mol−1 to 194 g mol−1 using a 1260 Infinity HPSEC system (Agilent, Germany) equipped with a 6 mm × 40 mm Ultrahydrogel® guard column and a series of three (500 Å, 250 Å, and 120 Å) 7.8 mm × 300 mm Ultrahydrogel® size-exclusion columns (Waters, USA). Columns at 30 °C were eluted at 0.5 mL min−1 with aqueous 0.1 M NaNO3/0.01 M NaOH.19 Samples were dissolved in 0.01 M NaOH (aq), passed through 0.45 μm PTFE filters and sample aliquots of 50 μL were injected using a type 1260 ALS autosampler (Agilent, Germany). Column effluent was monitored with an Agilent 1260 VWD detector set at 280 nm and a refractive index (RI) detector connected in series. The HPSEC analyses were based on single determinations. Calculation of Mw was carried out using the Agilent GPC/SEC software based on the UV 280 nm signal. To qualitatively study the relative proportion of lignin in the aqueous ammonia extracts, the ratio of RI signal to UV 280 nm signal (“RI/UV ratio”) was calculated from the recorded chromatograms. In the data processing, the RI trace was corrected for the inter detector delay, and only the values above the baseline level were used in calculations. Area under the RI/UV ratio trace was calculated following the trapezoid rule using Matlab.
000 g mol−1 to 194 g mol−1 using a 1260 Infinity HPSEC system (Agilent, Germany) equipped with a 6 mm × 40 mm Ultrahydrogel® guard column and a series of three (500 Å, 250 Å, and 120 Å) 7.8 mm × 300 mm Ultrahydrogel® size-exclusion columns (Waters, USA). Columns at 30 °C were eluted at 0.5 mL min−1 with aqueous 0.1 M NaNO3/0.01 M NaOH.19 Samples were dissolved in 0.01 M NaOH (aq), passed through 0.45 μm PTFE filters and sample aliquots of 50 μL were injected using a type 1260 ALS autosampler (Agilent, Germany). Column effluent was monitored with an Agilent 1260 VWD detector set at 280 nm and a refractive index (RI) detector connected in series. The HPSEC analyses were based on single determinations. Calculation of Mw was carried out using the Agilent GPC/SEC software based on the UV 280 nm signal. To qualitatively study the relative proportion of lignin in the aqueous ammonia extracts, the ratio of RI signal to UV 280 nm signal (“RI/UV ratio”) was calculated from the recorded chromatograms. In the data processing, the RI trace was corrected for the inter detector delay, and only the values above the baseline level were used in calculations. Area under the RI/UV ratio trace was calculated following the trapezoid rule using Matlab.3 Results and discussion
3.1 Effect of autohydrolysis severity on soluble material released from wheat straw
A series of eight AH treatments at different maximum temperatures (170 °C to 200 °C) were carried out to study hemicellulose dissolution from wheat straw. Composition of the feedstock was almost similar compared to wheat straw used in an earlier AH study2 (Table 1). The concomitantly produced solid fractions presumably contained structurally modified lignin that was studied after extraction. The severity parameter (eqn (1)) was used to evaluate the heating effect (Fig. S1†) of the AH process under which many simultaneous reactions occur. Between 11% and 33% of wheat straw dissolved with increasing severity from log![[thin space (1/6-em)]](https://www.rsc.org/images/entities/char_2009.gif) R0 = 3.10 to log
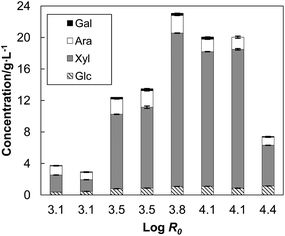
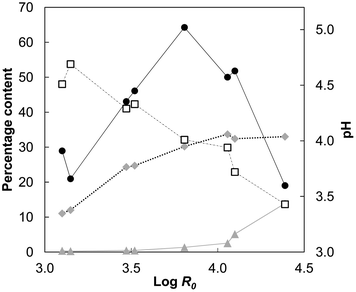
R0 = 3.10 to log![[thin space (1/6-em)]](https://www.rsc.org/images/entities/char_2009.gif) R0 = 4.39 (Table 2). Xylose and arabinose were the main sugars in the AH liquors (Fig. 2). Low amount of glucose was also detected in each of the liquors, including the liquors from the low severity treatments, suggesting dissolution of xyloglucan rather than hydrolysis of cellulose. The released organic acids decreased the pH linearly with increasing severity from the initial pH 4.5 to pH 3.4 at the highest severity (Fig. 3). At the optimum severity (log
R0 = 4.39 (Table 2). Xylose and arabinose were the main sugars in the AH liquors (Fig. 2). Low amount of glucose was also detected in each of the liquors, including the liquors from the low severity treatments, suggesting dissolution of xyloglucan rather than hydrolysis of cellulose. The released organic acids decreased the pH linearly with increasing severity from the initial pH 4.5 to pH 3.4 at the highest severity (Fig. 3). At the optimum severity (log![[thin space (1/6-em)]](https://www.rsc.org/images/entities/char_2009.gif) R0 = 3.81; 190 °C) 66% of xylan originally present in wheat straw was recovered. When the severity was increased to log
R0 = 3.81; 190 °C) 66% of xylan originally present in wheat straw was recovered. When the severity was increased to log![[thin space (1/6-em)]](https://www.rsc.org/images/entities/char_2009.gif) R0 = 4.39 (200 °C) only 17% of xylan was recovered, which means that 73% of the maximum amount of soluble xylan had been degraded (Table 2). These results show that optimum conditions for hemicellulose recovery lay within a narrow severity region wherein the AH liquor was obtained at pH 4.
R0 = 4.39 (200 °C) only 17% of xylan was recovered, which means that 73% of the maximum amount of soluble xylan had been degraded (Table 2). These results show that optimum conditions for hemicellulose recovery lay within a narrow severity region wherein the AH liquor was obtained at pH 4.
| Component | Current work | Carvalheiro et al.2 |
|---|---|---|
| a Expressed as anhydrous sugars.b Determined as Kjeldahl nitrogen × 6.25 in milled wheat straw based on single determination.c Esterified acid released by 2 M NaOH at room temperature. | ||
| Glucosea | 39.0 ± 0.3 | 38.9 ± 0.2 |
| Xylosea | 23.7 ± 0.1 | 18.1 ± 0.3 |
| Arabinosea | 1.6 ± 0.1 | 3.0 ± 0.2 |
| Galactosea | 0.8 ± 0.0 | — |
| Acetyl groups | 1.9 ± 0.0 | 2.5 ± 0.1 |
| Klason lignin | 21.8 ± 0.2 | 18.0 ± 0.5 |
| Protein | 3.1b | 4.5 ± 0.5 |
| p-Coumaric acidc | 0.23 ± 0.03 | — |
| Ferulic acidc | 0.13 ± 0.02 | — |
| Ash | 4.2 ± 0.1 | 9.7 ± 0.0 |
| Others (by difference) | 1.6 | 5.5 |
| Autohydrolysis parameters | Decomposition products in the liquid phase | ||||||||
|---|---|---|---|---|---|---|---|---|---|
| ID | log![[thin space (1/6-em)]](https://www.rsc.org/images/entities/char_2009.gif) R0 R0 |
Yield of SR | XOS yielda | Total phenolics (GAE) | Furfural | HMFb | Organic acidsc | ||
| For | Ace | Lev | |||||||
| a Yield of xylo-oligosaccharides (XOS) calculated based on anhydrous sugars as the total amount of xylose detected in the AH liquor divided by the xylan content of wheat straw.b Hydroxymethylfurfural.c Formic acid (For), acetic acid (Ace), levulinic acid (Lev). BDL, below detection limit. The initial concentration of acetic acid (0.4 g L−1) was deducted from the concentration of acetic acid detected in the AH liquors. Various results shown above were obtained from duplicate analyses with standard deviation less than 5% of the mean. | |||||||||
| (°C) | (g/100 g) | (g/100 g) | (g L−1) | (g L−1) | (g L−1) | (g L−1) | (g L−1) | (g L−1) | |
| 170(i) | 3.10 | 88.9 | 7.30 | 0.53 | 0.05 | BDL | 0.06 | 0.75 | 0.02 |
| 170(ii) | 3.15 | 88.0 | 5.00 | 0.50 | 0.04 | BDL | 0.09 | 0.72 | 0.03 |
| 180(i) | 3.47 | 75.7 | 31.9 | 1.00 | 0.10 | 0.02 | 0.12 | 1.10 | 0.03 |
| 180(ii) | 3.52 | 75.3 | 34.6 | 1.75 | 0.10 | 0.02 | 0.14 | 0.85 | 0.03 |
| 190(i) | 3.81 | 69.8 | 65.7 | 1.46 | 0.41 | 0.05 | 0.26 | 1.36 | 0.03 |
| 190(ii) | 4.06 | 66.3 | 57.6 | 1.96 | 0.90 | 0.06 | 0.80 | 2.47 | 0.05 |
| 195 | 4.10 | 67.6 | 59.4 | 2.11 | 1.74 | 0.11 | 0.76 | 2.14 | 0.05 |
| 200 | 4.39 | 67.0 | 17.4 | 2.17 | 4.82 | 0.29 | 1.13 | 3.04 | 0.06 |
As a result of the highest severity at log![[thin space (1/6-em)]](https://www.rsc.org/images/entities/char_2009.gif) R0 = 4.39, the liquor contained 4.8 g L−1 furfural and 1.1 g L−1 formic acid that are both probable degradation products of pentoses (Table 2). Accumulation of the sugar degradation products did not close the mass balance of pentoses in the AH liquors obtained at the minimum and maximum severities. Instead, approximately half of the lost xylose was probably degraded by further reactions such as resin formation by acid-catalyzed polycondensation of furfural.20,21 In the early work of Dunlop (1948),20 a reaction between furfural and lignin was suggested, but water-soluble phenolic mono- or oligomers could also give condensation products with either insoluble lignin or with furfural. However, the role of water-soluble phenolic compounds in formation of severely altered lignin that is often referred to as “pseudo-lignin”22 has not been completely elucidated. Wheat straw contained esterified phenolic acids FA and CA that are linked to grass hemicellulose and lignin, and particularly FA is incorporated in lignin–arabinoxylan cross-links, as reviewed by Ralph.23 These hydroxycinnamates are susceptible to undergo acid-catalyzed hydrolysis during AH. Concentration of water-soluble total phenolics in the AH liquors increased from 0.53 to 2.17 g L−1 with increasing severity (Table 2), but only a minor proportion of the maximum amount (19.6 mg g−1 straw) could have originated from the esterified phenolic acids (3.65 mg g−1 straw) in the feedstock. In fact, the HPLC analysis showed that FA and CA comprised together at most 6% of the concentration of total phenolics determined using the Folin–Ciocalteu procedure (Table S1 in the ESI†). Therefore, most of the water-soluble phenolics in the liquid phase originated from degradation of lignin.
R0 = 4.39, the liquor contained 4.8 g L−1 furfural and 1.1 g L−1 formic acid that are both probable degradation products of pentoses (Table 2). Accumulation of the sugar degradation products did not close the mass balance of pentoses in the AH liquors obtained at the minimum and maximum severities. Instead, approximately half of the lost xylose was probably degraded by further reactions such as resin formation by acid-catalyzed polycondensation of furfural.20,21 In the early work of Dunlop (1948),20 a reaction between furfural and lignin was suggested, but water-soluble phenolic mono- or oligomers could also give condensation products with either insoluble lignin or with furfural. However, the role of water-soluble phenolic compounds in formation of severely altered lignin that is often referred to as “pseudo-lignin”22 has not been completely elucidated. Wheat straw contained esterified phenolic acids FA and CA that are linked to grass hemicellulose and lignin, and particularly FA is incorporated in lignin–arabinoxylan cross-links, as reviewed by Ralph.23 These hydroxycinnamates are susceptible to undergo acid-catalyzed hydrolysis during AH. Concentration of water-soluble total phenolics in the AH liquors increased from 0.53 to 2.17 g L−1 with increasing severity (Table 2), but only a minor proportion of the maximum amount (19.6 mg g−1 straw) could have originated from the esterified phenolic acids (3.65 mg g−1 straw) in the feedstock. In fact, the HPLC analysis showed that FA and CA comprised together at most 6% of the concentration of total phenolics determined using the Folin–Ciocalteu procedure (Table S1 in the ESI†). Therefore, most of the water-soluble phenolics in the liquid phase originated from degradation of lignin.
3.2 Effect of autohydrolysis severity on molar mass distribution of AH liquors
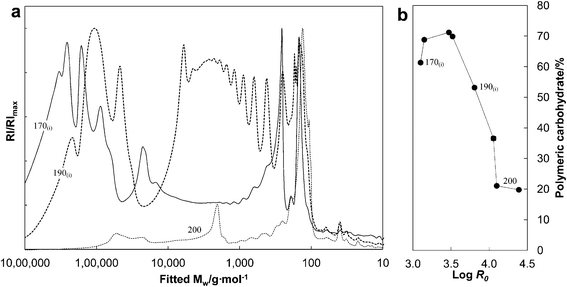
Molar mass distribution of hemicellulose is important, not only in food applications,24 but also with respect to utilization of hemicellulose in polymeric materials, as animal feed, or as carbon source for microorganisms. To assess the effect of AH severity on molar mass distribution of the AH liquors, comparison of the size exclusion chromatograms from minimum, medium, and maximum severities was made (Fig. 4). A majority of the dissolved matter released at low severity (log![[thin space (1/6-em)]](https://www.rsc.org/images/entities/char_2009.gif) R0 = 3.10) was highly polymeric, but there was also a distinct peak corresponding to 50
R0 = 3.10) was highly polymeric, but there was also a distinct peak corresponding to 50![[thin space (1/6-em)]](https://www.rsc.org/images/entities/char_2009.gif) 000 g mol−1 and peaks corresponding to molar masses of xylobiose and xylose (170(i) in Fig. 4). With increasing severity the highly polymeric fraction shifted towards the lower molar mass region showing peak maxima between 150 g mol−1 and 6000 g mol−1 (190(i) in Fig. 4). The highest severity rendered the AH liquor almost completely devoid of highly polymeric material, but the presence of lower molar mass material was still detected, including a distinct peak with an approximate molar mass of 2000 g mol−1 in addition to the peak in the monosaccharide region.
000 g mol−1 and peaks corresponding to molar masses of xylobiose and xylose (170(i) in Fig. 4). With increasing severity the highly polymeric fraction shifted towards the lower molar mass region showing peak maxima between 150 g mol−1 and 6000 g mol−1 (190(i) in Fig. 4). The highest severity rendered the AH liquor almost completely devoid of highly polymeric material, but the presence of lower molar mass material was still detected, including a distinct peak with an approximate molar mass of 2000 g mol−1 in addition to the peak in the monosaccharide region.
Between 61–70% of the total carbohydrate remained in polymeric form as a result of low severities wherein the maximum treatment temperature ranged from 170 °C to 180 °C (Fig. 4). This suggests that at low severities the cleavage of arabinoxylans from the solid fraction was a faster reaction than hydrolysis of the released arabinoxylans. When the severity was increased beyond log![[thin space (1/6-em)]](https://www.rsc.org/images/entities/char_2009.gif) R0 = 3.5 (maximum AH temperature ≥ 190 °C), soluble carbohydrates with decreasing proportion of polymeric carbohydrate was obtained. Only 20% of the dissolved carbohydrate was polymeric as a result of the AH at log
R0 = 3.5 (maximum AH temperature ≥ 190 °C), soluble carbohydrates with decreasing proportion of polymeric carbohydrate was obtained. Only 20% of the dissolved carbohydrate was polymeric as a result of the AH at log![[thin space (1/6-em)]](https://www.rsc.org/images/entities/char_2009.gif) R0 = 4.39 at the maximum temperature of 200 °C. The proportion of polymeric carbohydrate was 53.2% at the severity log
R0 = 4.39 at the maximum temperature of 200 °C. The proportion of polymeric carbohydrate was 53.2% at the severity log![[thin space (1/6-em)]](https://www.rsc.org/images/entities/char_2009.gif) R0 = 3.81 corresponding to the maximum recovery yield of xylan (Table 2). These results were consistent with the changes in the molar mass distributions as a function of severity (Fig. 4).
R0 = 3.81 corresponding to the maximum recovery yield of xylan (Table 2). These results were consistent with the changes in the molar mass distributions as a function of severity (Fig. 4).
3.3 Effect of autohydrolysis severity on yield and composition of the aqueous ammonia extracts
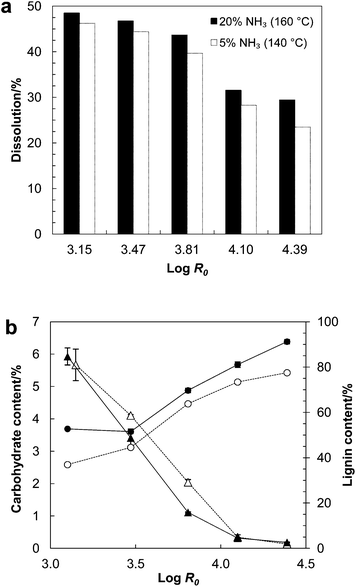
The solid residues from AH treatments were extracted with NH3 (aq) in moderate (5% NH3, 140 °C) and high (20% NH3, 160 °C) intensity conditions to study the impact of AH severity on yield and composition of lignin. NH3 (aq) dissolved 48% to 23% of AH solid residues with the amount decreasing with increasing AH severity (Fig. 5). Only 5% more material dissolved from the solid residues from the mildest AH (log![[thin space (1/6-em)]](https://www.rsc.org/images/entities/char_2009.gif) R0 = 3.15) in the high intensity extraction (20% NH3, 160 °C) compared to the moderate intensity extraction (5% NH3, 140 °C). However, this percentage was increased to 20% with the solids from the highest severity AH (log
R0 = 3.15) in the high intensity extraction (20% NH3, 160 °C) compared to the moderate intensity extraction (5% NH3, 140 °C). However, this percentage was increased to 20% with the solids from the highest severity AH (log![[thin space (1/6-em)]](https://www.rsc.org/images/entities/char_2009.gif) R0 = 4.39). This rapid change is in contrast to what was observed in AH where a plateau in dissolution was nearly reached already after log
R0 = 4.39). This rapid change is in contrast to what was observed in AH where a plateau in dissolution was nearly reached already after log![[thin space (1/6-em)]](https://www.rsc.org/images/entities/char_2009.gif) R0 = 3.81. Hence, in spite of small changes in dissolution during AH beyond log
R0 = 3.81. Hence, in spite of small changes in dissolution during AH beyond log![[thin space (1/6-em)]](https://www.rsc.org/images/entities/char_2009.gif) R0 = 3.81, reactions between the solid fraction and carbohydrate degradation products started forming a less soluble straw matrix. The proportion of carbohydrate in the dried aqueous ammonia extract decreased from 6% to 0.2% and the lignin content increased from 37% to 91% when the extractions were made on solid residues obtained as a function of increasing AH severity (Fig. 5). These results suggest that AH severity governs extractability of the solid residues and the amount of carbohydrates associated with lignin in the alkali-soluble fractions.
R0 = 3.81, reactions between the solid fraction and carbohydrate degradation products started forming a less soluble straw matrix. The proportion of carbohydrate in the dried aqueous ammonia extract decreased from 6% to 0.2% and the lignin content increased from 37% to 91% when the extractions were made on solid residues obtained as a function of increasing AH severity (Fig. 5). These results suggest that AH severity governs extractability of the solid residues and the amount of carbohydrates associated with lignin in the alkali-soluble fractions.
3.4 Effect of autohydrolysis severity on molar mass of lignin
Molar mass and structure of lignin was studied to elucidate the changes occurring as a function of AH severity. Lignin extracted from straw without AH showed weight average molar mass (Mw) of 4690 g mol−1 (Fig. S2†), whereas after AH Mw of lignin in the aqueous ammonia extracts decreased from 5450 g mol−1 to 1810 g mol−1 with increasing preceding AH severity (Fig. 6). At severities below log![[thin space (1/6-em)]](https://www.rsc.org/images/entities/char_2009.gif) R0 = 4.1, higher Mw was obtained from the moderate intensity extraction compared to the high intensity NH3 (aq) extraction. When severity exceeded log
R0 = 4.1, higher Mw was obtained from the moderate intensity extraction compared to the high intensity NH3 (aq) extraction. When severity exceeded log![[thin space (1/6-em)]](https://www.rsc.org/images/entities/char_2009.gif) R0 = 4.1, the molar mass of aqueous ammonia extracts leveled-off to approximately 1900 g mol−1, regardless of the intensity of the extraction (Fig. 6). From the standpoint of lignin depolymerization, it is likely that only minor changes occurred in interunit linkages of lignin as a result of the NH3 (aq) extractions. This is because relatively drastic alkaline conditions are required for the cleavage of aryl ether bonds, the predominant fragmentation reaction of lignin in alkaline media.25 From this basis, higher Mw obtained with the moderate intensity NH3 (aq) extraction suggests that cleavage of lignin–carbohydrate linkages10 from the solid fraction occurred more at the high intensity extraction. As was shown above in Section 3.2, the AH liquors mainly comprising of hemicellulosic sugars gave molar mass distributions showing highly polymeric material. With the two highest severities (log
R0 = 4.1, the molar mass of aqueous ammonia extracts leveled-off to approximately 1900 g mol−1, regardless of the intensity of the extraction (Fig. 6). From the standpoint of lignin depolymerization, it is likely that only minor changes occurred in interunit linkages of lignin as a result of the NH3 (aq) extractions. This is because relatively drastic alkaline conditions are required for the cleavage of aryl ether bonds, the predominant fragmentation reaction of lignin in alkaline media.25 From this basis, higher Mw obtained with the moderate intensity NH3 (aq) extraction suggests that cleavage of lignin–carbohydrate linkages10 from the solid fraction occurred more at the high intensity extraction. As was shown above in Section 3.2, the AH liquors mainly comprising of hemicellulosic sugars gave molar mass distributions showing highly polymeric material. With the two highest severities (log![[thin space (1/6-em)]](https://www.rsc.org/images/entities/char_2009.gif) R0 ≥ 4.1) the lignin–carbohydrate linkages were probably completely cleaved from the solids, and thus similar Mw values were obtained with either NH3 (aq) extraction intensity. This is in accordance with the composition of the resulting ammonia extracts that showed similarly low carbohydrate contents regardless of the extraction intensity (Fig. 5). Moreover, a positive linear correlation (R2 = 0.93) was found between Mw and carbohydrate content of the aqueous ammonia extracts (Fig. S3†). Hence, a higher amount of carbohydrates associated with lignin led to a higher observed molar mass of the aqueous ammonia extract.
R0 ≥ 4.1) the lignin–carbohydrate linkages were probably completely cleaved from the solids, and thus similar Mw values were obtained with either NH3 (aq) extraction intensity. This is in accordance with the composition of the resulting ammonia extracts that showed similarly low carbohydrate contents regardless of the extraction intensity (Fig. 5). Moreover, a positive linear correlation (R2 = 0.93) was found between Mw and carbohydrate content of the aqueous ammonia extracts (Fig. S3†). Hence, a higher amount of carbohydrates associated with lignin led to a higher observed molar mass of the aqueous ammonia extract.
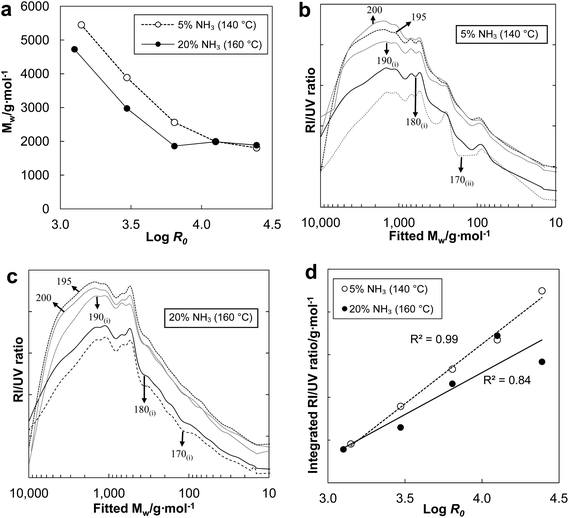 | ||
| Fig. 6 (a) Weight average molar masses (Mw) of the extracts from moderate and high intensity NH3 (aq) extraction of AH solid residues. HPSEC refractive index (RI) signal to UV 280 nm signal ratios (RI/UV) of the ammonia extracts obtained from AH solid residues with moderate (b) and high (c) intensity extraction. Arrows indicate the maximum AH temperature that corresponds to the severity given in Table 2. (d) Integrated RI/UV ratios as a function of AH severity. | ||
An earlier study compared yields of thioethylated lignin monomers released by thioacidolysis of native wheat straw and solid residues from acid-impregnated steam-exploded wheat straw, and found 77% decrease in lignin units only linked by aryl ether bonds.26 Even though acidity in the AH liquors was lower compared to the pretreatment catalyzed by sulfuric acid, fragmentation of aryl ether linkages by acidolysis and condensation of lignin are expected to be the main reaction mechanisms in both media.26 The resulting aqueous ammonia extracts likely contained varying proportions of “pseudo-lignin”. Interestingly, a polymeric product from the acid-catalyzed homopolymerization of furfural has been shown to have weight average molar mass of 1700 g mol−1,22 almost similar to the Mw values of the aqueous ammonia extracts after the high severity (log![[thin space (1/6-em)]](https://www.rsc.org/images/entities/char_2009.gif) R0 ≥ 4.1) AH treatments (Fig. 6). Structure of lignin was thus put under closer study.
R0 ≥ 4.1) AH treatments (Fig. 6). Structure of lignin was thus put under closer study.
3.5 Changes in lignin structure as a function of autohydrolysis severity
The aqueous ammonia extracts after high severity AH contained the highest relative lignin content (Fig. 5), but probably the determination based on the extinction coefficient at 280 nm included increasing proportion of “pseudo-lignin”. To study these possible structural changes in lignin, the ratio of refractive index (RI) signal to UV 280 nm signal from the HPSEC analysis was calculated and referred to as RI/UV ratio. This allowed comparison of relative proportions of lignin, mainly contributing to the UV 280 nm signal, and substances that would give higher relative RI response such as “pseudo-lignin” or pure carbohydrates that do not absorb at 280 nm. A higher RI/UV ratio would thus indicate a lower relative proportion of lignin at the given molar mass. Increasing AH severity increased the RI/UV ratio of the aqueous ammonia extract (Fig. 6). Integral of the RI/UV ratio gives an estimate of the relative proportion of non-lignin substances in the aqueous ammonia extract. When the integrated RI/UV ratios were plotted as a function of AH severity, a positive linear correlation was observed with the aqueous ammonia extracts obtained from both moderate (R2 = 0.99) and high (R2 = 0.84) intensity NH3 (aq) extraction (Fig. 6). The better correlation obtained with the moderate intensity extraction indicates that more non-aromatic material was co-dissolved with lignin under the lower intensity extraction, suggesting that “pseudo-lignin” was more soluble in NH3 (aq) than the residual lignin. In fact, when wheat straw was subjected to 30 min treatment in boiling water bath instead of AH and the washed residues were extracted with 5% NH3 (aq), the resulting integrated RI/UV ratio gave a perfect fit to the moderate intensity extraction series (Fig. S2†).The extracts from the moderate intensity extraction were subjected to the cupric oxide oxidation to determine the amount of native lignin in the extracts. The main oxidation products released from the aqueous ammonia extracts were vanillin, syringaldehyde, acetovanillone, and acetosyringone. Among these the syringyl compounds are assignable only to lignin, but according to the view that “pseudo-lignin” is mainly comprised of polymeric products from furfural, the total amount of phenolic products released in the oxidation was calculated relative to the UV-lignin content of the extract. Now, a higher proportion of native lignin in the sample would give a higher yield of phenolic oxidation products. It was observed that as the AH severity was increased, the yield of the phenolic oxidation products from the ammonia extracts decreased linearly (R2 = 0.93) from 238 mg g−1 to 107 mg g−1 in relation to their UV-lignin content (Fig. 7). This is consistent with the indirect evidence provided by the HPSEC analysis, and it appears that “pseudo-lignin” accumulated into the solid fraction during AH because at the same time the amount of carbohydrates associated with lignin in the aqueous ammonia extracts decreased (Fig. 5). Put together, these results together elucidate the generation of “pseudo-lignin” in AH. Percentage amount of “pseudo-lignin” associated with native lignin in the aqueous ammonia extracts was estimated by assuming that only a low level of “pseudo-lignin” was generated in the mild AH treatment (log![[thin space (1/6-em)]](https://www.rsc.org/images/entities/char_2009.gif) R0 = 3.15). Hence, comparison of the maximum and minimum yields of cupric oxide oxidation products from the aqueous ammonia extracts suggests 55% decrease in the relative amount of native lignin.
R0 = 3.15). Hence, comparison of the maximum and minimum yields of cupric oxide oxidation products from the aqueous ammonia extracts suggests 55% decrease in the relative amount of native lignin.
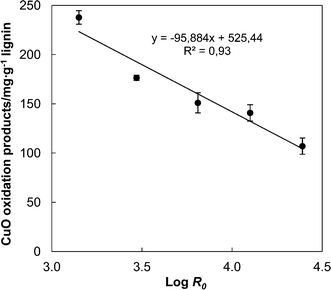 | ||
| Fig. 7 The total yield of cupric oxide oxidation products released from aqueous ammonia extracts (moderate intensity extraction, 5% NH3, 140 °C) as a function of AH severity. | ||
4 Conclusion
Molar mass of lignin decreases as a result of autohydrolysis due to three main reactions that show increased occurrence at high autohydrolysis severity. Cleavage of lignin–carbohydrate linkages occurs first, followed by the release of soluble phenolic substances mainly from lignin. These two reactions are associated with generation of “pseudo-lignin” mainly from degradation products of pentoses. Higher severity induces accumulation of more “pseudo-lignin” within the temperature range between 170 °C and 200 °C. It can be concluded that autohydrolysis severity is a crucial parameter that affects properties of hemicellulose and lignin. Relatively small increase beyond the optimum severity for xylan recovery leads to drastic carbohydrate degradation. It is important to distinguish the amount of “pseudo-lignin” in fractions obtained from lignocellulosic materials subjected to acidic hydrothermal treatment for accurate interpretation of the structural changes in native lignin. Better understanding of the role of “pseudo-lignin” in enzymatic hydrolysis of solid fractions from acidic pretreatments would also be valuable. It appears that in order to obtain a higher yield of hemicellulose and to reduce “pseudo-lignin” production during autohydrolysis, dissolved sugar residues should be removed from the reaction medium. This could be achieved either by performing the autohydrolysis in a sequential operation mode or in a percolation reactor.Acknowledgements
The authors thank Kati Vilonen and Juha Linnekoski for assistance with the autoclave reactor. Auli Murrola and Ulla Åhman are thanked for technical assistance with the HPLC analysis of organic acids. Funding from Neste Oil Corporation and the Finnish Funding Agency for Technology and Innovation (Tekes) within the Trident II project is gratefully acknowledged.References
- E. Simonsen, Angew. Chem., 1898, 11, 1007–1012 CrossRef.
- F. Carvalheiro, T. Silva-Fernandes, L. C. Duarte and F. M. Gírio, Appl. Biochem. Biotechnol., 2009, 153, 84–93 CrossRef CAS PubMed.
- A. J. J. E. Eerhart, W. J. J. Huijgen, R. J. H. Grisel, J. C. van der Waal, E. de Jong, A. De Sousa Dias, A. P. C. Faaij and M. K. Patel, RSC Adv., 2014, 4, 3536–3549 RSC.
- S. P. M. da Silva, A. R. C. Morais and R. Bogel-Lukasik, Green Chem., 2014, 16, 238–246 RSC.
- G. Garrote, H. Dominguez and J. C. Parajó, Holz Roh- Werkst., 1999, 57, 191–202 CrossRef CAS.
- M. J. Selig, S. Viajamala, S. R. Decker, M. P. Tucker, M. E. Himmel and T. B. Vinzant, Biotechnol. Prog., 2007, 23, 1333–1339 CrossRef CAS PubMed.
- E. Beckman, O. Liesche and F. Lehman, Biochem. Z., 1923, 139, 491–508 Search PubMed.
- T. H. Kim and Y. Y. Lee, Bioresour. Technol., 2006, 97, 224–232 CrossRef CAS PubMed.
- V. Pihlajaniemi, S. Sipponen, M. H. Sipponen, O. Pastinen and S. Laakso, Bioresour. Technol., 2014, 153, 15–22 CrossRef CAS PubMed.
- K. Iiyama, T. B. T. Lam and B. A. Stone, Phytochemicals, 1990, 29, 733–737 CrossRef CAS.
- P. Sannigrahi, D. H. Kim, S. Jung and A. Ragauskas, Energy Environ. Sci., 2011, 4, 1306–1310 CAS.
- R. P. Overend and E. Chornet, Philos. Trans. R. Soc., A, 1987, 321, 523–536 CrossRef CAS.
- J. Sluiter, R. O. Ruiz, C. J. Scarlata, A. D. Sluiter and D. W. Templeton, J. Agric. Food Chem., 2010, 58, 9043–9053 CrossRef CAS PubMed.
- T. Culhaoglu, D. Zheng, V. Méchin and S. Baumberger, J. Chromatogr. B: Anal. Technol. Biomed. Life Sci., 2011, 879, 3017–3022 CrossRef CAS PubMed.
- M. H. Sipponen, C. Lapierre, V. Méchin and S. Baumberger, Bioresour. Technol., 2013, 133, 522–528 CrossRef CAS PubMed.
- G. L. Miller, Anal. Chem., 1959, 31, 426–428 CrossRef CAS.
- A. L. Waterhouse, in Current protocols in food analytical chemistry, ed. R. E. Wrolstad, T. E. Acree, H. An, E. A. Decker, M. H. Penner, D. S. Reid, S. J. Schwartz, C. F. Shoemaker and P. Sporns, John Wiley & Sons, Inc., New York, 1st edn, 2002, supplement 6, pp. I1.1.1–I1.1.8 Search PubMed.
- J. M. Pepper, B. W. Casselman and J. C. Karapally, Can. J. Chem., 1967, 45, 3009–3012 CrossRef CAS.
- F. Chen and J. Li, J. Wood Chem. Technol., 2000, 20, 265–276 CrossRef CAS.
- A. P. Dunlop, Ind. Eng. Chem., 1948, 40, 204–209 CrossRef CAS.
- M. Choura, N. M. Belgacem and A. Gandini, Macromolecules, 1996, 29, 3839–3850 CrossRef CAS.
- F. H. Hu, S. Jung and A. Ragauskas, Bioresour. Technol., 2012, 117, 7–12 CrossRef CAS PubMed.
- J. Ralph, Phytochem. Rev., 2010, 9, 65–83 CrossRef CAS.
- M. J. Vázquez, J. L. Alonso, H. Domínguez and J. C. Parajó, Trends Food Sci. Technol., 2000, 11, 387–393 CrossRef.
- J. Gierer, Wood Sci. Technol., 1985, 19, 289–312 CAS.
- S. Heiss-Blanquet, D. Zheng, N. L. Ferreira, C. Lapierre and S. Baumberger, Bioresour. Technol., 2011, 102, 5938–5946 CrossRef CAS PubMed.
Footnote |
| † Electronic supplementary information (ESI) available. See DOI: 10.1039/c4ra03236e |
| This journal is © The Royal Society of Chemistry 2014 |

