Youlan Zou,
Xiangyang Zhou* and
Juan Yang*
School of Metallurgy and Environment, Central South University, Changsha, 410083, China. E-mail: lanlinliao@163.com; zylan0935@csu.edu.cn; Fax: +86 073188836329; Tel: +86 073188836329
First published on 21st May 2014
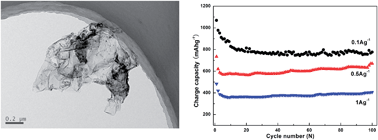
An electrode composed of graphene/carbon nanospheres is synthesized via in situ polymerization and carbonization, for Li-ion batteries. Carbon nanospheres derived from carbonized polypyrrole are grown on the surface of graphene and assembled into a flake-like structure. The synergistic effect between carbon and graphene improves the capacity and rate capability of the electrode.
Graphite oxide (GO) was first synthesized by a modified Hummers' method.6 Graphite oxide (120 mg) was dispersed into 100 mL of pure water by ultrasonication for 2 h to obtain an exfoliated yellow-brown GO suspension, then the suspension was heated at 160 °C for 2 h in a sealed autoclave resulting in a graphene solution. FeCl3·6H2O (9.8 g) and sodium phenylsulfonate (SDBS, 3 g) were dissolved in the graphene solution over an ice bath, then pyrrole (Py) monomer (1 mL) was added. After magnetic stirring at 0 °C for 5 h, a black precipitate of graphene/PPy nanospheres was generated, and was then washed and dried under vacuum at 0 °C for 2 days. This was followed by heating in a tube furnace under high-purity Ar at 805 °C for 2 h at a heating rate of 3 °C min−1. For comparison, carbon nanospheres without added graphene were prepared under the same conditions.
Scanning electron microscopy (SEM, JSM-6360LV, JEOL, Japan), atomic force microscopy (AFM, NanoScope (R) III, Bruker, USA) and transmission electron microscopy (TEM, JEM-2100F, JEOL, Japan) images were taken to characterize the morphology and structure of the samples. Laser Raman spectroscopy (BX41, OLYMPUS) with an excitation wavelength of 488 nm and a KAr matrix was used to investigate the carbonized materials. The electrode was prepared by mixing 80% sample, 10% carbon black and 10% polyvinylidene fluoride and dissolving the mixture in N-methylpyrrolidinone to form a slurry, which was then coated onto a copper foil and dried overnight at 120 °C in a vacuum for 12 h. The coin cell was assembled in a glove box (Super 1220/750) filled with pure argon. Metallic lithium was used as the negative electrode and counter electrode. The electrolyte was 1 mol L−1 LiPF6 dissolved in a mixture of ethylene carbonate/diethyl carbonate (1:
1 v/v). Galvanostatic discharge–charge experiments were performed over a potential range of 3–0.01 V vs. Li+/Li using a LANDT battery testing system (CT-2001A). The cyclic voltammograms (CV) were measured at a scanning rate of 0.2 mV s−1 using an electrochemical workstation (Solartron 1470E). The total weight of the graphene/carbon composite was used to calculate the capacity values.
The formation mechanism of graphene/carbon composite is depicted in Scheme 1. The approach is designed on the basis of the unique amphiphilic character of graphene with negatively charged hydrophilic and hydrophobic properties.7 When the negatively charged ammonium ion of SDBS is combined with graphene dispersions, the surfactant micelles adsorb on the surface of the graphene sheets. FeCl3·6H2O acts as the oxidant. Then, Py monomer is added and induced on the surface of the graphene sheets by SDBS. In situ chemical oxidation polymerization occurs just on the surface of graphene to form a graphene/PPy composite. Finally, the graphene/PPy composite is placed into the tube furnace to transfer the PPy into the carbon and to remove the functional groups of graphene.
Fig. 1 depicts the morphologies and structures of the pure carbon powder and the graphene/carbon composite. The SEM image (Fig. 1a) of the carbon powder shows an homogeneous morphology of single nanospheres of about 20 nm in diameter. The SEM image of the graphene/carbon composite (Fig. 1b) shows the flake-like morphology which is several micrometers (typically 12–15 μm) in size. TEM images (Fig. 1c and d) demonstrate that the graphene/carbon composite retains the spherical structure of the pure carbon powder. The spherical carbon is distributed on the flexible and crumpled graphene nanosheets.
![]() | ||
Fig. 1 (a) SEM image of carbon powder, (b) SEM, (c) and (d) TEM images of graphene/carbon composite. |
The AFM image (Fig. 2) confirms that the average particle size of the carbon nanospheres for the graphene/carbon composite is in the range of 6–8 nm, which is much smaller than that of pure carbon powder (seen from Fig. 1a). This is because graphene facilitates the dispersion of the Py monomer and hinders the growth of the PPy granules.
The X-ray diffraction (XRD) spectra in Fig. 3a show the composition and crystallinity of graphene and graphene/carbon. The graphene nanosheets show only a weak (002) diffraction line at 2θ = 24°.8 When compared with graphene, an additional two peaks at around 20–25° can be observed for the graphene/carbon composite, indicating that amorphous phases are introduced to the composite. Raman spectra prove to be an essential tool to characterize graphene and other carbon materials. The D-band is a measure of disorder originating from defects and the G-band is representative of sp2 hybridized carbon bonds.9 A Raman spectrum of graphene/carbon composite (Fig. 3b) displays a strong G-band at 1580.4 cm−1 and a weak D-band at 1366.4 cm−1. The G/D intensity ratio (0.97) is a little lower than that of G (1.01). This is because of the synergistic effect that the ordered graphene and disordered carbon nanospheres both introduce to graphene/carbon composite.10 The D + G/2D intensity ratio is used to demonstrate the defect concentration of graphene.11 Another two peaks for the graphene/carbon composite are located at about 2692.3 cm−1 and 2930.5 cm−1 and can be ascribed to the 2D and D + G modes, respectively. The D + G/2D intensity ratio for the graphene/carbon composite decreases in comparison with that of pure graphene, suggesting that the defect concentration for graphene/carbon composite is much reduced. FTIR spectra of the pure graphene, pure carbon powder and graphene/carbon composite are shown in Fig. 3c. The FTIR spectrum of graphene illustrates that the bands of O–H at around 1320 cm−1, O–H at 3490 cm−1, and CO at 1760 cm−1 gradually disappear, clarifying that the peaks for oxygen functional groups are gradually removed, to form reduced graphene sheets. It is clearly seen from the FTIR spectrum of the pure carbon powder that the peak at 3390 cm−1 is caused by N–H stretching of the PPy ring. The peaks at 3030 and 2910 cm−1 are designated as the asymmetric stretching and symmetric vibrations of methylene. The band at 1770 cm−1 corresponds to the C
C backbone stretching. The bands at 1250 and 1570 cm−1 may be assigned to the stretching vibration of the doping state and vibrations of C–N stretching of PPy, respectively. After the carbon powder was made into a composite with graphene, the spectrum of graphene/carbon presents the structure changes of both the graphene and carbon powder.
The electrochemical performance of the graphene/carbon composite was investigated in coin cells using lithium as the counter electrode. Fig. 4a illustrates the CV curves of the graphene/carbon composite. From the first cycle, the irreversible peaks at 0.8 and 0.5 V are associated with the solid electrolyte interphase (SEI) films at the electrode–electrolyte interface and the irreversible insertion of Li-ions into an enclosed space that are confined by crumpled graphene, respectively.12 No irreversible peak is observed in the second and third cycles, indicating that the integrated SEI films have been formed in the first cycle. The reversible peaks at about 0.01 and 0.2 V are related to the reversible Li-ions' reaction with graphene and carbon nanospheres, respectively.13 In the first cycle (Fig. 4b), the graphene/carbon electrode delivers a very high reversible charge capacity of 1187.7 mA h g−1 at 0.05 A g−1 in the voltage range of 0.01 to 3.0 V (vs. Li+/Li), which is almost three times higher than the theoretical capacity of graphite (372 mA h g−1) and is also higher than that of pure carbon powder (793.6 mA h g−1). For comparison, the initial charge capacity for graphene is found to be 1108 mA h g−1 at 0.05 A g−1, indicating that graphene provides extra capacity for graphene/carbon. It is interesting to note that the charge capacity of graphene/carbon is higher than that of the pure carbon powder and pure graphene, which indicates that the carbon powder and graphene provide other lithium storage mechanisms on the electrode apart from the classical graphite intercalation compound mechanism. The introduction of graphene to form flake-like structures limits the volume expansion of the carbon nanospheres. The surface of graphene provides sufficient electrode/electrolyte interface to absorb Li-ions and promotes a rapid charge-transfer reaction. Graphene also supplies a large number of active sites for Li-ion migration, enhances the conductivity and shortens the electronic transport route. Moreover, carbon nanospheres inserted between the graphene layers expand the gap between the interlayers, which in turn allows easier migration of Li-ions. Carbonization of PPy would be a good approach to introduce a N heteroatom into carbon materials, which would potentially benefit and improve the capacity of the electrode.14 In addition, the spaces enclosed by the carbon nanospheres and graphene are beneficial for ion/electron transfer and provide sufficient contact between the active materials and the electrolyte. After the first 20 cycles, the electrode becomes highly reversible. More importantly, the graphene/carbon composite exhibits a stable cycling performance, which is the same as that of the pure carbon powder (Fig. 4c). The capacity of graphene/carbon remains at 850 mA h g−1 after 50 cycles at 0.05 A g−1, compared with that of 690 mA h g−1 for pure carbon nanospheres, and 721.9 mA h g−1 for pure graphene. The results demonstrate that the synergistic effect between carbon nanospheres and graphene sheets improves the cycling stability of the graphene/carbon electrode. Rate capability is another important factor for the graphene/carbon electrode in Li-ion batteries, as they are required to provide high specific capacities at a high current density. The rate performance of graphene/carbon is presented in Fig. 4d. The capacity of graphene/carbon decreases gradually with increase of current density from 0.1 to 1 A g−1, whereas the specific capacity increases gradually during cycling at each current, indicating a stable structure and sufficient permeation of the electrolyte into the interior of the electrode. When the current densities increase to 0.1, 0.5 and 1 A g−1, the anodes maintain charge capacities of 776.4, 670.9 and 407.2 mA h g−1, respectively, after 100 cycles. The results imply that the flake-like graphene/carbon electrode is very effective at improving the rate performance.
![]() | ||
Fig. 4 (a) CV curves, (b) the first charge–discharge curves, (c) cyclic performance and (d) rate capability of graphene/carbon. |
In this study, a simple approach was developed to prepare flake-like graphene/carbon nanospheres. PPy nanospheres grown on the graphene layers were transformed into carbon nanospheres after carbonization. The carbon nanospheres with an average diameter of 6–8 nm are homogeneously distributed between the graphene sheets as spacers to separate the neighboring graphene. Graphene serves as a highly conductive support material and provides a large surface for well-dispersed deposition of carbon nanospheres. The flake-like structure is beneficial for fast ion/electron transfer and there is sufficient contact between active materials and the electrolyte. This material exhibits improved capacity, rate capability and cycling stability.
This journal is © The Royal Society of Chemistry 2014 |