 Open Access Article
Creative Commons Attribution 3.0 Unported Licence
Role of lithium and co-existing cations in electrolyte to improve performance of dye-sensitized solar cells†
Soichiro Tayaa,
Shota Kuwahara*a,
Qing Shenbc,
Taro Toyodabc and
Kenji Katayama*a
aDepartment of Applied Chemistry, Chuo University, 1-13-27, Kasuga, Bunkyo, Tokyo 112-8551, Japan. E-mail: kkata@kc.chuo-u.ac.jp; Fax: +81-3-3817-1913; Tel: +81-3-3817-1913
bDepartment of Engineering Science, The University of Electro-Communications, 1-5-1 Chofugaoka, Chofu, Tokyo 182-8585, Japan
cCREST, Japan Science and Technology Agency (JST), 4-1-8 Honcho Kawaguchi, Saitama 332-0012, Japan
First published on 7th May 2014
Abstract
The performance of dye-sensitized solar cells (DSSCs) with an electrolyte including mixed cations was evaluated, and the relevant carrier dynamics were investigated by the heterodyne transient grating method. The performance of the DSSCs showed maximum conversion efficiency for an Li+ cation ratio of 75% with 25% other cations.
The light harvesting efficiency of dye-sensitized solar cells (DSSCs) has been improved and maximized by adjusting the composition of the electrolytes appropriately. Cation species are one of the effective constituents in an electrolyte, and a suitable amount of cations or mixing ratio with different cations gave high performance DSSCs.1–5 The working principles for optimization of DSSCs by cation species were (1) the control of the conduction band edge of the semiconductor,6,7 and (2) the suppression of the electron–electrolyte recombination.8 These effects arise from the properties of cations such as the ionic radius and adsorptivity on a TiO2 surface.6–8
Recently, we demonstrated the observation of the carrier dynamics by using the heterodyne transient grating (HD-TG) method, and the charge dynamics at a TiO2/electrolyte interface in DSSCs such as the dynamic motion of ions in electrolyte solutions and the electron–electrolyte recombination, were successfully observed.9,10 The effect of cation species (lithium ion (Li+), 1,2-dimethyl-3-propylimidazolium ion (DMPI+), tetra-n-butylammonium ion (TBA+)) on the dynamics was also clarified by this method.11 The result indicated that the probability of the electron–electrolyte recombination could be controlled by the TBA+ or DMPI+ ions, which helped blocking the penetration of electron acceptors, I3− (or I2), into the nanoporous dyes/TiO2 electrode.8 On the other hand, Li+ helps increasing the amount of the injected electrons due to the decrease in the flatband potential.6,7,12 Those results suggest that mixing TBA+ or DMPI+ with Li+ might improve the conversion efficiency of DSSCs, because both the effects; the control of the conduction band and the suppression of the electron–electrolyte recombination, could be optimized. In this study, the performance of DSSCs for the electrolyte with mixed cations was evaluated, and the working mechanism was explained by the carrier dynamics investigated by the HD-TG method.
The method for the preparation of the working electrodes was shown in the previous reports.9,11 Nanostructured TiO2 films were immersed in a N3 dye (cis-bis(iso-thiocyanato)bis(2,2′-bipyridyl-4,4′-di-carboxylato) ruthenium(II)) bath for 24 h. An electrochemical cell was prepared by putting another glass plate together with a silicon rubber spacer, and the spacing between the electrode and the glass plate was less than 1 mm. A platinum wire was put in the cell as a counter electrode. The electrolytes with different cations were composed of 0.3 M MI (M+ = Li+, DMPI+, TBA+), 30 mM I2 in acetonitrile (ACN).
The principle and the setup of the HD-TG method were reported in detail in the previous papers.9,13 In this study, the pump light source was the second harmonic of an Nd:YAG laser (Surelite, Continuum, Electro-Optics Inc.). The pump pulse had a wavelength of 532 nm, a pulse width of 5 ns, an intensity of ∼0.5 mJ per pulse, and the probe light was a CW semiconductor laser with a wavelength of 635 nm. The pump and probe lights were incident from the FTO substrate side to avoid the pump light absorption by the electrolyte.
The photocurrent–voltage (I–V) characteristics of the DSSCs were measured by a potentiostat (HA-151B, Hokuto Denko) under the probe light illumination with a wavelength of 635 nm, which was also used for the HD-TG measurement. The probe light intensity was 2.16 mW, and the illuminated area was 0.20 cm−2.
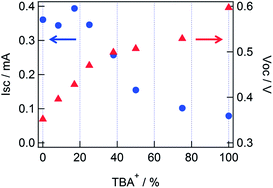
A series of the electrolytes with the mixed cations of TBA+ with Li+ were prepared, and the performances of the DSSCs were evaluated (Table 1). The concentration of each cation was changed as the total cation concentration was remained to be 0.3 M. As shown in Fig. 1, Isc was constant around 0.34 mA in 0–25% of TBA+ (ET4), and then decreased as increase in the TBA+ ratio. Voc was increased as increase in the concentration of TBA+, and the slope of the increase was changed around 25% of TBA+. The conversion efficiency for ET4 showed the maximum as a result.
| LiI (M) | TBAI (M) | TBA+b (%) | Isc (mA) | Voc (V) | FF | ηc (%) | |
|---|---|---|---|---|---|---|---|
| a The electrolytes were an acetonitrile solution including 30 mM I2.b The ratio of the amount of TBA+ to the total amount of cations in the electrolyte.c Conversion efficiency. | |||||||
| ET1 | 0.3 | 0 | 0 | 0.361 | 0.352 | 0.30 | 1.7 |
| ET2 | 0.275 | 0.025 | 8.3 | 0.344 | 0.396 | 0.31 | 1.9 |
| ET3 | 0.25 | 0.05 | 17 | 0.394 | 0.428 | 0.32 | 2.5 |
| ET4 | 0.225 | 0.075 | 25 | 0.346 | 0.470 | 0.38 | 2.8 |
| ET5 | 0.187 | 0.113 | 38 | 0.257 | 0.499 | 0.43 | 2.5 |
| ET6 | 0.15 | 0.15 | 50 | 0.155 | 0.507 | 0.40 | 1.5 |
| ET7 | 0.075 | 0.225 | 75 | 0.102 | 0.529 | 0.57 | 1.4 |
| ET8 | 0 | 0.3 | 100 | 0.079 | 0.597 | 0.62 | 1.4 |
 | ||
| Fig. 1 Short-circuit current (circle) and open-circuit voltage (triangle) values for different TBA+ ratio in the electrolyte, corresponding to those shown in Table 1. | ||
It is understood that the decrease in Isc and the increase in Voc from 25 to 100% TBA+ (ET4 to ET8) were caused by the decrease in the concentration of Li+ at the TiO2/electrolyte interface. The decrease in the concentration of Li+ at the interface increased the conduction band edge of TiO2, causing a decrease in the injection yield. Besides, the transient absorption spectra (see in the ESI†) indicated that the peak region of the dye bleach showed a blue shift in a TBAI electrolyte compared to that in a LiI electrolyte. It is supposed that the drop in Isc from 25 to 100% TBA+ was also affected by the decrease in the absorption at 635 nm due to the blue shift of the dye absorption. The increase in Voc from 0 to 25% TBA+ was explained by the suppression of the electron–electrolyte recombination. It is supposed that this suppression was caused by the blocking effect of TBA+ on the penetration of I3− (or I2) into the dye/TiO2 interface,8,11 and Voc was increased as increase in the concentration of TBA+. The value of FF was also increased as increase in the concentration of TBA+, and the possible reason for the improvement of FF is the decrease in current loss due to the recombination process. Therefore, the maximum conversion efficiency was obtained when both the effects; the suppression of the electron–electrolyte recombination by TBA+ and the decrease in the conduction band edge by Li+; were compromised.
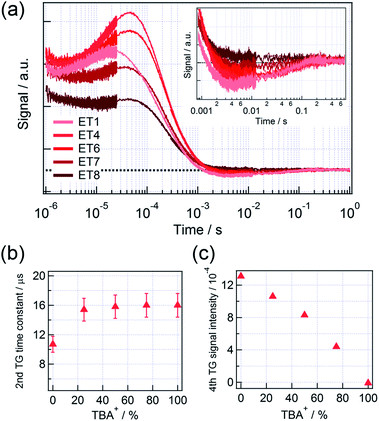
Fig. 2(a) shows the HD-TG responses for 5 electrolytes with different mixing ratio of TBA+ to Li+. Four components were appeared in the HD-TG responses in the time region of 1 μs to 1 s as was previously reported.9,11 The second component is a rising component in the time region of 10−6 to 10−5 s. This component is due to the rearrangement of the charged species on the liquid side in an electric double layer, which was induced by the electron trap on the TiO2 surface after the injection of electrons from the photoexcited dyes to TiO2. In the HD-TG response, ionic motion at the interface was detected via the refractive index change caused by the change in the molecular polarizability at the interface. The fourth component is a negative signal, which went back to the original baseline, observed in the time region of 10−3 to 10−1 s, and it corresponds to the electron–electrolyte recombination and the following escape of I− from the electric double layer. The first and third components were assigned as the disproportionation reaction of I2− (<10−6 s) and the thermal diffusion response (10−5 to 10−3 s) respectively. Hereinafter, the HD-TG signal intensity for the fourth component was defined as the signal intensity difference between the negative peak and the original baseline.
 | ||
| Fig. 2 (a) The HD-TG responses for a DSSC for different mixed ratios of TBA+ and Li+ cations in electrolytes. The mixed ratios can be referred to Table 1. The inset in (a) enlarges the HD-TG responses in the time range of 10−3 to 0.7 s. (b) The time constant of the second HD-TG component and (c) the signal intensity of the fourth HD-TG component in (a) as a function of the mixed ratio of TBA+. The time constants were analyzed by a hybrid analysis that combines the maximum entropy method with nonlinear least squares fitting, using MemExp software. | ||
The time constant of the second component gradually increased from 10 to 16 μs until 25% of TBA+ (ET4) (for details until 25% of TBA+, see Fig. S2 in the ESI†), and then remained constant for further addition of TBA+ (Fig. 2(b)). The result indicates that the rearrangement of the charged species became slower as increasing TBA+ ratio until 25%. As mentioned above, it was suggested that the electron–electrolyte recombination was also gradually suppressed for the TBA+ ratio till 25%, due to the blocking effect of TBA+. Besides, TBA+ has less adsorptivity than Li+.8,14 Considering these properties of TBA+, we propose that the slower ionic motion by addition of TBA+ was due to the decrease in the Coulomb interaction between the electron charge at TiO2 and the ions close to the interface. It is understood that a relatively thick double layer was formed by addition of TBA+ (2–3 nm from the TiO2 surface8), which increased the average distance of ions from the TiO2 surface. For 25% TBA+ or larger, the result suggests that Coulomb interaction did not change as increase in the TBA+ concentration, which means that the blocking effect was saturated after 25% of TBA+.
The signal intensity of the fourth component was gradually decreased as the increase in the TBA+ concentration, and no response was observed when all cations in the electrolyte were TBA+ (Fig. 2(c)). Considering the discussion on the I–V characteristics, it is supposed that the change in the fourth component until 25% of TBA+ was due to the suppression of the electron–electrolyte recombination by the blocking effect, and the change from 25 to 100% TBA+ was due to the decrease in the number of trapped electrons, caused by the decrease in the initially injected electrons.
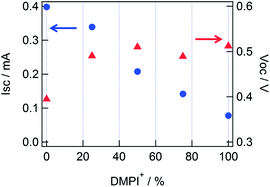
Next, the effect of DMPI+ addition to an electrolyte was studied, and the performances of DSSCs are shown in Table 2. As discussed in the mixed cations with TBA+ and Li+, it is understood that the increase in Voc until 25% of DMPI+ was mainly caused by the suppression of the electron–electrolyte recombination, and that the decrease in Isc appeared from 25 to 100% DMPI+ (ED2 to ED5) were caused by the decrease in the concentration of Li+ at the TiO2/electrolyte interface, while Voc remained constant about ∼0.51 V (Fig. 3). In addition, it is supposed that the drop of Isc value from 25 to 100% DMPI+ was also affected by the decrease in the absorbance at 635 nm due to the blue shift of the dye absorption (see Fig. S1 in ESI†). The decrease in the injected electrons caused to decrease Voc under the probe light illumination,15–17 while Voc was increase by addition of DMPI+, and as a result, both the effects were balanced to keep the Voc constant from 25 to 100% of DMPI+.
| LiI (M) | DMPII (M) | DMPI+b (%) | Isc (mA) | Voc (V) | FF | η (%) | |
|---|---|---|---|---|---|---|---|
| a The electrolytes were an acetonitrile solution including 30 mM I2.b The ratio of the amount of DMPI+ to the total amount of cations in the electrolyte. | |||||||
| ED1 | 0.3 | 0 | 0 | 0.398 | 0.395 | 0.34 | 2.4 |
| ED2 | 0.225 | 0.075 | 25 | 0.339 | 0.490 | 0.45 | 3.4 |
| ED3 | 0.15 | 0.15 | 50 | 0.208 | 0.510 | 0.53 | 2.6 |
| ED4 | 0.075 | 0.225 | 75 | 0.142 | 0.489 | 0.61 | 1.9 |
| ED5 | 0 | 0.3 | 100 | 0.078 | 0.512 | 0.61 | 1.1 |
 | ||
| Fig. 3 Short-circuit current (circle) and open-circuit voltage (triangle) values for different DMPI+ concentrations, corresponding to Table 2. | ||
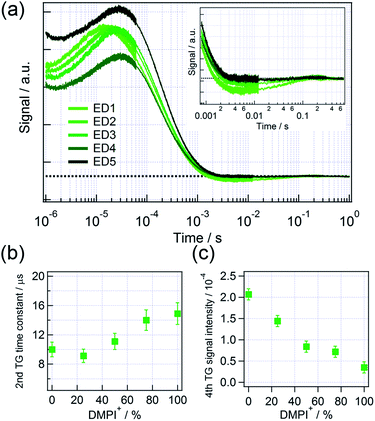
Fig. 4(a) shows the HD-TG responses for different ratios of DMPI+ with Li+. The time constant of the second component gradually increased as the increase in the DMPI+ concentration, which means the rearrangement of charged species became slower as increase in DMPI+. In the case of DMPI+, it is supposed that Li+ at the interface was gradually replaced by DMPI+ unlike the case of TBA+, because the time constant gradually increased till 100% of DMPI+. Thus, the double layer is assumed to be thick gradually. As mentioned for TBA+, it is understood that the slower ionic motion by addition of DMPI+ was caused by the decrease in the Coulomb interaction between the charge at TiO2 and the ions close to the interface.
 | ||
| Fig. 4 (a) The HD-TG responses for DSSCs for different mixed ratios of DMPI+ and Li+. The mixed ratios can be referred to Table 2. The inset in (a) enlarges the HD-TG responses in the time range of 10−3 to 0.7 s. (b) Time constant of the second HD-TG component and (c) the signal intensity of the fourth HD-TG component in (a) as a function of the mixed ratio of DMPI+. The time constant was analyzed by a hybrid analysis that combines the maximum entropy method with nonlinear least squares fitting, using MemExp software. | ||
The signal intensity of the fourth component was gradually decreased as increase in the DMPI+ concentration, while the slope of the signal intensity for the DMPI+ ratio > 25% was smaller. The result suggests that the change in the fourth component until 25% of DMPI+ was due to the suppression of the electron–electrolyte recombination by the blocking effect, and the change from 25 to 100% DMPI+ was due to the decrease in the number of the trapped electrons, caused by the decrease in the injected electrons, and the result is consistent with the I–V characteristics.
Conclusions
The performances for DSSCs using electrolytes with mixed cations species of Li+ with TBA+ or DMPI+ were evaluated, and the relevant carrier dynamics was investigated by using the HD-TG method. The mixed ratios of Li+ with other cations were optimized, and the performance of the DSSCs showed the highest conversion efficiency for 75% Li+ with 25% other cations. From the carrier dynamics for the mixed cations, it was indicated that the difference in the absorptivity of cations on the TiO2 surface changed the thickness of electric double layer; the electron–electrolyte recombination and the conduction band edge of TiO2 depended on the ratio of the cation species, TBA+ or DMPI+. It is important to balance the positive effect of the suppression in the recombination and the negative effect of the increase in the conduction band edge of the TiO2 surface, and mixing several cations is one of the easily-controllable methods to achieve high conversion efficiency of DSSCs.Notes and references
- A. Hagfeldt, G. Boschloo, L. C. Sun, L. Kloo and H. Pettersson, Chem. Rev., 2010, 110, 6595–6663 CrossRef CAS PubMed.
- K. Hara, T. Nishikawa, M. Kurashige, H. Kawauchi, T. Kashima, K. Sayama, K. Alka and H. Arakawa, Sol. Energy Mater. Sol. Cells, 2005, 85, 21–30 CAS.
- T. Kanzaki, S. Nakade, Y. Wada and S. Yanagida, Photochem. Photobiol. Sci., 2006, 5, 389–394 CAS.
- H. S. Lee, S. H. Bae, Y. Jo, K. J. Kim, Y. Jun and C. H. Han, Electrochim. Acta, 2010, 55, 7159–7165 CrossRef CAS PubMed.
- H. Ozawa, Y. Okuyama and H. Arakawa, RSC Adv., 2013, 3, 9175–9177 RSC.
- C. A. Kelly, F. Farzad, D. W. Thompson, J. M. Stipkala and G. J. Meyer, Langmuir, 1999, 15, 7047–7054 CrossRef CAS.
- H. X. Wang and L. M. Peter, J. Phys. Chem. C, 2012, 116, 10468–10475 CAS.
- S. Nakade, T. Kanzaki, W. Kubo, T. Kitamura, Y. Wada and S. Yanagida, J. Phys. Chem. B, 2005, 109, 3480–3487 CrossRef CAS PubMed.
- S. Kuwahara, H. Hata, S. Taya, N. Maeda, Q. Shen, T. Toyoda and K. Katayama, Phys. Chem. Chem. Phys., 2013, 15, 5975–5981 RSC.
- N. Maeda, H. Hata, N. Osada, Q. Shen, T. Toyoda, S. Kuwahara and K. Katayama, Phys. Chem. Chem. Phys., 2013, 15, 11006–11013 RSC.
- S. Kuwahara, S. Taya, N. Osada, Q. Shen, T. Toyoda and K. Katayama, Phys. Chem. Chem. Phys., 2014, 16, 5242 RSC.
- R. Katoh, M. Kasuya, S. Kodate, A. Furube, N. Fuke and N. Koide, J. Phys. Chem. C, 2009, 113, 20738–20744 CAS.
- K. Katayama, M. Yamaguchi and T. Sawada, Appl. Phys. Lett., 2003, 82, 2775–2777 CrossRef CAS PubMed.
- A. Zaban, S. Ferrere and B. A. Gregg, J. Phys. Chem. B, 1998, 102, 452–460 CrossRef CAS.
- N. Kopidakis, N. R. Neale and A. J. Frank, J. Phys. Chem. B, 2006, 110, 12485–12489 CrossRef CAS PubMed.
- J. Halme, P. Vahermaa, K. Miettunen and P. Lund, Adv. Mater., 2010, 22, E210–E234 CrossRef CAS PubMed.
- J. Bisquert, A. Zaban, M. Greenshtein and I. Mora-Sero, J. Am. Chem. Soc., 2004, 126, 13550–13559 CrossRef CAS PubMed.
Footnote |
| † Electronic supplementary information (ESI) available: Transient absorption spectra measured for a DSSC, and the dependence of HD-TG responses on the mixed cation ratio for low concentrations of TBA+ (0–25%). See DOI: 10.1039/c4ra02309a |
| This journal is © The Royal Society of Chemistry 2014 |
