Fluorescein-based ionic liquid sensor for label-free detection of serum albumins†
Waduge Indika S.
Galpothdeniya
,
Susmita
Das
,
Sergio L.
De Rooy
,
Bishnu P.
Regmi
,
Suzana
Hamdan
and
Isiah M.
Warner
*
Department of Chemistry, Louisiana State University, Baton Rouge, LA 70803, USA. E-mail: iwarner@lsu.edu; Fax: +1-225-578-3458; Tel: +1-225-578-2829
First published on 2nd April 2014
Abstract
Herein, we report a fluorescein-based room temperature ionic liquid (RTIL) as a fluorescent probe for highly selective and sensitive detection of albumins. This RTIL was prepared by pairing dianionic fluorescein (FL) with trihexyl(tetradecyl)phosphonium (P66614) cation. The ionic liquid was then dispersed in aqueous medium to produce nanodroplet dispersions. Examination of fluorescence and UV-vis spectroscopic data suggests that these dispersions are comprised of strongly fluorescent monomeric species and weakly fluorescent J-type aggregates. The relative abundance of these two types of species is observed to be dependent on the type and concentration of proteins. In the presence of bovine serum albumin (BSA) or human serum albumin (HSA), monomeric species are found to be predominant, and hence an increase in fluorescence intensity was observed with increasing concentrations of BSA or HSA. Excellent correlation between fluorescence intensity and HSA concentration was observed, and concentrations as low as 300 ng per mL of HSA were detectable. Overall, these [P66614]2[FL] nanodroplets appear to be very promising materials for facile, inexpensive, rapid, and label-free detection of albumins in aqueous medium with a high degree of accuracy, sensitivity, and selectivity.
1. Introduction
Accurate detection of albumins such as human serum albumin (HSA) is critical to understanding numerous biological processes within the human body. HSA, a 66.5 kDa protein, is the most abundant protein in blood plasma, and is typically present at a concentration of approximately 0.6 mM (40 mg mL−1).1 HSA is an important multifunctional protein since it aids in maintaining the oncotic pressure; binds and transports a range of metabolites and xenobiotics; acts as an antioxidant; and exhibits catalytic activities toward a range of organic compounds.1–4 A low level of HSA in blood plasma, also known as hypoalbuminemia, is indicative of medical conditions such as cirrhosis of the liver.5,6 A small amount of HSA is normally found in urine; however, a persistent urinary excretion of HSA in the range of 30–299 mg per 24 h is referred to as microalbuminuria, while albumin excretion above this range is known as macroalbuminuria.7,8 Abnormal levels of albumin in urine indicate a chronic kidney disease which is common in patients with diabetes and hypertension.7,8 Monitoring albumin levels in serum and urine has therefore been advocated in high-risk patients for early detection of possible medical complications.A wide range of analytical methods are currently available for detection and quantification of proteins. Among them, immunoassays are commonly employed for analyses of protein mixtures because they provide an outstanding sensitivity and selectivity due to strong specific interactions between an antibody and an antigen. However, preparation of immunoassays is labor-intensive and time-consuming; and requires expensive reagents and instrumentation. We note that there has been a recent upsurge of interest in the development of fluorescence-based label-free approaches for protein analysis because of the inherent merits of ease of sensor fabrication along with high sensitivity and selectivity. Fluorescence-based methods are particularly noted for their low background noise and wide dynamic range.9,10 When a fluorescent probe interacts with a target protein, a change in fluorescence intensity and/or a shift in the fluorescence emission spectra may be observed; and monitoring these changes can be very useful for detection of various proteins. Fluorescence-based methods have been widely explored for detection of albumins, and the fluorescent probes employed in such studies are primarily organic dye molecules as well as modified gold nanoparticles.5,11–18 Despite considerable success in detection of albumins by use of fluorescence-based methods, many fluorescence probes are limited in application due to the need for complex synthetic procedures employing complex chemical reactions which often involve low product yields. In addition, these probes exhibit only partial selectivity towards albumins. Development of alternate fluorescence probes for albumins is therefore highly desirable.
Recently, Chen and coworkers19,20 have introduced the concept of using ionic liquids (ILs) as potential fluorescence probes for protein detection. ILs are classically defined as organic salts with melting points below 100 °C.21 ILs have also been demonstrated as useful sensing materials for detection of vapors and estimating values of pH.22–25 These materials are easy to synthesize, and their physicochemical properties can be easily tuned simply by altering the counter cation or anion. ILs are typically nonvolatile and can often be easily dispersed in water to form nanomaterials.26,27 Hence, these materials hold considerable promise for use in biosensing applications.
Despite the significant potential of ILs for developing biosensors, uses of ILs as fluorescence probes for detection of albumins or other biomolecules are still in infancy. In the study reported in this manuscript, we outline a method for the selective and sensitive detection of albumins using aqueous dispersions of nanodroplets from a highly fluorescent ionic liquid prepared by pairing a fluorescein (FL) anion and trihexyl(tetradecyl)phosphonium (P66614) cation. Examination of data from fluorescence and UV-vis spectroscopic studies of these dispersed [FL]2[P66614] nanodroplets revealed that these molecules coexist as a mixture of strongly fluorescent monomers and weakly fluorescent molecular aggregates. Nanodroplets dispersions were prepared in the presence of eight different proteins, and the spectroscopic behavior was studied. Interestingly, it was observed that the monomeric species tended to dominate in the presence of HSA or bovine serum albumin (BSA), while the aggregate forms dominated in the blank or presence of other proteins. As a result, there is a strong enhancement of fluorescence intensity in the presence of HSA or BSA. Circular dichroism (CD) spectra of the serum albumins in the presence of IL showed considerable changes in secondary structures, thereby inferring strong interactions between these proteins and ILs. The intensity of the monomer fluorescence was found to increase linearly as a function of HSA or BSA concentrations, thereby allowing detection and quantification of these proteins. Therefore, the simple method outlined here should allow for rapid, sensitive, selective, and label-free detection of serum albumins in aqueous medium.
2. Materials and methods
2.1. Materials
Fluorescein disodium salt (Na2FL), trihexyl(tetradecyl)phosphonium chloride ([P66614][Cl]) (≥95%), tetraphenylphosphonium chloride ([TPP][Cl]), (4-nitrobenzyl)triphenylphosphonium chloride ([4NB][Cl]), ethanol (spectroscopic grade), human serum (heat inactivated), and all proteins were purchased from Sigma-Aldrich, and used as received. Triply deionized water (18.2 MΩ cm) from an Elga model PURELAB ultra water-filtration system was used for preparation of the sodium phosphate buffer (pH 7.4/10 mM).2.2. Synthesis and characterization of ILs
ILs were synthesized using an ion exchange procedure reported elsewhere.27–30 Briefly, Na2FL and [P66614][Cl] at a molar ratio of 1.1![[thin space (1/6-em)]](https://www.rsc.org/images/entities/char_2009.gif) :
:![[thin space (1/6-em)]](https://www.rsc.org/images/entities/char_2009.gif) 2 were dissolved in a mixture of methylene chloride and water (5
2 were dissolved in a mixture of methylene chloride and water (5![[thin space (1/6-em)]](https://www.rsc.org/images/entities/char_2009.gif) :
:![[thin space (1/6-em)]](https://www.rsc.org/images/entities/char_2009.gif) 1 v/v). This mixture was stirred for 48 h. The methylene chloride layer was washed with excess water several times in order to remove NaCl byproduct. The product [P66614]2[FL] was dried by removing the solvent in vacuo. The product was obtained as a red viscous liquid (yield 88%). Finally, the IL was characterized by use of nuclear magnetic resonance (NMR) spectroscopy, Fourier transform infrared spectroscopy (FTIR), and electron spray ionization-mass spectrometry (ESI-MS).
1 v/v). This mixture was stirred for 48 h. The methylene chloride layer was washed with excess water several times in order to remove NaCl byproduct. The product [P66614]2[FL] was dried by removing the solvent in vacuo. The product was obtained as a red viscous liquid (yield 88%). Finally, the IL was characterized by use of nuclear magnetic resonance (NMR) spectroscopy, Fourier transform infrared spectroscopy (FTIR), and electron spray ionization-mass spectrometry (ESI-MS).
2.3. Preparation of protein solutions
All protein samples were prepared in 10 mM sodium phosphate buffer (pH = 7.4). A stock solution of 2 mg mL−1 protein was initially prepared, and then diluted to obtain concentrations ranging from 2 to 50 μg mL−1.2.4. Preparation of IL nanodroplets
IL nanodroplets were prepared using a modified reprecipitation method similar to that used for preparation of organic nanoparticles.31 Briefly, 200 μL of 0.6 mM ethanolic IL solution were rapidly introduced into 5.0 mL of 10 mM sodium phosphate buffer solution (pH = 7.4) containing proteins and ultrasonicated for 5 min. After 10 minutes of equilibration time, the dispersions were characterized using various techniques as described below.2.5. Characterization of dispersions by use of dynamic light scattering (DLS)
The average size and size distribution of nanodroplets were determined by use of DLS. DLS data were obtained using a Nano ZS dynamic light scatterer (Malvern Instruments, Malvern, UK). This instrument provides mean hydrodynamic diameter and polydispersity index (PDI) of the nanodroplet population with a PDI range from 0 (monodisperse) to 0.5 (broad distribution). Two different [P66614]2[FL] (24 μM) samples including a sample without proteins (blank), and the other sample with 20 μg mL−1 HSA were tested.2.6. Absorption and fluorescence studies
Absorbance measurements were acquired using a Shimadzu UV-3101PC spectrophotometer. Fluorescence studies were performed on a Spex Fluorolog-3 spectrofluorimeter (model FL3-22TAU3; Jobin Yvon, Edison, NJ). A 0.4 cm path length quartz cuvette (Starna Cells) was used to collect the fluorescence and absorbance spectra. Absorption spectra were collected against an identical cell filled with sodium phosphate buffer (pH 7.4/10 mM) as the blank. Fluorescence studies were all performed by adapting a synchronous scan protocol with right angle geometry.32,332.7. CD studies
In order to examine structural changes that occur in proteins due to interactions with our IL sensor, chiroptical analysis was performed using a J-815 CD spectrometer. All protein samples were prepared by using the sodium phosphate buffer solutions mentioned above. A 1 mm path length quartz cuvette (Precision Cells Inc.) was used to reduce interferences from buffer when collecting the CD spectra.3. Results and discussion
3.1. Preparation and characterization of FL-based nanomaterials
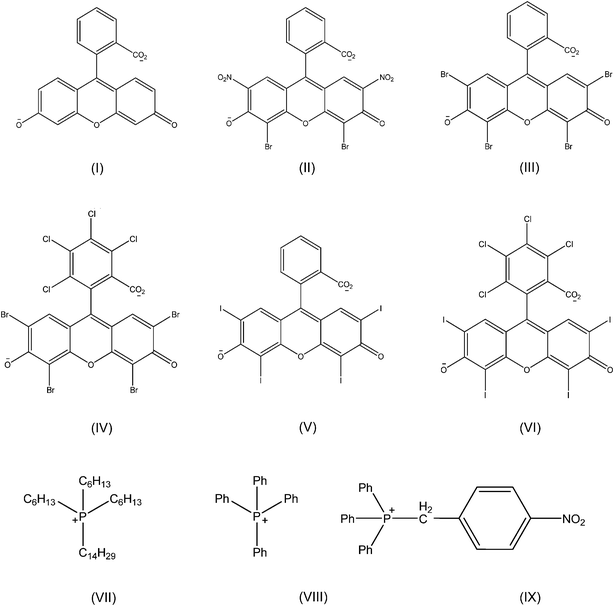
Fluorescein (FL) and its derivatives are derived from a class of fluorophores known as xanthenes. Xanthene-based dyes often exhibit high chemical and photochemical stability. In addition, they are ideally suited for various sensing applications as a result of high optical sensitivity (high extinction coefficient and fluorescence quantum yield).34,35 In this study, [P66614] cation, which has often been labeled a ‘universal liquifier’ for production of ILs,23,28 was paired with the FL dianion resulting in a room temperature ionic liquid (RTIL) i.e. [P66614]2[FL]. Hence, this IL displays relatively strong fluorescence as compared to previously reported ILs as protein probes. Authors in a recent study have described the synthesis and spectroscopic behavior of a FL-based RTIL.36 Recent studies from our laboratory have demonstrated that [P66614]2[FL] nanodroplets can be used as a colorimetric pH sensor.27The work outlined in this manuscript is an example of detection of proteins by use of [P66614]2[FL] nanodroplets prepared by employing a simple reprecipitation method.31,32 DLS studies revealed that these nanodroplets have a mean hydrodynamic diameter of 134.4 ± 1.4 nm, and a PDI of 0.29 ± 0.01 at the IL concentration of 24 μM, while the mean hydrodynamic diameter and PDI values obtained for the same concentration of IL in the presence of 20 μg mL−1 HSA are 150.9 ± 3.3 and 0.22 ± 0.01 respectively. In the presence of HSA, the mean hydrodynamic diameter and PDI of the nanodroplets show only slight deviations as compared to the blank sample. These slight changes in the size and dispersion of nanodroplets may be attributed to changes in the environment due to the presence of HSA since all other parameters were held constant during experimentation. In addition to [P66614]2[FL], two other FL-based salts, i.e. [TPP]2[FL], and [4NB]2[FL], were synthesized and characterized using the procedure described above. Both compounds were solids at room temperature, and are highly soluble in ethanol, but insoluble in water. Similarly, five other ILs were synthesized by pairing eosin B (EoB), eosin Y (EoY), phloxine B (Phl), erythrosin B (ER) or rose bengal (RoB) dianions with [P66614] cation, and all products were liquid at room temperature. The chemical structures of all cations and dye anions are given in Scheme 1.
3.2. Absorption and fluorescence of FL-based nanodroplets
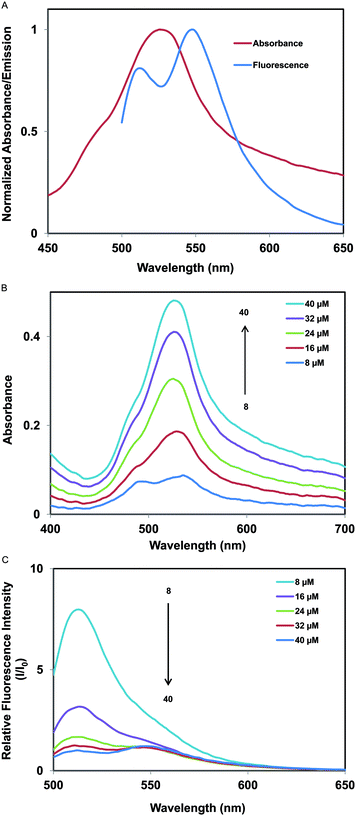
The absorption and fluorescence spectra of 40 μM [P66614]2[FL] nanodroplets dispersed in a phosphate buffer (pH 7.4/10 mM) are shown in Fig. 1a. From this figure, it is evident that the absorption spectrum shows an absorption maximum at ∼530 nm with a blue-shifted absorption shoulder at ∼490 nm. Similarly, the fluorescence spectrum exhibits two peaks, one at ∼545 nm and the other at ∼512 nm. In order to gain better insight into the spectral properties of [P66614]2[FL] nanodroplets, absorption and fluorescence spectra at five different IL concentrations i.e. 8, 16, 24, 32, and 40 μM, were measured (Fig. 1b and c). Absorption spectra (Fig. 1b) depict a decrease in absorbance with decreasing concentrations of [P66614]2[FL]. In addition, the ratio of absorbance at 490 and 530 nm is found to increase with decreased concentrations of IL.The dye assemblies responsible for production of the 530 nm peak and 490 nm shoulder were identified through examination of previous studies on dye assemblies in solution.37 Dye aggregations are often characterized by broadening of the absorption spectra38 or the appearance of either hypsochromically shifted (H-aggregates) or bathochromically shifted (J-aggregates) bands as compared to the monomer absorption band.32,39 Therefore, the component absorbing at ∼490 nm may be attributed to the monomeric form, while the bathochromically-shifted component absorbing at ∼530 nm is possibly due to J-type aggregation, in which the dye transition dipoles are arranged in a staircase manner. As previously noted, a decrease in IL concentration results in a decrease in the ratio of aggregate to monomer absorption peaks. The ratios are given in Table S1† for various concentrations of ILs.
The fluorescence emission spectra of the nanodroplets at various concentrations ranging from 8 to 40 μM are shown in Fig. 1c. It is evident from these spectra that there is a remarkable increase in fluorescence intensity, accompanied by a gradual peak shift from ∼545 nm to ∼512 nm with decreasing concentrations of [P66614]2[FL]. The fluorescence peak at approximately 512 nm is attributable to monomeric species, and the peak at 545 nm is ascribed to J-type aggregations. Surprisingly, in contrast to absorbance, the fluorescence intensity increases with a decrease in IL concentration.
It is important to note that at higher IL concentrations, J-type aggregates are more pronounced than monomers as evidenced by the higher aggregate to monomer peak ratio (Aag(530)/Am(490)) in absorbance. However, the fluorescence intensity of the aggregate peak is not very high as compared to the monomer peak. At lower IL concentrations where the Aag(530)/Am(490) ratio is small, the fluorescence intensity for the monomeric peak increases. Thus, as gleaned from the absorption and fluorescence spectra, the monomer form is more fluorescent than the J-type aggregates. However, we note that for classical examples of dye assemblies, J aggregates usually display an intense fluorescence emission, whereas H aggregates are usually characterized by diminished fluorescence with a typically large Stokes shift.39,40 The decrease in observed fluorescence intensity of the J aggregates in this work may be attributed to the self-quenching of fluorescence by the dye molecules within the nanodroplets.41
3.3. Fluorescence sensing of proteins using FL-based nanodroplets
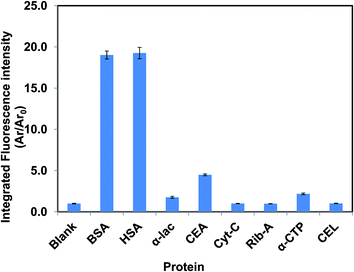
In this manuscript, detection of proteins employing FL-based nanodroplets was studied using eight different proteins, i.e. (1) human serum albumin (HSA), (2) bovine serum albumin (BSA), (3) α-lactalbumin from bovine milk (α-lac), (4) albumin from chicken egg white (CEA), (5) ribonuclease A from bovine pancreas (Rib-A), (6) α-chymotrypsin from bovine pancreas (α-CTP), (7) cytochrome C from bovine heart (Cyt-C), and (8) lysozyme from chicken egg white (CEL). Fig. 2 is a comparison of the integrated fluorescence intensity of [P66614]2[FL] nanodroplets in the presence of each protein at the same molar concentration (fluorescence emission spectra which corresponds to these integrated fluorescence intensities are given in Fig. S1†). The concentrations of [P66614]2[FL] and proteins were fixed at 40 and 1.5 μM, respectively. Fluorescence spectra were recorded using 490 nm excitation. Interestingly, BSA and HSA produced more than 19-fold enhancement in the integrated fluorescence emission signal, whereas CEA produced 4.5-fold enhancement. In contrast, the remaining proteins produced essentially no change in fluorescence intensity. Therefore, examination of the acquired data suggests that these nanodroplets are highly selective for detection of albumins. Since HSA is not found together with BSA and CEA in actual samples, it is reasonable to conclude that this method is very promising for selective detection of HSA in real samples. Several reports exist in the literature on fluorescence sensing of proteins. In most of these studies, the fluorescence signal is shown to be quenched due to interactions between the protein and IL.19 However, in our case, the fluorescence signal is enhanced upon addition of proteins. From an analytical viewpoint, this observation should be more useful for sensor applications.In an attempt to understand the sensing properties of related compounds, similar ILs were synthesized by using cations and anions with slightly different structures. The starting material Na2[FL], and two other ion pairs, [4NB]2[FL] and [TPP]2[FL], showed essentially no difference in fluorescence signal when combined with all proteins at the tested concentration of 1.5 μM (Fig. S2a–c†). Similarly, the role of the anion towards the fluorescence sensing of albumins was investigated by use of five previously mentioned ILs containing other xanthene dye dianions instead of FL. Although these molecules are structurally similar to FL, the spectroscopic behaviors of these nanodroplets were found to be very different from [P66614]2[FL] nanodroplets (data not shown). Specifically, no substantial change in fluorescence signal was observed upon treating these nanodroplets with BSA or HSA over the tested protein concentration range of 10–50 μg mL−1 (Fig. S3a–e†). We note that these ILs were not tested for other proteins since our focus is on a sensor for HSA. Our studies demonstrate that there are unique interactions between albumins and [P66614]2[FL] ion pairs, which may allow development of highly selective sensors for albumins.
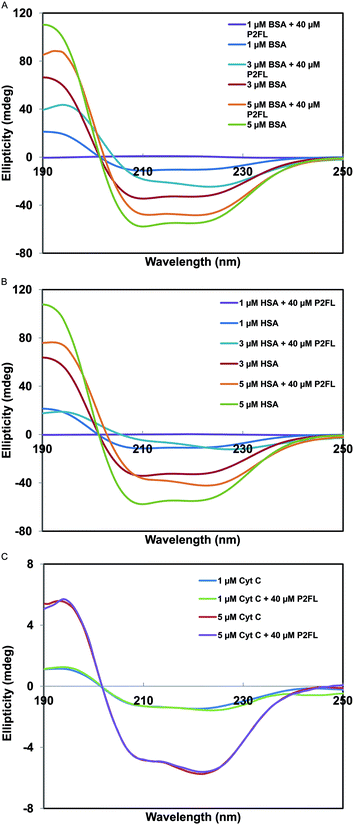
To further elucidate interactions between proteins and [P66614]2[FL], we utilized circular dichroism (CD) spectroscopy. The CD spectra of BSA, HSA and Cyt-C in the absence and presence of IL are shown in Fig. 3 (data not shown for other proteins). These CD studies revealed notable changes in the secondary structure of albumins (Fig. 3a and b) in the presence of [P66614]2[FL] nanodroplets indicating strong interactions between albumins and [P66614]2[FL]. It is further noted that the observed change in secondary structure of BSA and HSA is increased when the concentration ratio of [P66614]2[FL] to albumin is increased from 8![[thin space (1/6-em)]](https://www.rsc.org/images/entities/char_2009.gif) :
:![[thin space (1/6-em)]](https://www.rsc.org/images/entities/char_2009.gif) 1 to 40
1 to 40![[thin space (1/6-em)]](https://www.rsc.org/images/entities/char_2009.gif) :
:![[thin space (1/6-em)]](https://www.rsc.org/images/entities/char_2009.gif) 1. For non-albumins (e.g. Cyt-C), the CD spectra (Fig. 3c) show little or no changes at various concentration ratios of [P66614]2[FL] and Cyt-C, suggesting an unaltered secondary structure for Cyt-C. This may be attributed to negligible interactions between Cyt-C and [P66614]2[FL]. Thus, it can be inferred from these CD measurements that albumins interact strongly with our sensor, while other proteins show negligible interactions. This key property of [P66614]2[FL] makes it a promising material for sensing of albumins.
1. For non-albumins (e.g. Cyt-C), the CD spectra (Fig. 3c) show little or no changes at various concentration ratios of [P66614]2[FL] and Cyt-C, suggesting an unaltered secondary structure for Cyt-C. This may be attributed to negligible interactions between Cyt-C and [P66614]2[FL]. Thus, it can be inferred from these CD measurements that albumins interact strongly with our sensor, while other proteins show negligible interactions. This key property of [P66614]2[FL] makes it a promising material for sensing of albumins.
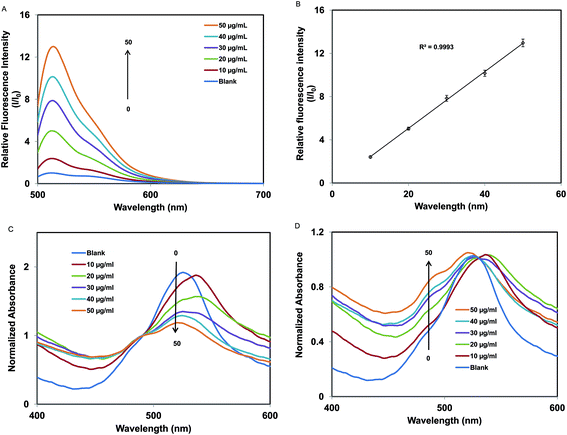
Fig. 4a is an illustration of the measured fluorescence spectra of [P66614]2[FL] nanodroplets dispersed in various concentrations of BSA. Examination of Fig. 4b shows that the fluorescence intensity varies linearly as a function of BSA concentration over the concentration range of 10 to 50 μg mL−1. As previously noted, peak at 512 nm is attributable to monomeric species, and the peak at 545 nm is ascribed to J-type aggregations. The intensity of the peak at ∼512 nm, increases with respect to the J-aggregate peak with increasing BSA concentrations. This increase in the intensity of the monomer peak indicates formation of monomeric form through deaggregation of J-type aggregates in the presence of BSA molecules. In other words, the presence of BSA minimizes the aggregation of IL molecules. Further studies to understand the interactions at the molecular level are in progress. In order to gain better insight, absorbance studies were also performed for the same samples along with fluorescence studies. Upon normalization of the absorption spectra in the region of the monomer peak, it is observed that the absorbance for the aggregate peak decreases with increasing concentrations of BSA (Fig. 4c). Similarly, upon normalization of the absorption spectra at the aggregate peak, it is observed that the monomer peak increases with increasing concentrations of BSA (Fig. 4d). It was also observed that the aggregate to monomer peak ratio (Aag(530)/Am(490)) decreases with increasing BSA concentration (Table 1). These findings are consistent with our assumption that BSA converts weakly fluorescent dye aggregates into strongly fluorescent monomeric forms upon interaction with our IL sensor. Therefore, an increase in fluorescence signal at ∼512 nm is observed with increasing concentrations of BSA. Similar arguments apply to HSA since HSA and BSA are structurally homologous proteins which perform similar functions.
| BSA concentration (μg mL−1) | A ag(530)/Am(490) ratio |
|---|---|
| 10 | 1.87 |
| 20 | 1.81 |
| 30 | 1.52 |
| 40 | 1.33 |
| 50 | 1.13 |
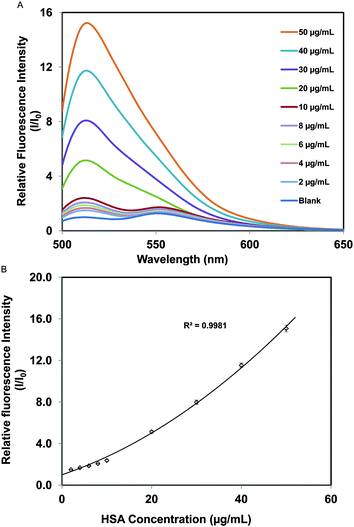
The fluorescence emission spectra of the nanodroplets in the presence of various concentrations of HSA, ranging from 2 μg mL−1 to 50 μg mL−1, were measured (Fig. 5a). A plot of relative fluorescence intensity versus the concentration of HSA is found to be a second-degree polynomial with r2 of 0.998 (Fig. 5b). Hence, the concentration of HSA in an unknown sample can be estimated from these data. The detection limit for HSA was estimated by use of the equation 3σ/msl, where σ the standard deviation of three replicate blank samples, and msl is the slope of the calibration curve obtained in the region of low HSA concentration. On this basis, the detection limit for HSA was estimated to be ∼300 ng mL−1 (4.5 nM). Finally, to further demonstrate the sensor performance in real samples, fluorescence emission of spiked HSA in a diluted serum was measured. In general, detection of serum albumins from real samples such as blood serum is inherently challenging mainly due to extreme complexity of the sample matrix. Also, the fluorescence emission may have interference from fluorescence emission of other biological molecules in the sample. However, the concentration of HSA is very high in blood serum (40 mg mL−1),1 and our method can be used to detect HSA concentrations which are much lower than that. Therefore, human serum samples were diluted 1000 times before spiking with HSA. A plot of relative fluorescence intensity versus the concentration of HSA (10–50 μg mL−1) in serum is given in Fig. S4.† Examination of data in Fig. S4† suggests that there is good correlation between relative fluorescence intensity and HSA concentration in the human serum. However, there is a notable difference between the calibration plots of HSA in buffer and serum. This can be attributed to the interferences present in serum. One way to get around these interferences is to design a sensor array with sensors that respond in a manner similar to [P66614]2[FL]. Currently, we are investigating other possible IL candidates which can be used with [P66614]2[FL].
One of the key requirements for a successful sensor is the stability of the signal. The stability of the dispersions of [P66614]2[FL] nanodroplets were studied by monitoring the fluorescence emission spectra of a blank sample at different times. The fluorescence spectra did not change appreciably (<1%) during the test period of 120 minutes (Fig. S5†). This illustrates that the observed dispersions are very stable, i.e. at least over the time period of these measurements. In addition, a relatively high zeta potential (i.e. +36.5 mV) indicates very good stability of these dispersion.27
4. Conclusions
In this work, the application of a fluorescent ionic liquid sensor, i.e. [P66614]2[FL], for highly selective and sensitive detection of albumins has been demonstrated. Aqueous dispersions of [P66614]2[FL] nanodroplets display strongly fluorescent J-type aggregates and weakly fluorescent monomeric forms. Examination of data from CD spectroscopic studies revealed remarkable changes in albumin structures in the presence of [P66614]2[FL], indicating strong interactions between IL molecules and albumins. Both absorbance and fluorescence data support the conclusion that BSA and HSA convert the aggregate forms of our sensor into monomeric forms, which leads to a proportional increase in fluorescence signal in the presence of albumins. Furthermore, this conversion is dependent on the amount of proteins present in aqueous solution. As a result, this allows label-free detection of albumins aqueous samples. Based on our data, the estimated LOD value for HSA is 300 ng mL−1. Thus, [P66614]2[FL] should be an excellent fluorescent probe for selective measurement of HSA in aqueous samples.Acknowledgements
This material is based upon work supported in part by the National Science Foundation under Grant number CHE-1243916. WIG also acknowledges Dr. Ted Gauthier and William Nichols for their support.References
- U. Kragh-Hansen, Biochim. Biophys. Acta, 2013, 1830, 5535–5544 CrossRef CAS PubMed.
- U. Kragh-Hansen, V. T. G. Chuang and M. Otagiri, Biol. Pharm. Bull., 2002, 25, 695–704 CAS.
- J. Cordova, J. D. Ryan, B. B. Boonyaratanakornkit and D. S. Clark, Enzyme Microb. Technol., 2008, 42, 278–283 CrossRef CAS PubMed.
- Y. Iwao, Y. Ishima, J. Yamada, T. Noguchi, U. Kragh-Hansen, K. Mera, D. Honda, A. Suenaga, T. Maruyama and M. Otagiri, IUBMB Life, 2012, 64, 450–454 CrossRef CAS PubMed.
- C. Y.-S. Chung and V. W.-W. Yam, J. Am. Chem. Soc., 2011, 133, 18775–18784 CrossRef CAS PubMed.
- M. Bernardi, C. Maggioli and G. Zaccherini, Critical Care, 2012, 16 Search PubMed.
- H. Kramer and M. E. Molitch, Diabetes Care, 2005, 28, 1813–1816 CrossRef.
- A. S. Levey and J. Coresh, Lancet, 2012, 379, 165–180 CrossRef.
- W. P. Ambrose, P. M. Goodwin, J. H. Jett, A. Van Orden, J. H. Werner and R. A. Keller, Chem. Rev., 1999, 99, 2929–2956 CrossRef CAS PubMed.
- W. F. Patton, BioTechniques, 2000, 28, 944–948 CAS.
- Y. Sun, S. Wei, Y. Zhao, X. Hu and J. Fan, J. Lumin., 2012, 132, 879–886 CrossRef CAS PubMed.
- K. D. Volkova, V. B. Kovalska, M. Y. Losytskyy, L. V. Reis, P. F. Santos, P. Almeida, D. E. Lynch and S. M. Yarmoluk, Dyes Pigm., 2011, 90, 41–47 CrossRef CAS PubMed.
- C. Kar, B. Ojha and G. Das, Luminescence, 2013, 28, 339–344 CrossRef CAS PubMed.
- H. Lu, B. Xu, Y. Dong, F. Chen, Y. Li, Z. Li, J. He, H. Li and W. Tian, Langmuir, 2010, 26, 6838–6844 CrossRef CAS PubMed.
- H. Tong, Y. Hong, Y. Dong, M. Häussler, Z. Li, J. W. Y. Lam, Y. Dong, H. H. Y. Sung, I. D. Williams and B. Z. Tang, J. Phys. Chem. B, 2007, 111, 11817–11823 CrossRef CAS PubMed.
- H. Tong, Y. Hong, Y. Dong, J. Hau, W. Y. Lam, Z. Li, Z. Guo, Z. Guo and B. Z. Tang, Chem. Commun., 2006, 3705–3707, 10.1039/b608425g.
- S. Comby and T. Gunnlaugsson, ACS Nano, 2011, 5, 7184–7197 CrossRef CAS PubMed.
- S. H. D. P. Lacerda, J. J. Park, C. Meuse, D. Pristinski, M. L. Becker, A. Karim and J. F. Douglas, ACS Nano, 2009, 4, 365–379 CrossRef PubMed.
- Y. Shu, M. Liu, S. Chen, X. Chen and J. Wang, J. Phys. Chem. B, 2011, 115, 12306–12314 CrossRef CAS PubMed.
- X. W. Chen, J. W. Liu and J. H. Wang, J. Phys. Chem. B, 2011, 115, 1524–1530 CrossRef CAS PubMed.
- J. P. Hallett and T. Welton, Chem. Rev., 2011, 111, 3508–3576 CrossRef CAS PubMed.
- W. I. S. Galpothdeniya, K. S. McCarter, S. L. De Rooy, B. P. Regmi, S. Das, F. Hasan, A. Tagge and I. M. Warner, RSC Adv., 2014, 4, 7225–7234 RSC.
- K. Y. Yung, A. J. Schadock-Hewitt, N. P. Hunter, F. V. Bright and G. A. Baker, Chem. Commun., 2011, 47, 4775–4777 RSC.
- L. Yu, D. Garcia, R. Ren and X. Zeng, Chem. Commun., 2005, 2277–2279 RSC.
- Q. Zhang, S. Zhang, S. Liu, X. Ma, L. Lu and Y. Deng, Analyst, 2011, 136, 1302–1304 RSC.
- D. K. Bwambok, B. El-Zahab, S. K. Challa, M. Li, L. Chandler, G. A. Baker and I. M. Warner, ACS Nano, 2009, 3, 3854–3860 CrossRef CAS PubMed.
- S. Das, P. K. S. Magut, S. L. de Rooy, F. Hasan and I. M. Warner, RSC Adv., 2013, 3, 21054–21061 RSC.
- R. E. Del Sesto, T. M. McCleskey, A. K. Burrell, G. A. Baker, J. D. Thompson, B. L. Scott, J. S. Wilkes and P. Williams, Chem. Commun., 2008, 447–449 RSC.
- D. K. Bwambok, H. M. Marwani, V. E. Fernand, S. O. Fakayode, M. Lowry, I. Negulescu, R. M. Strongin and I. M. Warner, Chirality, 2008, 20, 151–158 CrossRef CAS PubMed.
- M. J. Earle, C. M. Gordon, N. V. Plechkova, K. R. Seddon and T. Welton, Anal. Chem., 2007, 79, 758–764 CrossRef CAS PubMed.
- H. K. Kasai, H. Okada, S. Oikawa, H. Mastuda and H. Nakanishi, Jpn. J. Appl. Phys., 1996, 35, L221–L223 CrossRef CAS.
- S. Das, D. Bwambok, B. El-Zahab, J. Monk, S. L. de Rooy, S. Challa, M. Li, F. R. Hung, G. A. Baker and I. M. Warner, Langmuir, 2010, 26, 12867–12876 CrossRef CAS PubMed.
- S. Das, S. L. de Rooy, A. N. Jordan, L. Chandler, I. I. Negulescu, B. El-Zahab and I. M. Warner, Langmuir, 2012, 28, 757–765 CrossRef CAS PubMed.
- H. Ishida, S. Tobita, Y. Hasegawa, R. Katoh and K. Nozaki, Coord. Chem. Rev., 2010, 254, 2449–2458 CrossRef CAS PubMed.
- E. Wang, L. Zhu, L. Ma and H. Patel, Anal. Chim. Acta, 1997, 357, 85–90 CrossRef CAS.
- W. M. Sanderson and R. D. Johnson, Mater. Chem. Phys., 2012, 132, 239–243 CrossRef CAS PubMed.
- H. Kasai, H. Kamatani, S. Okada, H. Oikawa, H. Matsuda and H. Nakanishi, Jpn. J. Appl. Phys., 1996, 35, L221–L223 CrossRef CAS.
- L. Daehne, J. Am. Chem. Soc., 1995, 117, 12855–12860 CrossRef CAS.
- E. E. Jelley, Nature, 1936, 138, 1009–1010 CrossRef CAS.
- M. R. Kasha and H. R. Ashraf El-Bayoumi, Pure Appl. Chem., 1965, 11, 371–392 CrossRef CAS.
- J. Y. Zheng, C. Zhang, Y. S. Zhao and J. Yao, Phys. Chem. Chem. Phys., 2010, 12, 12935–12938 RSC.
Footnote |
| † Electronic supplementary information (ESI) available. See DOI: 10.1039/c4ra01461h |
| This journal is © The Royal Society of Chemistry 2014 |

