Sreenu Bhanoth,
Priyesh V. More,
Aditi Jadhav and
Pawan K. Khanna*
Nanochemistry/Nanomateirals Lab., Dept of Applied Chemistry, Defence Institute of Advanced Technology (DIAT), Govt. of India, Pune-411 025, India. E-mail: pawankhanna2002@yahoo.co.in
First published on 31st March 2014
For the first time ever cyclohexeno-1,2,3-selenadiazole (SDZ) has been employed for the synthesis of core–shell ZnSe–CdSe quantum dots thus promoting an eco-friendly and reasonably less toxic synthesis method for such quantum dot hetero-structures. The synthesized dark-red colored core–shell structures were characterized by UV-Visible and photoluminescence (PL) spectroscopy to examine their band-gap. The absorption and emission spectra also showed gradual red-shifts in wavelength with respect to zinc selenide (core). Also, the band-gap of such core–shell quantum dots can be tuned by varying the shell layer thickness and/or particle size. The findings from the XRD analysis, near-to-homogenous particle size distribution, formation of a decent nano-crystalline product and a good agreement with Vegard's law, signify that the present synthesis approach could be highly effective for the precise tailoring of core–shell QDs.
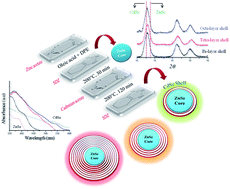
Colloidal core–shell QDs contains at least two semiconductor materials one as the core and other coated on it as a shell, so that the possibility of tuning of their fluorescence wavelength, quantum yield and lifetime can be maintained. In dye sensitized solar cell, dye multi layer reduces performance of the device and the same effect is true for QDSSC.3 However, core–shell nanocrystals can effectively overcome such problems because it is expected that the shell will create the physical barrier between the cores and surrounding medium, thus making quantum dot surface less sensitive to environmental changes and photo-oxidation. In core shell system the primary purpose of the shell is to create efficient passivation of quantum dot surface to avoid trap states. Recently widely used light harvesting semiconductor quantum dots (QDs) such as CdSe,4–6 PbS,7,8 CdS,9–11 CdTe,12 InP,13 and Bi2S314 have been reported for quantum dot sensitized solar cells (QDSSCs). Similarly core–shell QDs e.g. CdSe–CdS, CdS–CdSe15,16 CdSe–ZnSe17 CdS–ZnSe18 CdTe–CdSe19 CdTe–CdS20 and CdSe–ZnS21,22 have found application in QDSSC.
The key step in solar power generation in different types of conventional quantum dot photovoltaic devices such as metal junction solar cells, quantum dot sensitized solar cells (QDSSCs), and polymer hybrid solar cells, is charge separation of the electron and hole.23 The concept of core–shell quantum dots has been proposed in place of normal QDs for the improvement of both electron and hole carrier transport phenomena. Besides, various possibilities of II–VI compound (ZnSe–CdSe, CdS–CdSe, CdTe–CdSe and CdSe–ZnSe) core–shell QDs semiconductors are considered for such application. In order to fabricate any of these combinations, we need to understand the individual (core–shell) synthesis and characterization of the material.
The most important property of core–shell semiconducting nanocrystals (CSSNCs) is their core, which emits in visible and near-infrared region of the electromagnetic spectrum due to the quantum confinement effect. Additionally, the ‘shell’ presence created a passivation around the core thus imparting value to the optical properties. Due to variation in optical properties, core–shell QDs are important for biomedical applications such as in vitro cell labeling,24,25 in vivo deep cell imaging26,27 and optical device applications e.g. LEDs,28 lasers,29 phosphors.30 The typical energy level (band-gaps) of ZnSe core having CdSe shell is depicted in Scheme 1. The over-coating of shell of a wide band gap material with narrower band gap materials would open a new route to produce nanocrystals with tunable band gap; the obtained high quality ZnSe–CdSe core–shell semiconductor nanocrystals can have practical application in replacing CdSe QDs as desired emitters. Meanwhile, several groups have attempted synthesis of II–VI and III–V binary semiconductors such as ZnSe–CdSe, ZnO–ZnSe, ZnO–ZnTe, CdSe–CdTe, GaN–GaP and GaN–GaAs31,32 with core–shell heterostructures. The methods reported by several researchers are often utilize toxic reagents e.g. phopshines and amines. Mostly these syntheses have been performed by use of trioctylphosphine selenide (TOPSe) as a source of selenium in combination with high boiling solvent. Peter et al.17 described highly luminescent CdSe–ZnSe core–shell nanocrystals by use of CdO, zinc stearate, trioctylphosphine oxide/hexadecylamine and selenium powder at 250 °C temperature. Similarly, Verma et al.18 reported charge separation by indirect band gap transition in CdS–ZnSe type-II core–shell quantum dots synthesized by use of cadmium oxide, zinc oxide, oleic acid capping agent, Se powder and octadecene as solvent at 250 °C but without addressing the issue of time and energy.
In all above reports, synthesis is carried out by using different Se-pecursors which are highly sensitive, non-eco-friendly, as well as time and energy consuming. Also, there are no reports where 1,2,3-selenadiazoles (SDZ) have been employed as a source of selenium for core–shell selenide QDs synthesis despite early reports by the authors of their utility in II–VI semiconductor nanoparticles and quantum dots.33,34 The advantage of currently employed organic selenium compound as a source of selenium can be expected from the fact that it releases free selenium when thermolyzed in high boiling solvent (>150 °C) at the same time it avoids use of famous non eco-friendly coordinating reagents such as TOP, TOPO and alkyl amines. In order to make the quantum dots synthesis greener, expected selenium source must be less toxic as well as be able to lower the reaction temperature and time during the preparation. In order to realize this expectation, we herein propose the first use of cyclohexeno-1,2,3-selenadiazoles for synthesis of core–shell ZnSe–CdSe quantum dots. Thus this paper describes the synthesis of ZnSe–CdSe and its characterization. Synthesis of core–shell QDs was produced in two steps by using organo-metallic selenadiazole as selenium, cadmium acetate–cadmium oxide as cadmium and zinc acetate as zinc sources respectively and oleic acid as capping agent. Characterization was carried out by using optical absorption spectroscopy, photoluminescence spectroscopy, XRD and TEM.
Absorption wavelength of pure ZnSe and CdSe QDs synthesized from the same selenium source (SDZ) showed a band at 350 nm and 540 nm and their emission spectra revealed peaks at 395 nm and 570 nm (Fig. 1B(ii) & (iv)). During the preliminary synthesis performed to study the temporal evolution of the core–shell combination, formation of core–shell quantum dots and variation of thickness was monitored by UV-Visible spectroscopy (Fig. 1B). The experiments were conducted with keeping the ZnSe:
CdSe ratios at 1
:
0.06 and 1
:
0.1. Another experiment was carried with addition of Cd-source alone to generate Cd-layer on ZnSe core. The ratio of ZnSe
:
Cd in this case was kept 1
:
0.1. These preliminary experiments provided the evidence for the size enhancement of CdSe around ZnSe core. The as-prepared core (ZnSe QDs) with the varied CdSe shell thickness showed both the absorption onset and the PL emission peak systematically shifted to the higher wavelength (red-shift). Thus, such considerable red-shift in absorption and emission values indicated the formation of ZnSe–CdSe core–shell structure (Fig. 1C). The observed narrow absorption range for ZnSe (core) and red-shift could be due to the band-gap energy of CdSe which lies in the visible region and the combination therefore may be considered more favorable for enhancing the efficiency in light harvesting and quantum dots sensitized solar cell.15 We purposefully introduced Cd ions by slight addition of cadmium acetate alone which leads to formation of multiple defect states on the surface of ZnSe core. The ZnSe core served as a matrix to Cd ions which gradually reside on the surface of the ZnSe core. These defects were evident from the emission spectrum of the sample when excited at ex. 350 nm (Fig. 1C(ii)). The fact that Cd atoms were residing at surface of ZnSe core creating surface defects prompted us that the growth of CdSe shell around ZnSe core was feasible. The effect of increasing the CdSe shell layer around ZnSe also showed similar trend in the PL spectra and it appeared from that the PL for ratios of 1
:
0.06 (ZnSe
:
CdSe) only predominantly show PL due to ZnSe core but as the shell thickness increases in the ratio 1
:
0.1, the origin of PL peak is equally dominated by the CdSe shell. Thus, such results hinted towards suppression of PL originated from core with increasing the shell thickness. Such observation correlated well with the fact that ZnSe band-gap is higher than CdSe.
Our efforts to reproduce the experiments to further observe the effect of increased CdSe shell thickness on PL properties resulted in similar results (Fig. 2). For this purpose, the experiments were conducted with maintaining the ZnSe:
CdSe ratios at 1
:
0.5, 1
:
1 and 1
:
1.5. Thus, overall explanation can be deduced that an excitation at ex. 350 nm results in emission peaks due to both ZnSe core and CdSe shell. The emission from the core was broad between 400–450 nm due to several defect states however it does not change in the emission energy with variation in the shell layer. These results essentially indicated that the ZnSe core was homogeneous in nature and had similar and uniform particle size distribution. However, the observed changes to the PL emission for the core ZnSe with variation in the CdSe shell layer ratio resulted in tunable red shifts when excited at ex. 350 nm (broad peak at 450 nm & 555 nm for ratio of 1
:
0.5 and multiple peaks in the region of 400–475 nm & a peak at 575 nm for ratio of 1
:
1.5) as seen in Fig. 2(ii). The variation in ZnSe–CdSe ratio should surely lead to difference in shell layer thickness. It was obvious that thinner the shell, higher would be the influence of ZnSe core on the emission wavelength. Similarly, as the shell layer thickness was increased, the influence of CdSe shell increases on the PL properties, inducing the red-shift in the emission wavelength. Such observation was also valid for excitation wavelength of ex. 400 nm and ex. 450 nm (Fig. 2(iii) & (iv)).
The core ZnSe exhibited quantum yield of about 40%. However, the quantum yield of the ZnSe–CdSe core shell quantum dots surprisingly decreased as compared to the core ZnSe quantum dots. The quantum yield of samples with ratio 1:
0.5, 1
:
1 and 1
:
1.5 (ZnSe
:
CdSe) was in the order of 4.6%, 5.7% and 8% respectively. The decrease in quantum yield could be due to the quick burst of growth of CdSe shell around the ZnSe core following the addition of Cd and Se precursors. These observations signaled that the rapid shell growth phase resulted in surface defects and surface disorder, which can be removed by surface relaxation and/or reconstruction during the annealing phase under near-zero growth rates during synthesis.36
The Bragg's reflections for cubic zinc blend ZnSe had characteristic features at 27.5, 45.6 and 54.3 corresponding to the (111), (220) and (311) planes respectively (Joint Committee on Powder Diffraction Standards, JCPDS, Card no. 80-0021). Similarly, the Bragg's reflections for cubic zinc blend CdSe had characteristic features at 25.3, 42.0 and 42.0 corresponding to the (111), (220) and (311) planes respectively (JCPDS, Card no. 19-0191).37,38 The ZnSe–CdSe core shell QDs were expected to show some shifts in the peak patterns, preferably in between the reported peaks for cubic ZnSe and cubic CdSe. This assumption was well justified in the XRD spectra of the ZnSe–CdSe core shell QDs. The XRD measurements (Fig. 3) from the powdered samples of ZnSe–CdSe core–shell QDs showed zinc blend cubic crystal structure. The peak position was shifted towards cubic CdSe as the shell thickness was increased. The 2θ values for the sample with the ratio 1:
0.5 (ZnSe
:
CdSe) were observed at 25.9, 42.8 and 50.5 for (111), (220) and (311) planes respectively. These peaks shifted to the 2θ values of 25.6, 42.4 and 50.3 for the sample with the ratio 1
:
1 for (111), (220) and (311) planes respectively. The shift continued towards zinc blend cubic CdSe for the sample with the ratio of 1
:
1.5, as the 2θ values were observed at 25.4, 42.1 and 50.1 for (111), (220) and (311) planes respectively. Such shifts in the XRD peaks further emphasized the influence of CdSe shell on the ZnSe–CdSe core–shell QDs and correlated well with the findings from the optical properties of the as-synthesized ZnSe–CdSe core–shell QDs.39 The 2θ values for (111) peak for all the samples are listed in Table 1.
![]() | ||
Fig. 3 XRD pattern of cubic ZnSe–CdSe quantum dots and proposed schematic representation of bi-, tetra- and octa-layer CdSe shell on ZnSe core with respect to various ZnSe–CdSe ratios. |
S. no. | QDs | λ(abs) (nm) | λ(em) (nm) (λex @ 325/450 nm) | Bandgap (Eg) (eV) | XRD 2θ value for 111 peak | Crystallite size from Scherrer equation | d-Spacing (nm) | Lattice constant (a) (nm) |
---|---|---|---|---|---|---|---|---|
1 | 350 | 395 | 3.54 | 27.5 (ref. 35) | ∼4 nm | 0.3240 | 0.565 | |
2 | ZnSe–CdSe (1![]() ![]() |
480 | 555 | 2.58 | 25.9 | ∼5 nm | 0.3436 | 0.590 |
3 | ZnSe–CdSe (1![]() ![]() |
510 | 560 | 2.21 | 25.6 | ∼6 nm | 0.3476 | 0.602 |
4 | ZnSe–CdSe (1![]() ![]() |
535 | 570 | 2.31 | 25.4 | ∼7.2 nm | 0.3506 | 0.610 |
5 | CdSe | 540 | 575 | 2.30 | 25.3 (ref. 34) | ∼4 nm | 0.3516 | 0.615 |
If we consider the present ZnSe–CdSe core–shell QDs as an alloy and consider ZnSe and CdSe as its individual components, the observed dependence of XRD peak positions on the Zn–Cd ratio could be in accordance with the Vegards law.40
aAB(x) = xaA + (1 − x)aB |
The broadness of the peaks indicates small particle size of the product. The calculated crystallite size from the Scherrer's formula was ∼5 nm, ∼6 nm and 7.2 nm for the samples with the ratio 1:
0.5, 1
:
1 and 1
:
1.5 respectively. The increase in crystallite size also confirmed the growth of CdSe shell thickness in the final product as the ratio of CdSe was increased. If we assume that the covalent atomic radius of Cd (144 pm) and Se (120 pm), the approximate size of one CdSe atom would be ∼500 pm (including the bond length of CdSe = 230 pm).41 Since, the increase in crystallite size for the ZnSe
:
CdSe ratio of 1
:
0.5 was 1 nm as compared to the core ZnSe quantum dot particle. There could be a bi-layer of CdSe shell formed on the ZnSe core, as there was a possibility of only two CdSe atom stacked above each other in the shell thickness of 1 nm.
Thus, we could assume, for every 1 nm increase in the crystallite size of the ZnSe–CdSe core–shell thickness, there could be two layers of CdSe atoms formed in the shell i.e. tetra-layer and octa-layer CdSe shell for product synthesised with a ZnSe:
CdSe ratio of 1
:
1 and 1
:
1.5 respectively. In addition, the low intensity peaks (for crystal planes 400, 422 and 331) was also seen in the XRD pattern. The observation of such peaks beyond 2θ value of 60° often indicates well nano-crystalline nature of the sample (ESI, Fig. S1†). The findings from the XRD analysis and a good agreement with Vegard's law, signifies that the present synthesis approach could be highly effective for the precise tailoring of core–shell QDs.
High-quality of non-agglomerated QDs of ZnSe–CdSe showed spherical particles when analyzed by transmission electron microscopy (TEM). TEM analysis of CdSe alone as shown in Fig. 4A showed slightly aggregated spherical particle of about 4–5 nm with white patches around indicating the presence of organics. However, TEM image of ZnSe–CdSe core–shell QDs (Fig. 4B) with a ratio of 1:
1.5 (ZnSe
:
CdSe) revealed spherical particles with size of more than 5 nm (∼7–8 nm) with neat lattice fringes (Fig. 4C). The crystalline nature of the particles was also confirmed from the single area electron diffraction (SAED) pattern (Fig. 4D) and the d-spacing measured from the lattice fringes for the sample with 1
:
1 ratio correlated well with the XRD findings. The TEM images further confirmed the nano-crystalline behaviour of the as-synthesized core–shell QDs along with the increase in particle size with increase in CdSe shell.
Dynamic scattering technique (DLS) method was utilized to calculate the particle size distribution within a given colloidal solution. In the present case, the core–shell QDs synthesized with the ratio of (1:
1.15) were dissolved in toluene and the analysis by an action of laser scattering of wavelength 632 nm revealed that the tiny core–shell nanostructures were narrowly distributed within 6 nm (ESI, Fig. S2†). The obtained narrow particle distribution could be attributed to excellent size quantization effect in the ZnSe–CdSe core–shell quantum dots. The TEM analysis coupled with DLS also confirmed the homogeneous particles size in the sample.
Progress of reaction was monitored via temporal evolution of bands using high power xenon light source UV-Visible spectrophotometer, Ocean Optics US Florida (Makropack) by scanning the samples between 325–650 nm in toluene solution. The absorption spectra of the as-prepared quantum dots were measured by same technique. Photoluminescence (PL) of various stages of reaction as well as of final products was recorded using Eclipse fluorescence spectrophotometer (Agilent Technologies) at varied excitation wavelength viz.; 350, 400 and 450 nm depending upon the nature of samples. X-ray diffractions patterns were measured by using Cu-Kα (λ = 1.5406 Å) radiation having tube voltage with 40 mA current on Mini Flex Rigaku X-ray diffractrometer. XRD pattern was recorded in the angular range 2° < 2θ < 90°. Thus, cubic crystal phase of quantum dots was established by XRD by size of the quantum dot examined directly by Techni-20 transmission electron microscopy (TEM) and 200 keV acceleration voltage was used for the experiment. Particle size distribution was measured for toluene solution in the range of 0–100 nm using Sympatech (France) particle size analyzer at a laser wavelength of 632 nm.
The PL quantum yield for both ZnSe core and ZnSe–CdSe core–shell quantum dots was obtained by referring to a standard (rhodamine 6G, QY = 95%). The PL quantum yield was calculated using the following equation.42
ϕ = ϕ′ × (I/I′) × (A′/A) × (n/n′)2 |
Footnote |
† Electronic supplementary information (ESI) available: (1) XRD spectra of the various as-synthesized ZnSe–CdSe core–shell QDs and (2) the particle size distribution data of the core–shell QDs synthesized with the ratio of (1![]() ![]() |
This journal is © The Royal Society of Chemistry 2014 |