High performance chemiresistive H2S sensors using Ag-loaded SnO2 yolk–shell nanostructures†
Ji-Wook Yoon‡
a,
Young Jun Hong‡b,
Yun Chan Kang*b and
Jong-Heun Lee*a
aDepartment of Materials Science and Engineering, Korea University, Anam-Dong, Seongbuk-Gu, Seoul 136-713, Republic of Korea. E-mail: jongheun@korea.ac.kr; Fax: +82-2-928-3584; Tel: +82-2-3290-3282
bDepartment of Chemical Engineering, Konkuk University, 1 Hwayang-dong, Gwangjin-gu, Seoul 143-701, Republic of Korea. E-mail: yckang@konkuk.ac.kr; Fax: +82-2-458-3504; Tel: +82-2-2049-6010
First published on 21st March 2014
Abstract
SnO2 yolk–shell spheres uniformly loaded with Ag nanoparticles were prepared by a facile one-pot ultrasonic spray pyrolysis of the source solution and the H2S sensing characteristics were investigated. The Ag-loaded SnO2 yolk–shell spheres showed ultrahigh and reversible response (Ra/Rg − 1 = 613.9, where Ra is the resistance in air and Rg is the resistance in gas) to 5 ppm H2S with negligible cross-responses (0.6–17.3) to eight other interference gases at 350 °C. In contrast, pure SnO2 spheres with dense inner structures and yolk–shell morphologies did not exhibit a high response/selectivity to H2S nor reversible H2S sensing. The highly sensitive, selective, and reversible H2S sensing characteristics were explained in terms of the gas-accessible yolk–shell morphology and uniform loading of catalytic Ag nanoparticles. Namely, the gas-accessible yolk–shell morphology facilitated the rapid and effective diffusion of the analyte/oxygen gases and the uniform loading of Ag nanoparticles promoted the H2S sensing reaction.
Introduction
Hydrogen sulfide (H2S) is a colorless, poisonous, corrosive, and flammable gas that smells like rotten eggs and is present in natural gases, volcanos, sewage, dumping grounds, decayed foods, and is caused by bacterial breakdown of organic matter.1–3 Exposure to high concentrations of H2S may induce immediate fainting and a high probability of death. Continuous exposure to low concentrations of H2S can cause eye irritation, sore throat, nausea, headache, and dizziness. Moreover, the foul smell of H2S creates an unpleasant environment.2–4 Permissible exposure limits of H2S suggested by the US Occupational Safety and Health Administration (OSHA) and US National Institute for Occupational Safety and Health (NIOSH) are 20 ppm (general industry ceiling limit) and 10 ppm (10 minute ceiling limit).4,5 Accordingly, the detection of ubiquitous H2S should be highly sensitive, selective, and reliable in order to monitor harmful pollutants, control the chemical reaction involving sulfur, and manage unpleasant odors.Oxide semiconductor chemiresistors represent attractive platforms to detect trace concentrations of gases because of their high gas response, simple sensing mechanism, cost effectiveness, and facile integration.6–13 The gas sensing characteristics of sensing materials can be improved significantly either by altering the morphological design of the nanostructures or by the addition of catalytic additives. In terms of morphology, oxide yolk–shell nanostructures, hollow spheres with movable cores and multiple shells,14,15 are excellent nano-architectures for gas-sensor applications owing to their high surface area to volume ratio, high gas accessibility, and effective electron depletion.16 The high gas response of hollow or yolk–shell nanostructures as compared to agglomerated counterparts is attributed to the effective diffusion of the gasses over the entire sensing surface through the semi-permeable and thin shells.17–21
To date, p-type CuO has been used as a representative additive to enhance the H2S sensing characteristics of n-type oxide semiconductors such as SnO2,22,23 ZnO,24 WO3,25 and MoO3.26 The selective and sensitive detection of H2S by CuO-loaded n-type oxide semiconductors was attributed to the change of the resistive hetero-junction between p-type CuO and n-type oxide semiconductors into a conductive junction between metallic CuS and n-type oxide semiconductors due to the strong chemical interaction between CuO and H2S.27 The recovery after H2S sensing, however, usually takes a relatively long time or is incomplete probably due to the sluggish kinetics of the oxidation of CuS into CuO![[thin space (1/6-em)]](https://www.rsc.org/images/entities/char_2009.gif) 28 or the irreversible adsorption/desorption of sulfur-containing species.29 This suggests that the development of H2S sensors with a high gas response, superior selectivity, and good reversibility remains a challenge and might be accomplished by combining highly gas accessible nano-architectures and/or new catalysts with strong chemical interactions with H2S.
28 or the irreversible adsorption/desorption of sulfur-containing species.29 This suggests that the development of H2S sensors with a high gas response, superior selectivity, and good reversibility remains a challenge and might be accomplished by combining highly gas accessible nano-architectures and/or new catalysts with strong chemical interactions with H2S.
In previous contributions we have suggested that well-defined, pure, and catalyst-loaded yolk–shell nanostructures could be prepared by the simple, one-pot spray pyrolysis reaction of precursor solutions30,31 and we demonstrated the potential of Pd-loaded SnO2 yolk–shells as gas-sensing materials. Ag has been reported to be a potential additive that can promote H2S sensing properties.32 However, little is known concerning the effect of Ag loading on the H2S sensing characteristics of n-type oxide semiconductors.33,34 Moreover, Ag-loaded SnO2 hollow or yolk–shell nanostructures were never prepared or studied for the detection of H2S until the present report.
Therefore, SnO2 yolk–shell nanostructures uniformly loaded with Ag catalysts were prepared by a facile one-pot spray pyrolysis reaction and the H2S sensing characteristics were investigated for the first time. Highly sensitive, selective, and reversible H2S sensing was achieved using Ag-loaded SnO2 yolk–shell nanostructures. The focus of the study was directed towards understanding the role of the Ag catalysts and the gas accessible yolk–shell nano-architectures in the design of high performance H2S sensors.
Experimental
The Ag-loaded SnO2 yolk–shell spheres were prepared via one-pot spray pyrolysis of an aqueous solution containing Sn(II) oxalate (SnC2O4, 98%, Sigma-Aldrich Co., Ltd., USA), nitric acid, Ag-nitrate (AgNO3, 99%, Sigma-Aldrich Co., Ltd., USA), and sucrose (C12H22O11, Junsei Co., Japan). Sucrose was used as the carbon source to form the yolk–shell spheres. The undoped SnO2 yolk–shell spheres and SnO2 spheres with dense inner structures were also prepared directly from the spray pyrolysis of a Sn precursor solution with and without sucrose. The nitric acid was added to SnC2O4 and stirred for 5 min. Subsequently, distilled water and sucrose was added and stirred for 5 min, which lead to the slightly turbid precursor solution. The concentrations of SnC2O4 and sucrose were 0.2 M and 0.5 M, respectively. The Ag content in the Ag-loaded yolk–shell SnO2 spheres was fixed at 0.1 wt% (0.13 at%). The spray pyrolysis system (see Fig. S1 in the ESI†) was comprised of a droplet generator, quartz reactor, and powder collector. The length and diameter of the quartz reactor were 2000 and 100 mm, respectively. A 1.7 MHz ultrasonic spray generator with 20 vibrators was used to simultaneously generate a large quantity of droplets, which were carried into the high-temperature tubular reactor by air at a flow rate of 10 L min−1. The reactor temperature was fixed at 1000 °C. For simplicity, hereafter, the pure SnO2 spheres with dense inner structures, pure SnO2 yolk–shell spheres, and Ag-loaded SnO2 yolk–shell spheres after the spray pyrolysis reaction will be referred to as ‘D-SnO2’, ‘YS-SnO2’, and ‘Ag-YS-SnO2’ specimens, respectively. Powders after spray pyrolysis reaction were dispersed in distilled water and the slurry was drop-coated on an alumina substrate (size: 1.5 × 1.5 mm2) with two Au electrodes on the top surface and a microheater on the bottom surface. The same thickness and uniformity of sensor film was maintained throughout the experiment. Prior to the measurements, the sensor was heated to 550 °C for 2 h to remove any hydroxyl contaminants and to stabilize the sensor.The gas responses (S = Ra/Rg − 1; Ra: resistance in air, Rg: resistance in the analytic gas) to 5 ppm H2S, ethanol (C2H5OH), formaldehyde (HCHO), trimethylamine (C3H9N), ammonia (NH3), benzene (C6H6), toluene (C7H8), o-xylene (C8H10), hydrogen (H2), and carbon monoxide (CO) were measured at 350–450 °C by switching the gas atmospheres. The crystal structures of the spheres were investigated using X-ray diffractometry (XRD, Rigaku DMAX-33). The morphologies of the spheres were characterized using scanning electron microscopy (SEM, JEOL JSM-6060) and high-resolution transmission electron microscopy (HR-TEM, FEI Tecnai™ 300 K). The specific surface areas and pore size distributions were determined from a Brunauer–Emmett–Teller (BET) analysis of nitrogen adsorption measurements (TriStar 3000, Micromeritics). The chemical state of Ag-loaded SnO2 yolk–shell spheres was analyzed by X-ray photoelectron spectroscopy (XPS, ULVAC-PHI, X-TOOL). The elemental compositions of the powders were investigated using an inductively coupled plasma-optical emission spectrometer (ICP-OES, Thermo elemental, ICAP 6000).
Results and discussion
The Ag-YS-SnO2 spheres were prepared by the spray pyrolysis of the solution containing the Sn-precursor, Ag-precursor, nitric acid, and sucrose at a high temperature. The formation of Ag-YS-SnO2 spheres, which is similar to those of pure and Pd-loaded SnO2 yolk–shell spheres described in previous contributions,31 can be described in the three following steps: (1) the formation of the Ag–C–Sn precursor composite spheres by polymerization and carbonization of sucrose, (2) the development of the Ag-loaded SnO2 outer shells through the partial oxidation of carbon and the decomposition of the precursors near the surface, and (3) the subsequent oxidation/decomposition of the interior portion of the precursors into the Ag-loaded SnO2 inner shells and yolks. The diameters of the Ag-YS-SnO2 spheres ranged from 0.5 to 3 μm (Fig. 1a). The yolks were indirectly observed within the spheres through the semi-translucent shells (arrows in Fig. 1a) and the yolk–shell nanostructure was observed at the broken spheres (inset in Fig. 1a). TEM (Fig. 1b) clearly revealed that all spheres consisted of yolks and shells. From the magnified image (Fig. 1c), it was clear that the yolk–shell nanostructures with double shells and one core consisted of small primary particles and the thicknesses of the outer and inner shells were 40 and 100 nm, respectively. The lattice fringe with interplanar distances of 0.33 nm (Fig. 1d), corresponding to the (110) plane of the SnO2 Cassiterite (rutile) crystal structures, suggested the crystalline nature of the Ag-YS-SnO2 spheres. The uniform distribution of Ag components on the SnO2 yolk–shell spheres, essential for the catalytic promotion of the gas sensing reaction, was confirmed by TEM elemental mapping (Fig. 1e–g), suggesting that the spray pyrolysis of the precursor solution containing sucrose provided a facile one-pot route to prepare yolk–shell oxide nanostructures uniformly loaded with noble metal catalysts.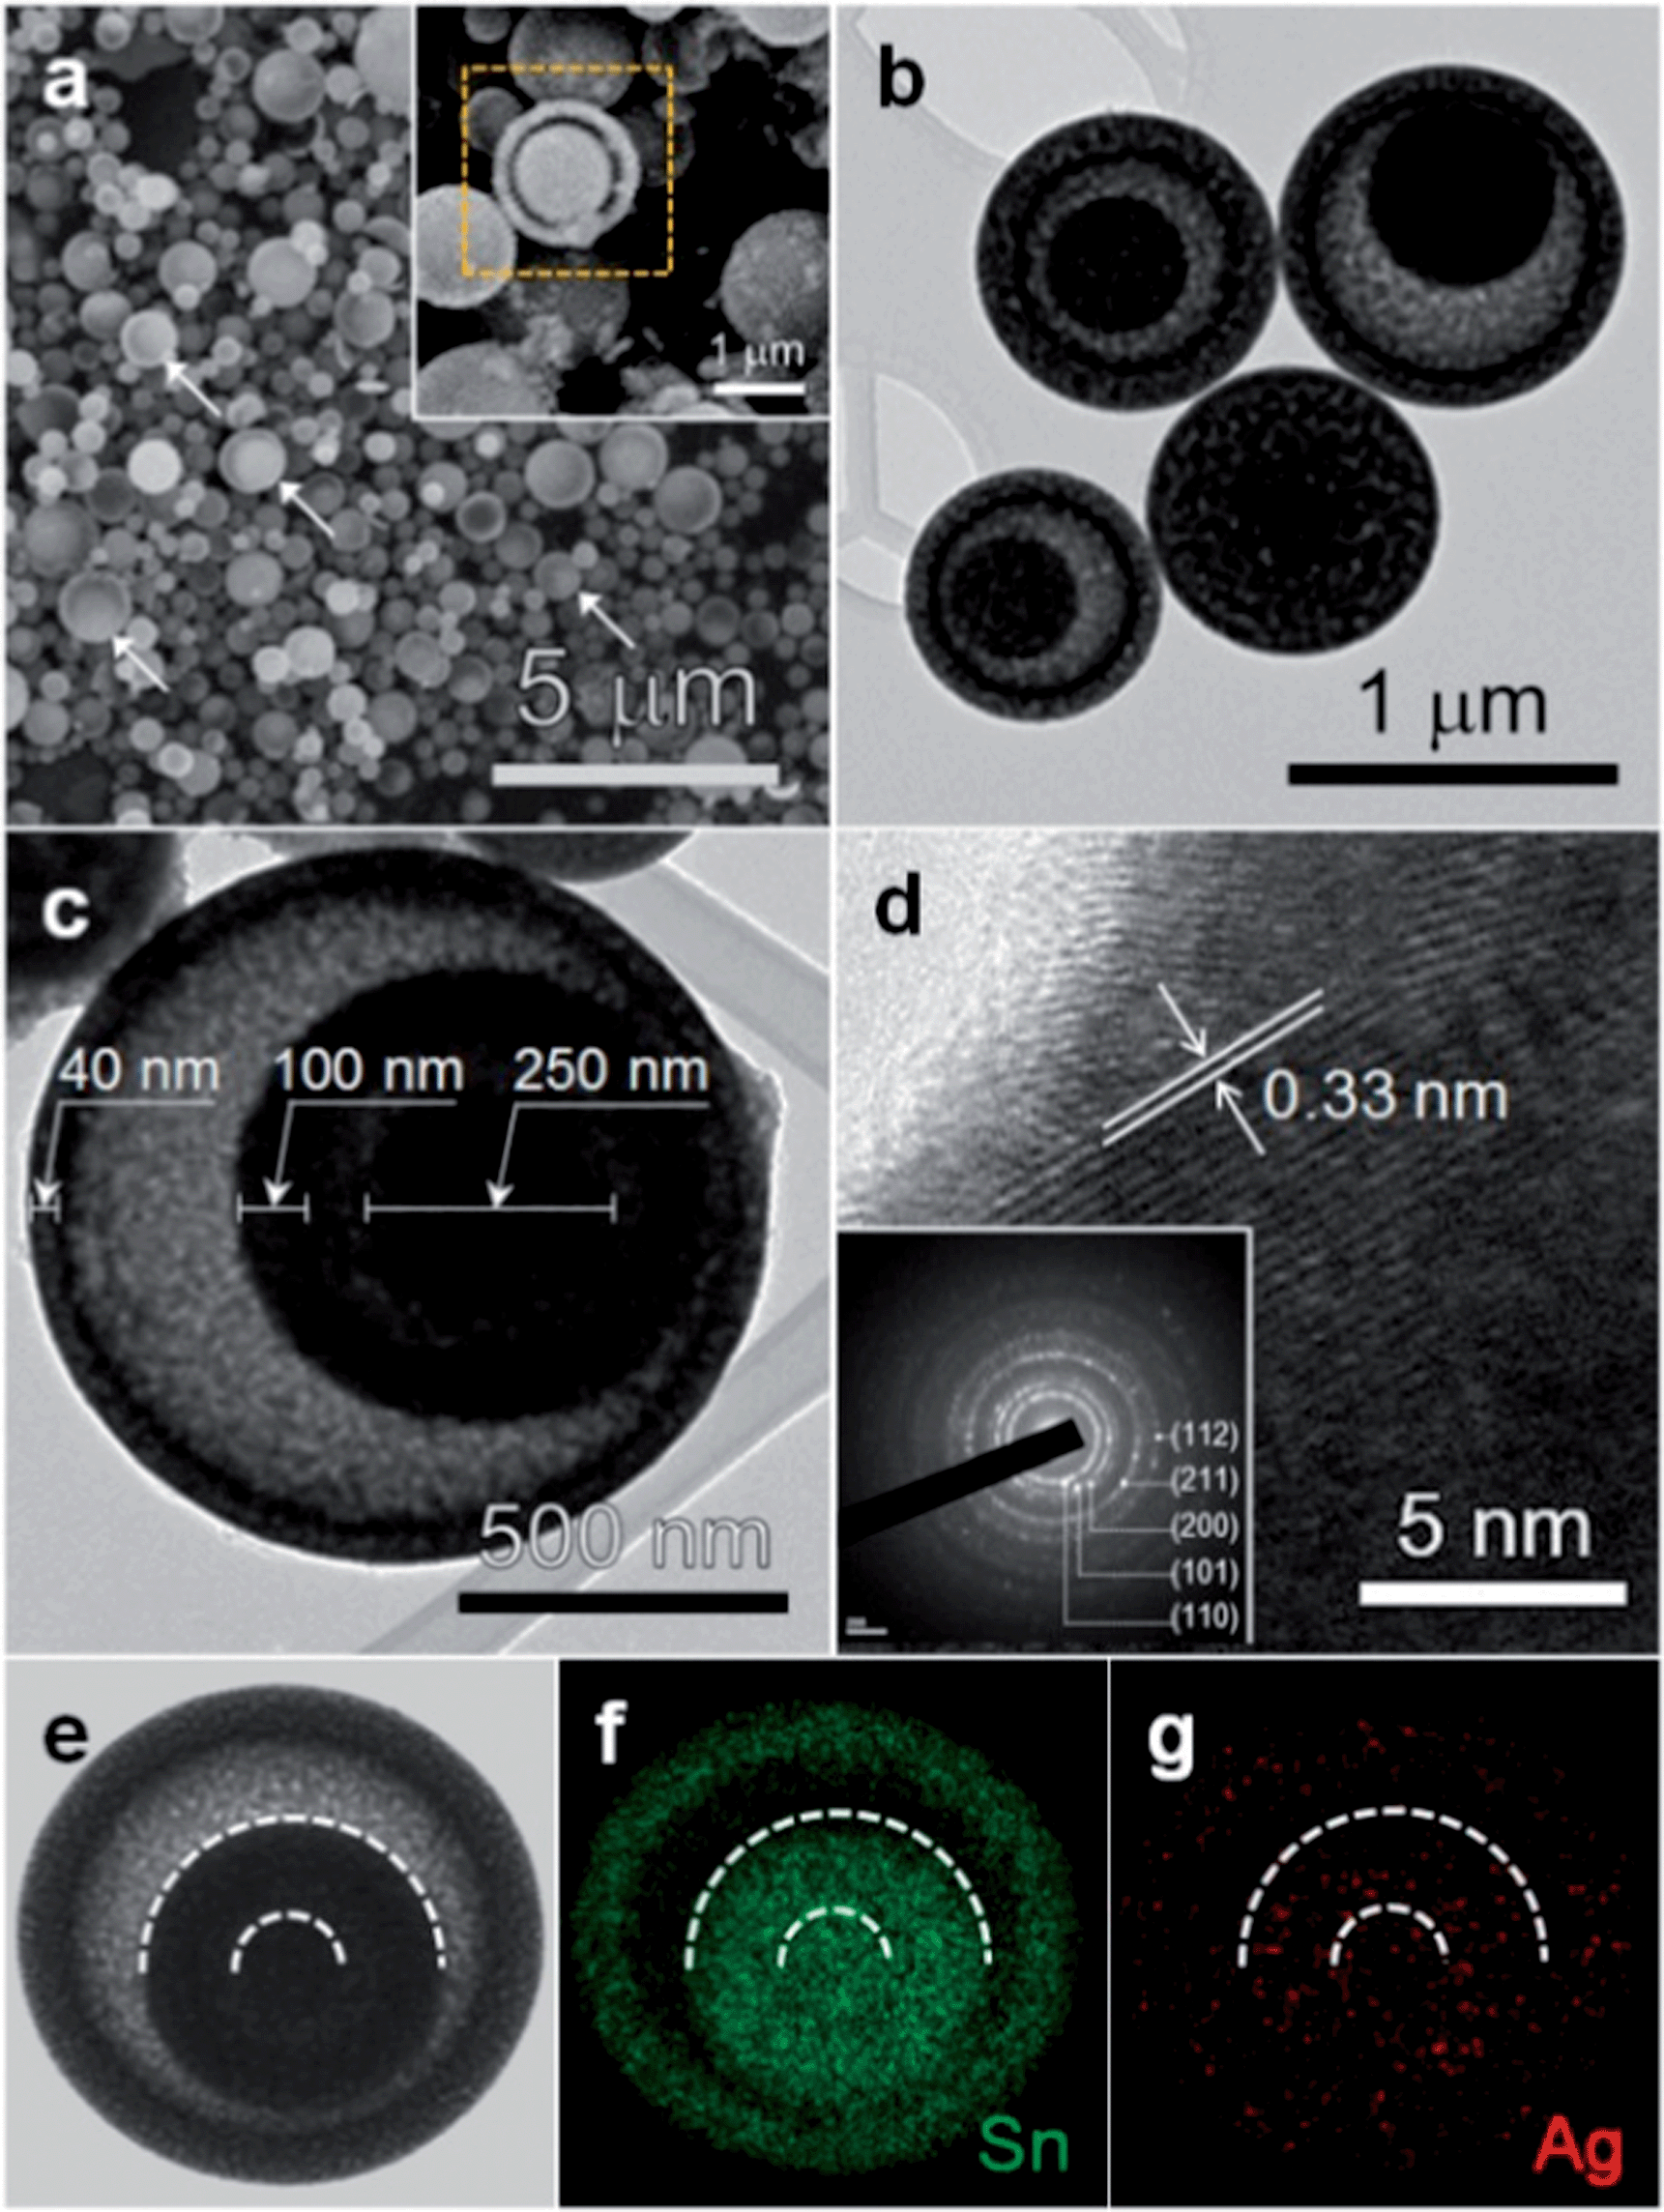 | ||
| Fig. 1 (a) SEM image, (b–d) TEM images, and (e–g) elemental mapping of Ag-loaded SnO2 yolk–shell spheres (Ag-YS-SnO2). | ||
For comparison, the D-SnO2 spheres were prepared from the precursor solution without sucrose. The solid inner structures were observed in the SEM image of a broken sphere (inset of Fig. S2a in the ESI†) and confirmed using TEM by the dark contour at the central portion of the spheres (Fig. S2b and S2c in the ESI†). The pure YS-SnO2 spheres were also prepared by the spray pyrolysis reaction of the solution containing the Sn-precursor and sucrose. The yolk–shell morphology was observed from a broken YS-SnO2 sphere (inset of Fig. S2d in the ESI†) and TEM images (Fig. S2e and S2f in the ESI†). The D-SnO2 and YS-SnO2 spheres had rutile-structured SnO2 (JCPDS# 41-1445) as determined by X-ray diffraction (Fig. S3a and S3b in the ESI†). It was difficult to find the second phases such as Ag and Ag2O in the Ag-YS-SnO2 spheres probably due to the low detection limit of X-ray diffraction. The crystallite sizes of D-SnO2, YS-SnO2, and Ag-YS-SnO2 spheres were determined by Scherrer's equation to be 13.3 ± 0.8 nm, 20.0 ± 3.4 nm, and 16.8 ± 1.6 nm, respectively. From ICP analysis, the presence of the Ag component was confirmed and the concentration of Ag was determined to be 0.13 at%. The valence state of Ag was investigated using XPS (Fig. S4 in the ESI†). No Ag related peak was observed in the SnO2 yolk–shell spheres loaded with Ag (Fig. S4b in the ESI†). Accordingly, SnO2 yolk–shell spheres loaded with 3.3 at% Ag were prepared by ultrasonic spray pyrolysis and heat treatment and their XPS spectra were studied. The binding energies of the Ag 3d3/2 and Ag 3d5/2 peaks were 374.4 and 368.5 eV, indicating that Ag existed in the form of Ag.35
The size and volume of pores were analyzed by nitrogen adsorption/desorption isotherms (Fig. 2). The volumes of nitrogen adsorption/desorption in YS-SnO2 and Ag-YS-SnO2 spheres were similar and significantly higher than in the D-SnO2 spheres (Fig. 2a). In the YS-SnO2 and Ag-YS-SnO2 spheres, the volume of nitrogen adsorption peaked at the pore sizes of 21.0 and 17.7 nm (Fig. 2c and e), respectively, and both showed high pore volumes (0.07 cm3 g−1 and 0.10 cm3 g−1). In contrast, a negligible pore volume (0.01 cm3 g−1) was found in the D-SnO2 spheres (Fig. 2g). The specific surface areas of the Ag-YS-SnO2, YS-SnO2, and D-SnO2 spheres were 16, 16, and 1.5 m2 g−1, respectively (Fig. 2b, d, and f). Thus, the abundant pores in the spheres as well as the thin configuration of the shells were expected to significantly enhance the gas accessibility.
 | ||
| Fig. 2 (a) Nitrogen adsorption/desorption isotherms of D-SnO2, YS-SnO2, and Ag-YS-SnO2 spheres and BET surface area and pore size distribution of (b and c) Ag-YS-SnO2 spheres, (d and e) YS-SnO2 spheres, and (f and g) D-SnO2 spheres. | ||
The gas responses of the D-SnO2, YS-SnO2, and Ag-YS-SnO2 spheres to 5 ppm H2S, C2H5OH, and HCHO were measured at 350–450 °C (Fig. 3). The D-SnO2 spheres exhibited the lowest response and selectivity to H2S, although the response to 5 ppm H2S was higher than those to 5 ppm C2H5OH and 5 ppm HCHO at all sensing temperatures (Fig. 3a-1). The gas response to 5 ppm H2S, C2H5OH, and HCHO was enhanced 1.7–2.2 times, 1.7–2.2 times, and 1.2–4.2 times, respectively, by employing the yolk–shell morphology (Fig. 3b-1). The thin and semi-permeable shells, abundant nano- and meso-pores, and high surface area of the SnO2 yolk–shell nanostructures likely induced the effective diffusion of the analyte gasses on the sensing surface. Specifically, the increase of gas accessibility and surface area to volume ratio through the morphological design of nanostructures was important in achieving a high gas response and was consistent with reports on the enhancement of gas responses by employing hollow or yolk–shell nanostructures.36,37
 | ||
| Fig. 3 Gas responses to 5 ppm H2S, C2H5OH, and HCHO at 350–450 °C and selectivity to 5 ppm H2S at 350 °C: (a) D-SnO2 spheres, (b) YS-SnO2 spheres, and (c) Ag-YS-SnO2 spheres (the concentrations of all the gases: 5 ppm, E: C2H5OH, F: HCHO, TMA: trimethylamine, A: NH3, B: benzene, T: toluene, X: o-xylene, H: H2 and C: CO). | ||
The response of the YS-SnO2 spheres to 5 ppm H2S at 350–450 °C was further enhanced by loading 0.13 at% Ag (Fig. 3c-1), while the variation in the response to 5 ppm C2H5OH and HCHO due to Ag loading was relatively small (Fig. 3b-2 and c-2). This led to the selective and sensitive detection of H2S. The responses of three different sensors to 5 ppm H2S, C2H5OH, HCHO, trimethylamine, NH3, benzene, toluene, o-xylene, H2 and CO were measured at 350 °C (Fig. 3a-2, b-2, and c-2) and the ratios between the responses to H2S and other interference gases (SL = SH2S/Sgas) were calculated in order to compare the selectivity to H2S in a quantitative manner. The SL values of the Ag-YS-SnO2 spheres (SL = 34.5–739.6) were markedly higher than those of the D-SnO2 (SL = 2.5–31.8) and YS-SnO2 spheres (SL = 2.3–36.0). In all three sensors, the response to 5 ppm C2H5OH was the second highest value (Fig. 3a-2, b-2, and c-2). Nevertheless, the SH2S/Sethanol value of the Ag-YS-SnO2 spheres was still as high as 34.5, which was significantly higher than those of the YS-SnO2 (2.46) and D-SnO2 (2.33) spheres and guaranteed the ultra-selective detection of H2S in the presence of interference gases. The enhancement of the SL values by Ag loading in YS-SnO2 spheres strongly suggested that the chemical interaction between Ag and H2S played a key role in the selective and sensitive detection of H2S. This was supported by the similar SL values of the D-SnO2 and YS-SnO2 spheres regardless of the variation in the nano-architectures (Fig. 3a-2 and b-2), as well as the completely different H2S sensing behaviors of YS-SnO2 and Ag-YS-SnO2 spheres in spite of their similar pore size distribution, pore volumes, and specific surface areas (Fig. 3b-2 and c-2).
The reversibility of the sensors after H2S sensing was investigated (Fig. 4). The recovery characteristics depended on the morphology and Ag loading of the spheres. For quantitative comparison, recovery rate (%) = (Rair-recovery − Rgas-H2S)/(Rair-fresh − Rgas-H2S) × 100 (%), where Rair-fresh is the sensor resistance in air before exposure to H2S, Rgas-H2S is the sensor resistance in 5 ppm H2S, and Rair-recovery is the sensor resistance in air after 1 h exposure to air. As such, the recovery rate (%) was calculated from the sensing transients and the results are shown in Fig. 5. At 350 °C, the D-SnO2 spheres did not completely recover the original sensor resistance in air after sensing 5 ppm H2S (Fig. 4a-1). After increasing the sensor temperature from 350 to 450 °C, the recovery rate (%) of the D-SnO2 spheres was increased from 28.7 to 95.8% (Fig. 4-a and 5a-1). The recovery rate (%) of the YS-SnO2 spheres was 36.7% at 350 °C and increased to 61.6% as the sensor temperature increased to 450 °C (Fig. 4-b and 5b-1). This indicates that the H2S response could be enhanced by the yolk–shell morphology, but at the expense of the reversibility. Finally, the recovery rate (%) of the Ag-YS-SnO2 spheres was as high as 84.1% even at 350 °C and the recovery was complete at 450 °C (Fig. 4c and 5c-1).
 | ||
| Fig. 4 Dynamic sensing transients to 5 ppm H2S at 350–450 °C: (a) D-SnO2 spheres, (b) YS-SnO2 spheres, and (c) Ag-YS-SnO2 spheres. | ||
 | ||
| Fig. 5 Sensor resistance in air (Ra), 90% response time (τres), and recovery rate [(Rair-recovery − Rgas-H2S)/(Rair-fresh − Rgas-H2S) × 100 (%)] where Rair-fresh: sensor resistance in air before exposure to H2S, Rgas-H2S: sensor resistance in 5 ppm H2S, and Rair-recovery: sensor resistance in air after 1 h exposure to air. (a) D-SnO2 spheres, (b) YS-SnO2 spheres, and (c) Ag-YS-SnO2 spheres. | ||
The sensing transients of Ag-YS-SnO2 spheres to 0.25–5 ppm H2S was measured at 350 °C (Fig. 6). The sensor showed reversible sensing and a high response to sub-ppm levels of H2S. The detection limit of H2S was determined to be <10.5 ppb when Ra/Rg − 1 > 0.2 was used as the sensing criterion (inset in Fig. 6). Permissible exposure limits of H2S suggested by the US OSHA and US NIOSH are 20 ppm.4,5 Recently, the American Conference of Governmental Industrial Hygienists changed the 8 h time weighted average recommended exposure limit from 10 ppm to 1 ppm based on a recent report.38 Although humans can recognize the presence of H2S at concentrations as low as 10–50 ppb,39 the human nose cannot quantify the concentration of H2S and is susceptible to olfactory fatigue. Accordingly, sub-ppm level detection of H2S is indispensable for monitoring air quality. Towards this end, the Ag-YS-SnO2 sensors provide a valuable sensing platform to detect ppb-levels of H2S in a highly sensitive, selective, and reversible manner.
 | ||
| Fig. 6 Sensing transients of Ag-YS-SnO2 spheres to 0.25–5 ppm H2S at 350 °C. | ||
The 90% response time (τres), the time to reach 90% variation of sensor resistance upon exposure to H2S, was calculated (Fig. 5a-2, b-2, and c-2). The τres values of the D-SnO2 spheres were higher than those of the YS-SnO2 and Ag-YS-SnO2 spheres. This can be attributed to the sluggish diffusion of gases through the dense agglomerates in the D-SnO2 spheres. The sensor resistances in air (Ra) of the YS-SnO2 spheres were ∼2 orders of magnitude higher than that of the D-SnO2 spheres (Fig. 5a-3 and b-3), possibly due to the decrease in the cross-sectional area for conduction of the yolk–shell morphology. However, the ∼3 orders of magnitude increase in Ra by loading Ag (Fig. 5b-3 and c-3) was not attributed to the morphological variation considering the similar pore size and specific surface area of the YS-SnO2 and Ag-YS-SnO2 spheres (Fig. 2). The loading of Ag is known to extend the electron depletion layers of n-type oxide semiconductors adjacent to Ag nanoparticles.40 Thus, the marked increase of Ra in Ag-loaded spheres might be attributed to the electronic interaction between Ag and the SnO2 yolk–shell spheres.
Reversible H2S sensing has been a challenging issue in the development of oxide semiconductors. For example, the D-SnO2 and YS-SnO2 spheres in the present study showed incomplete recovery from H2S sensing at 350 °C, yet showed a complete recovery after sensing nine different gasses that did not contain sulfur (Fig. S5 in the ESI†). This strongly indicated that the incomplete recoveries from H2S sensing in the D-SnO2 and YS-SnO2 sensors were related to sulfur-containing components during sensing and recovery. At 350–450 °C, O− is regarded as the major oxygen adsorption species and the following H2S sensing reaction can be considered:41
| H2S(g) + 3Oad− → SO2(g) + H2O(g) + 3e− | (1) |
Note that SO2(g) generated during the sensing reaction is known to adsorb on the surface sites of SnO2, turn into inactive stable sulfate, and eventually decrease the active sites of oxygen adsorption for gas sensing.42,43 Thus, the SO2 poisoning after the H2S sensing reaction makes it difficult to recover the sensor resistance at the sulfur-free fresh state. Thus, the high recovery rate (%) at high sensor temperatures can be explained by the increase of SO2 desorption.44 Notably, the recovery rates (%) of the YS-SnO2 spheres from H2S sensing at 375–450 °C (52.5–61.6%) (Fig. 5b-1) were relatively lower than those of the D-SnO2 spheres (75.6–95.8%) (Fig. 5a-1). A higher amount of SO2(g) will be generated from the large surface area of the YS-SnO2 spheres, which in turn will be adsorbed on the sensing surfaces in an irreversible manner. Accordingly, the high surface area to volume ratio of yolk–shell nanostructures with high gas accessibilities has both a positive effect of enhancing the gas response and an adverse effect of deteriorating the reversibility of H2S sensing. In contrast, the recovery rate (%) of the Ag-YS-SnO2 spheres was as high as 84.1% at 350 °C, which increased to ∼100% as the sensor temperature increased to 450 °C (Fig. 5c-1). Two plausible explanations for this include the reduced SO2 generation by the strong interaction between Ag and H2S to form Ag2S or (Ag–S)ads45,46 and the preferred adsorption of SO2 on Ag nanoclusters.47
In both cases, the recovery involved the re-oxidation of sulfurized Ag, which could be facilitated by providing more oxygen to the fine Ag particles with high surface areas. Thus, the reversible H2S sensing in the Ag-YS-SnO2 spheres emanated from the uniform distribution of fine Ag nanoparticles with high surface area to volume ratios and the effective diffusion of oxygen through the semi-permeable thin shells and abundant pores. Therefore, the synergetic combination between the yolk–shell morphology of the SnO2 spheres and the uniform loading of Ag nanoparticles provides an excellent strategy to design highly sensitive, selective, and reversible H2S sensors.
The responses and selectivities to H2S found in the literature are summarized in Fig. 7.48–63 Note that only the results showing both response and selectivity to H2S were considered for comparison. ‘Ra/Rg − 1’ and ‘Rg/Ra − 1’ were used as the responses of n-type and p-type semiconductor sensors, respectively. Considering both response and reversibility, Ra/Rg − 1 = 613.9 to 5 ppm H2S (demonstrated in the current work) was among the highest values found in the literature (Fig. 7a). The selectivity to H2S (SH2S/S2nd gas, SH2S: response to H2S, S2nd gas: the highest response to interference gas) in the present study was as high as 34.5, which was again the highest value among those of the reversible H2S sensors (Fig. 7b). This clearly shows that Ag-loaded SnO2 yolk–shell spheres are a promising H2S sensing material with a high response, excellent selectivity, and good reversibility.
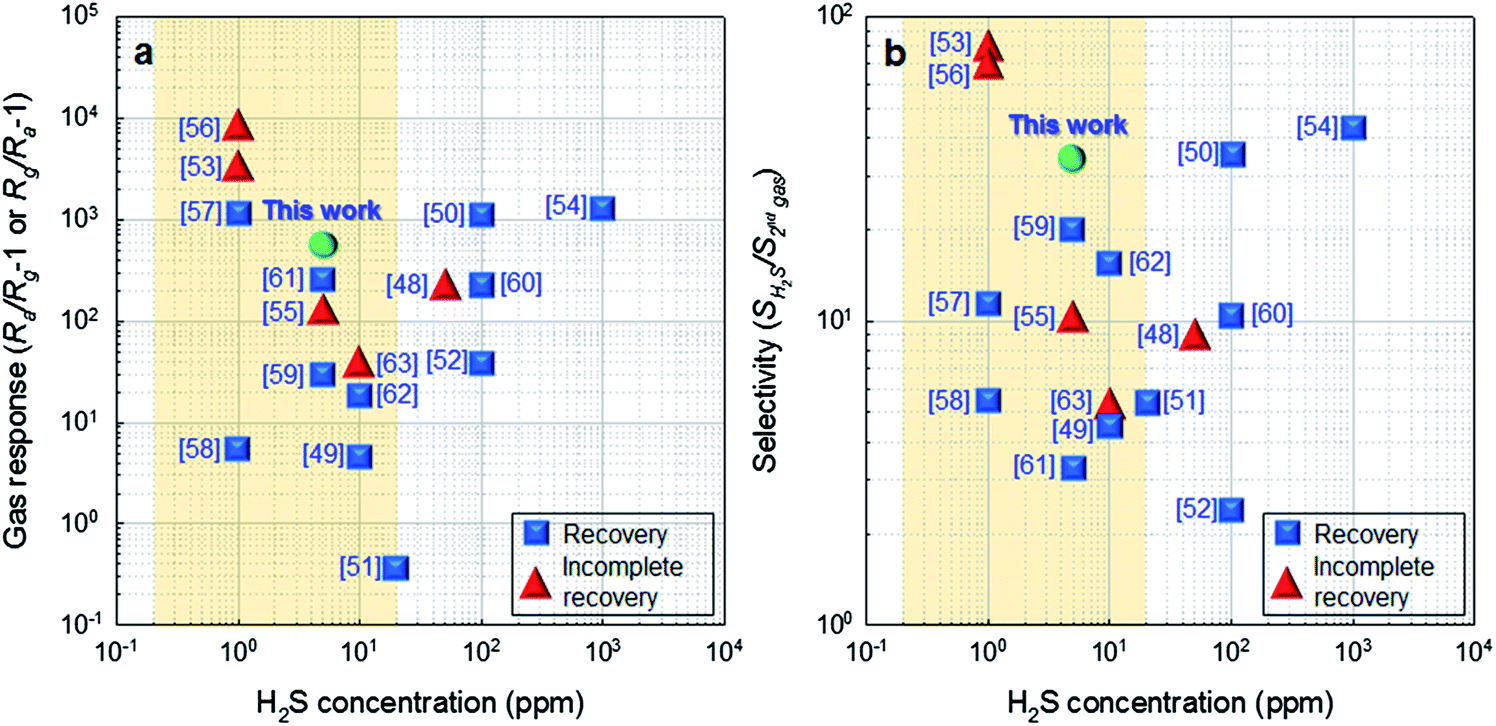 | ||
| Fig. 7 (a) Gas responses (Ra/Rg − 1 or Rg/Ra − 1) and (b) selectivity values (SH2S/S2nd gas) to H2S found in the literature (Ra/Rg − 1: gas response of n-type semiconductors, Rg/Ra − 1: gas response of p-type semiconductors, SH2S: response to H2S, S2nd gas: the highest response to interference gas). | ||
Conclusions
Highly sensitive, selective, and reversible H2S sensors were fabricated using Ag-loaded SnO2 yolk–shell spheres. The H2S gas response of pure SnO2 yolk–shell spheres was higher than that of SnO2 spheres with dense inner structures, which was attributed to the high surface area to volume ratio and gas accessibility of the spheres due to the yolk–shell morphology. However, highly selective and reversible H2S sensing remains challenging both in pure SnO2 spheres with dense inner structures and yolk–shell morphologies. In contrast, the SnO2 yolk–shell spheres uniformly loaded with Ag nanoparticles, prepared by a facile one-pot spray pyrolysis reaction, exhibited ultrahigh responses and selectivities to ppm levels of H2S as well as highly reversible H2S sensing. The superior H2S sensing was attributed to the enhancement of the H2S response by the gas accessible yolk–shell morphology, selective and sensitive detection of H2S via the strong chemical interaction between Ag and H2S, and Ag-induced suppression of SO2-related poisoning of SnO2 surface.Acknowledgements
This work was supported by the National Research Foundation of Korea (NRF) grant funded by the Korea government (MEST) (no. 2013R1A2A1A01006545). The work of Y.C. Kang was supported by NRF grant funded by MEST (no. 2012R1A2A2A02046367).References
- Hazardous Substances Databank (HSDB), Hydrogen sulfide: Environmental Fate & Exposure, National Library of Medicine, Bethesda, MD, USA, 2011, http://toxnet-.nlm.nih.gov/cgi-bin/sis/search/r?dbs+hsdb:@term+@rn+7783-06-4, accessed on 7 January 2014 Search PubMed.
- T. L. Guidotti, Occup. Med., 1996, 46, 367–371 CrossRef CAS PubMed.
- R. J. Reiffenstein, Annu. Rev. Pharmacol. Toxicol., 1992, 109–134 CrossRef CAS PubMed.
- Occupational Safety and Health Administration (OSHA), Fact sheet of hydrogen sulfide (H2S), DSG 10/2005, http://www.osha.gov/OshDoc/data_Hurricane_Facts/hydrogen-_sulfide_fact.pdf, accessed on 7 January 2014 Search PubMed.
- The National Institute for Occupational Safety and Health (NIOSH), Hydrogen Sulfide (No. 6013), Centers for Disease Control and Prevention, Atlanta, GA, USA, 2006, http://www.cdc.gov/niosh/docs/81-123/pdfs/0337.pdf, accessed on 7 January 2014 Search PubMed.
- N. Yamazoe, Sens. Actuators, B, 2005, 108, 2–14 CrossRef CAS.
- A. Kolmakov and M. Moskovits, Annu. Rev. Mater. Res., 2004, 34, 151–180 CrossRef CAS.
- M. E. Franke, T. J. Koplin and U. Simon, Small, 2006, 2, 36–50 CrossRef CAS PubMed.
- H.-R. Kim, A. Haensch, I.-D. Kim, N. Barsan, U. Weimar and J.-H. Lee, Adv. Funct. Mater., 2011, 21, 4456–4463 CrossRef CAS.
- J. Shin, S.-J. Choi, I. Lee, D.-Y. Youn, C. O. Park, J.-H. Lee, H. L. Tuller and I.-D. Kim, Adv. Funct. Mater., 2013, 23, 2357–2367 CrossRef CAS.
- D. Zhang, Z. Liu, C. Li, T. Tang, X. Liu, S. Han, B. Lei and C. Zhou, Nano Lett., 2004, 4, 1919–1924 CrossRef CAS.
- H.-J. Kim, J.-W. Yoon, K.-I. Choi, H. W. Jang, A. Umar and J.-H. Lee, Nanoscale, 2013, 5, 7066–7073 RSC.
- H. G. Moon, Y.-S. Shim, D. H. Kim, H. Y. Jeong, M. Jeong, J. Y. Jung, S. M. Hang, J. K. Kim, J.-S. Kim, H.-H. Park, J.-H. Lee, H. L. Tuller, S.-J. Yoon and H. W. Jang, Sci. Rep., 2012, 2, 1–7 Search PubMed.
- L. Wang, H. Dou, Z. Lou and T. Zhang, Nanoscale, 2013, 5, 2686–2691 RSC.
- I. Lee, J. B. Joo, Y. Yin and F. Zaera, Angew. Chem., 2011, 123, 10390–10393 CrossRef.
- H.-J. Kim, K.-I. Choi, A. Pan, H.-R. Kim, K.-M. Kim, C. W. Na, G. Cao and J.-H. Lee, J. Mater. Chem., 2011, 21, 6549–6555 RSC.
- J.-H. Lee, Sens. Actuators, B, 2009, 140, 319–336 CrossRef CAS.
- S.-J. Kim, I.-S. Hwang, C. W. Na, I.-D. Kim, Y. C. Kang and J.-H. Lee, J. Mater. Chem., 2011, 21, 18560–18567 RSC.
- H.-R. Kim, K.-I. Choi, K.-M. Kim, I.-D. Kim, G. Cao and J.-H. Lee, Chem. Commun., 2010, 46, 5061–5063 RSC.
- H. Zhang, Q. Zhu, Y. Zhang, Y. Wang, L. Zhao and B. Yu, Adv. Funct. Mater., 2007, 17, 2766–2771 CrossRef CAS.
- X. Lai, J. Li, B. A. Korgel, Z. Dong, Z. Li, F. Su, J. Du and D. Wang, Angew. Chem., 2011, 123, 2790–2793 CrossRef.
- A. Chowdhuri, V. Gupta, K. Sreenivas, R. Kumar, S. Mozumdar and P. K. Patanjali, Appl. Phys. Lett., 2004, 84, 1180–1182 CrossRef CAS.
- A. Khanna, R. Kumar and S. S. Bhatti, Appl. Phys. Lett., 2003, 82, 4388–4390 CrossRef CAS.
- S.-J. Kim, C. W. Na, I.-S. Hwang and J.-H. Lee, Sens. Actuators, B, 2012, 168, 83–89 CrossRef CAS.
- N. S. Ramgir, C. P. Goyal, P. K. Sharma, U. K. Goutam, S. Bhattacharya, N. Datta, M. Kaur, A. K. Debnath, D. K. Aswal and S. K. Gupta, Sens. Actuators, B, 2013, 188, 525–532 CrossRef CAS.
- T.-S. Wang, Q.-S. Wang, C.-L. Zhu, Q.-Y. Ouyang, L.-H. Qi, C.-Y. Li, G. Xiao, P. Gao and Y.-J. Chen, Sens. Actuators, B, 2012, 171–172, 256–262 CrossRef CAS.
- S. P. Sharma, J. Electrochem. Soc., 1980, 127, 21–26 CrossRef CAS.
- D. H. McCrea, A. J. Forney and J. G. Myers, J. Air Pollut. Control Assoc., 1970, 20, 819–824 CrossRef CAS.
- C. H. Bartholomew, P. K. Agrawal and J. R. Katzer, in Advances in Catalysis, ed. D. D. Eley, P. W. Selwood and P. B. Weisz, Academic Press, New York, 1982, vol. 31, p. 135 Search PubMed.
- Y. J. Hong, M. Y. Son and Y. C. Kang, Adv. Mater., 2013, 25, 2279–2283 CrossRef CAS PubMed.
- Y. J. Hong, J.-W. Yoon, J.-H. Lee and Y. C. Kang, Chem.–Eur. J., 2014, 20, 2737–2741 CrossRef CAS PubMed.
- J. Mizsei and V. Lantto, Sens. Actuators, B, 1991, 4, 163–168 CrossRef CAS.
- L. Jianping, W. Yue, G. Xiaoguang, M. Qing, W. Li and H. Jinghong, Sens. Actuators, B, 2000, 65, 111–113 CrossRef CAS.
- J. Gong, Q. Chen, M.-R. Lian, N.-C. Liu, R. G. Stevenson and F. Adami, Sens. Actuators, B, 2006, 114, 32–39 CrossRef CAS.
- L. Ley, M. Cardona, Y. Baer, M. Campagna, W. D. Grobman, H. Hochst, S. Hufner, E. E. Koch, C. Kunz, R. A. Pollak, P. Steigner and G. K. Wertheim, in Topics in Applied Physics, ed. L. Ley and M. Cardona, Springer-Verlag, Berlin, 1979, vol. 27 Search PubMed.
- C. J. Martinez, B. Hockey, C. B. Montgomery and S. Semancik, Langmuir, 2005, 21, 7937–7944 CrossRef CAS PubMed.
- J. Ming, Y. Wu, L. Wang, Y. Yu and F. Zhao, J. Mater. Chem., 2011, 21, 17776–17782 RSC.
- American Conference of Governmental Industrial Hygienists (ACGIH), in Documentation for immediately dangerous to life or health concentration (IDLHs), http://www.cdc.gov/noish/idlh/7783064.html Search PubMed.
- R. Munoz, E. C. Sivret, G. Parcsi, R. Lebrero, X. Wang, I. H. (Mel) Suffet and R. M. Stuetz, Water Res., 2010, 44, 5129–5149 CrossRef CAS PubMed.
- N. Yamazoe, Sens. Actuators, B, 1991, 5, 7–19 CrossRef CAS.
- V. Krivetskiy, A. Ponzoni, E. Comini, S. Badalyan, M. Rumyantseva and A. Gaskov, Electroanalysis, 2010, 22, 2809–2816 CrossRef CAS.
- L. Urfels, P. Gelin, M. Primet and E. Tena, Top. Catal., 2004, 30–31, 427–432 CrossRef.
- J. D. Prades, A. Cirera and J. R. Morante, J. Electrochem. Soc., 2007, 154, H675–H680 CrossRef CAS.
- D. A. Outka, R. J. Madix, G. B. Fisher and C. DiMaggio, J. Phys. Chem., 1986, 90, 4051–4057 CrossRef CAS.
- H. Kiuchi, T. Nakamura, K. Kunaki and T. Tanaka, Int. J. Hydrogen Energy, 1982, 7, 477–482 CrossRef CAS.
- J. Perdereau and G. E. Rhead, Surf. Sci., 1967, 7, 175–187 CrossRef CAS.
- D. A. Outka and R. J. Madix, Surf. Sci., 1984, 137, 242–260 CrossRef CAS.
- Z. Liu, T. Fan, D. Zhang, X. Gong and J. Xu, Sens. Actuators, B, 2009, 136, 499–509 CrossRef CAS.
- Y.-J. Chen, F. Meng, H. Yu, C. Zhu, T. Wang, P. Gao and Q. Ouyang, Sens. Actuators, B, 2013, 176, 15–21 CrossRef CAS.
- G. H. Jain, L. A. Patil, M. S. Wagh, D. R. Patil, S. A. Patil and D. P. Amalnerkar, Sens. Actuators, B, 2006, 117, 159–165 CrossRef CAS.
- P. S. Shewale, V. B. Patil, S. W. Shin, J. H. Kim and M. D. Uplane, Sens. Actuators, B, 2013, 186, 226–234 CrossRef CAS.
- H.-L. Yu, L. Li, X.-M. Gao, Y. Zhang, F. Meng, T.-S. Wang, G. Xiao, Y.-J. Chen and C.-L. Zhu, Sens. Actuators, B, 2012, 171–172, 679–685 CrossRef CAS.
- G. H. Jain and L. A. Patil, Sens. Actuators, B, 2007, 123, 246–253 CrossRef CAS.
- S. S. Badadhe and I. S. Mulla, Sens. Actuators, B, 2009, 143, 164–170 CrossRef.
- J. Gong, Q. Chen, M.-R. Lian, N.-C. Liu, R. G. Stevenson and F. Adami, Sens. Actuators, B, 2006, 114, 32–39 CrossRef CAS.
- L. A. Patil and D. R. Patil, Sens. Actuators, B, 2006, 120, 316–323 CrossRef CAS.
- Y. Shen, B. Zhang, X. Cao, D. Wei, J. Ma, L. Jia, S. Gao, B. Cui and Y. Jin, Sens. Actuators, B, 2014, 193, 273–279 CrossRef CAS.
- F.-N. Meng, X.-P. Di, H.-W. Dong, Y. Zhang, C.-L. Zhu, C. Li and Y.-J. Chen, Sens. Actuators, B, 2013, 182, 197–204 CrossRef CAS.
- N. Datta, M. Ramgir, M. Kaur, S. K. Ganapathi and A. K. Debnath, Sens. Actuators, B, 2012, 166–167, 394–401 CrossRef CAS.
- Y. Wang, Y. Wang, J. Cao, F. Kong, H. Xia, J. Zhang, B. Zhu, S. Wang and S. Wu, Sens. Actuators, B, 2008, 131, 183–189 CrossRef CAS.
- N. S. Ramgir, S. K. Ganapathi, M. Kaur, M. Datta, K. P. Muthe, D. K. Aswal, S. K. Gupta and J. V. Yakhmi, Sens. Actuators, B, 2010, 151, 90–96 CrossRef CAS.
- M. Zhao, X. Wang, L. Ning, J. Jia, X. Li and L. Cao, Sens. Actuators, B, 2011, 156, 588–592 CrossRef CAS.
- M. Kaur, M. Jain, K. Sharma, S. Bhattacharya, M. Roy, A. K. Tyagi, S. K. Gupta and J. V. Yakhmi, Sens. Actuators, B, 2008, 133, 456–461 CrossRef CAS.
Footnotes |
| † Electronic supplementary information (ESI) available: Experimental setup of ultrasonic spray pyrolysis, SEM and TEM images of SnO2 spheres with dense inner structures and yolk–shell morphologies, X-ray diffraction patterns, XPS results, and gas sensing transients to 8 interference gases. See DOI: 10.1039/c4ra01364f |
| ‡ Both authors contributed equally to this work. |
| This journal is © The Royal Society of Chemistry 2014 |