Facile fabrication of Chinese lantern-like MnO@N–C: a high-performance anode material for lithium-ion batteries

Tian Qiu, Juan Wang, Yanluo Lu and Wensheng Yang*
State Key Laboratory of Chemical Resource Engineering, Beijing University of Chemical Technology, Beijing, 100029, China. E-mail: yangws@mail.buct.edu.cn; Fax: +86 10 64425385; Tel: +86 10 64435271

Received 13th February 2014 , Accepted 12th May 2014

First published on 13th May 2014


Abstract

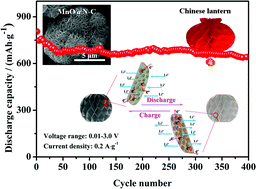
Chinese lantern-like MnO coated with N-doped C (MnO@N–C) was fabricated from Chinese lantern-like MnCO3 coated with polydopamine (MnCO3@PDA) precursor that was calcined at 600 °C for 5 h under an N2 atmosphere. MnO@N–C was then investigated as an anode for lithium-ion batteries. Structural characterization results indicate that MnO@N–C comprised numerous nanoplates with a thickness of ∼35 nm. The nanoplates consisted of MnO nanoparticles (∼15 nm) that were homogeneously embedded within the N-doped C (N–C) matrix. The uniformly embedded MnO nanoparticles can realize a high electrochemical utilization of the material to generate a high specific capacity. The N–C matrix and voids between the nanoplates can minimize strain, thereby maintaining the structural stability of the MnO@N–C electrode during the discharge/charge process, enabling improved cyclic performance. Additionally, the MnO@N–C nanoplates with high specific surface area in the Chinese lantern-like framework can shorten the path diffusing length of the lithium ions and the N–C matrix can provide efficient electrical integrity to the electrode, which can enhance the rate capability. Consequently, the obtained MnO@N–C exhibits a high reversible specific capacity of 810 mA h g−1 at 0.2 A g−1, favorable cyclic stability of 640 mA h g−1 after 400 cycles, and excellent rate capability of 451 mA h g−1 at 1 A g−1 and 285 mA h g−1 at 4 A g−1.


Introduction

To meet the increasing demands for high energy and power density, transition metal oxides (TMOs), such as MnO,1,2 Fe3O4,3 Co3O4,4 NiO,5 CuO,6 and ZnO,7 have been intensively studied as anode materials for lithium-ion batteries (LIBs) because of their higher theoretical capacity (>700 mA h g−1) compared with that of commercial graphite (372 mA h g−1).8–10 Among these TMOs, MnO exhibits unique features on relatively low voltage hysteresis (<0.8 V) and high density (5.43 g cm−3).1,11,12 Furthermore, MnO can be prepared from highly abundant Mn resources; fabrication is environmental friendly and cost is low.1,2,13,14 These features make MnO a promising anode material in comparison with other TMOs. However, like many other TMOs, the large volume expansion/contraction during the repeated conversion reaction and the poor electronic conductivity of MnO result in the poor cycle stability and rate capability.1,13,14

Great efforts have been devoted to designing and synthesizing MnO and MnO/C hybrids with improved electrochemical performance.1,2,12,14–25 Generally, nano-size MnO particles can realize a high electrochemical utilization of the material to generate a high specific capacity; various forms of C or N-doped C can prevent agglomeration of nanoparticles, minimize strain during the discharge/charge process, and enhance the conductivity. Nevertheless, it remains a great challenge to fabricate nanostructured MnO/C anodes with desirable architectures for fulfilling the requirements of high specific capacity and long life.

Recently, nanoplate, a two-dimensional (2D) nanoarchitecture in which one dimension is in the nanometer range (<100 nm) while the other two dimensions are in the micrometer or sub-micrometer range, have been considered a useful structure in LIBs because of the short ion diffusion path, the large surface area and the easy current collection.26–28 However, nanoplates may adhere to each other to result in agglomeration. Such agglomeration would increase distance for Li+ ions diffusion and decrease electrode–electrolyte contact area, leading to poor electrochemical performance. Therefore, if nanoplates are rationally designed and assembled to three-dimensional (3D) structure, the electrochemical performance is expected to be greatly promoted.

Herein, we prepared Chinese lantern-like MnO coated with N-doped C (MnO@N–C), a novel nanostructure for MnO-based anode materials, from precursor Chinese lantern-like MnCO3 coated with polydopamine (MnCO3@PDA) that was subjected to calcination at 600 °C for 5 h under N2 atmosphere. The general process for the fabrication of MnO@N–C is shown in Scheme 1, which is very facile and green. The obtained MnO@N–C was evaluated as anodes for lithium-ion batteries.


image file: c4ra01285b-s1.tif
Scheme 1 Schematic illustration of the synthesis process of MnO@N–C.

Experimental section

Reagents

Li2CO3 (>97%, XiLong Chemical Co. Ltd., Guangdong, China), MnSO4·H2O (>99%, XiLong Chemical Co. Ltd., Guangdong, China), dopamine (DA, 98%, Beijing Ouhe Technology Co. Ltd., Beijing, China), and Tris (>99.9%, Beijing Huizeao Co. Ltd., Beijing, China) were used without further purification.

Synthesis of MnCO3 precursor

MnCO3 precursor was first synthesized as follows. A 100 mL Li2CO3 suspension (0.2 mole) was prepared under stirring for 30 min. Then, 100 mL MnSO4·H2O (0.2 mole) was added to the suspension using a peristaltic pump at a flow rate of 1.5 mL min−1. The mixture was stirred for 3 h following addition of the MnSO4 aqueous solution. The resulting mixture was then filtered, washed several times to remove Li2SO4, and dried at 40 °C for 24 h to obtain the Chinese lantern-like MnCO3 precursor. The formation mechanism of Chinese lantern-like MnCO3 was estimated according to the FESEM images of the intermediate products (Scheme S1 and Fig. S1).

Synthesis of MnO@N–C

The as-prepared MnCO3 precursor (0.5 g) was mixed with DA (0.25 g) in Tris-buffer solution (100 mL, 1.2 mg mL−1, pH 8.5) under stirring for 24 h, generating a polydopamine (PDA) coating. The PDA-coated MnCO3 (MnCO3@PDA) was washed with deionized water and collected by centrifugation at 4000 rpm for 5 min for several times. MnCO3@PDA was then calcined at 600 °C for 5 h under N2 atmosphere with a heating rate of 5 °C min−1 to obtain MnO@N–C. The as-prepared MnCO3 precursor, in the absence of a PDA coating, was also calcined at 600 °C for 5 h to obtain pure MnO as the control sample.

Materials characterization

The samples were characterized by X-ray diffraction (XRD, D/max-Ultima III, Rigaku Co., Japan), field-emission scanning electron microscopy (FESEM, Zeiss Supra 55, Carl Zeiss Co., Germany) with an INCA OXFORD energy dispersive X-ray spectrometer (EDX, Oxford Instruments, Britain), transmission electron microscopy (TEM, H800, Hitachi, Japan) and high-resolution transmission electron microscopy (HRTEM, Tecnai G2 F30, FEI, USA). X-ray photoelectron spectroscopy (XPS) measurements were conducted on a Thermo ESCALAB 250 X-ray photoelectron (Thermo Fisher Scientific Inc., USA) using Al Kα (1486.6 eV) radiation. Raman spectra were recorded on a LabRAM ARAMIS Raman spectrometer (Horiba Jobin Yvon, France) with a 532 nm excitation laser. Elemental analysis for C and N was carried out using an Elementar Vario EL Cube elemental analyzer (Elementar Analysensysteme GmbH, Germany). N2 adsorption–desorption isotherms were measured at 77 K on a Quantachrome autosorb IQ (Quantachrome Instrument Co., USA).

Electrochemical measurements

The electrochemical performance of the as-obtained MnO@N–C (or MnO) as anode material for LIBs was evaluated. The electrode was prepared by mixing MnO@N–C (or MnO), acetylene black, and polyvinylidence fluoride (PVDF) at a weight ratio of 80[thin space (1/6-em)]:[thin space (1/6-em)]10[thin space (1/6-em)]:[thin space (1/6-em)]10 onto a Cu foil. Coin-type CR2032 cells were assembled in an Ar-filled glove box (UniLab, MBraun GmbH, Germany; H2O < 1 ppm; O2 < 1 ppm) using lithium foil as the counter and reference electrode, Celgard 2400 as the separator, and 1 mol L−1 LiPF6 in ethylene carbonate/dimethyl carbonate/sulfolane (mass ratio of 1[thin space (1/6-em)]:[thin space (1/6-em)]1[thin space (1/6-em)]:[thin space (1/6-em)]1) as the electrolyte. Galvanostatic discharge/charge tests were performed on a LAND CT2001A test system (Wuhan LAND electronics Co. Ltd., China). Electrochemical impedance spectroscopy (EIS) with a perturbation voltage of 5 mV over a frequency range of 106–10−2 Hz was conducted on a Zahner IM6e Electrochemical Workstation (ZAHNER-elektrik GmbH & Co. KG, Germany).

Results and discussion

Structural characterization

The as-prepared MnCO3 displayed a typical XRD pattern that was ascribed to the rhombohedral phase (space group: R[3 with combining macron]c (167)) of MnCO3 (JCPDS no. 86-0172), as shown in Fig. 1a. After coating with PDA at room temperature, MnCO3@PDA displayed the same XRD pattern (Fig. 1a) as that of as-prepared MnCO3, indicating that the crystal structure of MnCO3 was retained during the coating process. Following calcination of MnCO3@PDA at 600 °C for 5 h, the resulting MnO@N–C showed a typical XRD pattern that was ascribed to the cubic phase (space group: Fm[3 with combining macron]m (225)) of MnO (JCPDS no. 89-4835), as shown in Fig. 1b. A weak XRD signal at ∼2θ = 20° (denoted by *) was also observed, and ascribed to the diffraction of C, obtained following calcination of the PDA coating. Compared with the XRD pattern of pure MnO, obtained from MnCO3, the XRD pattern of MnO@N–C shows large full widths at half-maximum (FWHM), indicating the presence of small MnO particles in MnO@N–C.
image file: c4ra01285b-f1.tif
Fig. 1 XRD patterns of (a) MnCO3 and MnCO3@PDA, and (b) MnO and MnO@N–C.

The total content of C and N in MnO@N–C are 23.8 and 2.98 wt%, respectively, as determined by organic elemental analysis. The calculated atomic ratio of C and N (C/N) is ∼9.3, which is approximately close to 8 of C/N in the molecular formula of DA (C8H11NO2).

The morphology of the MnCO3 precursor is shown in Fig. 2a and b. MnCO3 features a three-dimensional (3D) structure with interconnecting-MnCO3 nanoplates. This morphology is similar to that of Chinese lanterns (as depicted in Fig. 2b inset) that consist of several thin pieces of paper. Hence, the herein prepared MnCO3 precursor is termed as Chinese lantern-like MnCO3. MnCO3@PDA also displayed a similar morphology (Fig. 2d and e) that was indicative of the formation of a homogeneous PDA coating layer. Following calcination, the obtained MnO@N–C also displayed the Chinese lantern-like structure morphology (Fig. 2g and h). The thickness of the nanoplate in MnO@N–C is ∼35 nm. Conversely, the obtained MnO, following calcination of MnCO3 only (in the absence of the PDA coating) consisted of particle aggregates (Fig. 2j) with MnO particle sizes of up to ∼400 nm (Fig. 2k). EDX of MnCO3 (Fig. 2c), MnCO3@PDA (Fig. 2f) and MnO@N–C (Fig. 2i) showed that C, Mn and O elements with different ratios of peak intensity were detected. EDX of MnO (Fig. 2l) showed that only Mn and O elements were detected.


image file: c4ra01285b-f2.tif
Fig. 2 FESEM images of (a and b) MnCO3, (d and e) MnCO3@PDA, (g and h) MnO@N–C, and (j and k) MnO. An illustration of a Chinese lantern is depicted in the inset of Fig. 2b. EDX of (c) MnCO3, (f) MnCO3@PDA, (i) MnO@N–C, and (l) MnO. The elements collection area of each sample is in the yellow square in the corresponding insets.

The N2 adsorption–desorption isotherms of MnO@N–C and MnO, measured at 77 K, are shown in Fig. S2. MnO@N–C has a specific surface area (Brunauer–Emmett–Teller, BET) of 179.05 m2 g−1 that is significantly higher than that of MnO (2.38 m2 g−1). The high specific surface area of MnO@N–C is expected to provide an efficient contact area between the electrode material and electrolyte, thus facilitating lithium ions transportation.

Based on the above information, a brief summary of the synthesis process is presented. The Chinese lantern-like MnCO3 precursor acts as a hard template for PDA coating to form MnCO3@PDA. During the calcination, PDA transforms to the N-doped C (N–C) matrix which remains the original Chinese lantern-like morphology. Furthermore, the N–C matrix also wraps and restricts the growth of the MnO particles. Hence, a Chinese lantern-like MnO@N–C is obtained via this facile and green strategy.

The structural details of MnCO3, MnCO3@PDA, MnO@N–C and MnO were assessed by TEM and HRTEM. TEM images of MnCO3 (Fig. 3a), MnCO3@PDA (Fig. 3d) and MnO@N–C (Fig. 3g) also showed the 3D interconnecting nanoplates, confirming the Chinese lantern-like structure maintained after PDA coating and subsequent calcination. HRTEM images of the MnCO3 nanoplates showed that the MnCO3 nanoplates were composed of small MnCO3 nanoparticles (Fig. 3b). The observed distinct fringe spacings of 0.35 and 0.21 nm that corresponded to (012) and (113) planes of MnCO3, respectively (Fig. 3c), were indicative of the polycrystalline nature of the MnCO3 nanoplates. HRTEM images of MnCO3@PDA (Fig. 3e and f) showed that the MnCO3 nanoplate was homogeneously embedded within the PDA coating layer and the distinct fringe spacings of 0.28 nm were attributed to (104) planes of MnCO3. The observed MnO nanoparticles in MnO@N–C (Fig. 3h) are ∼15 nm, which agrees with the broad FWHM results of the XRD studies. High-resolution analysis of the edge of MnO@N–C (Fig. 3i) revealed that the MnO nanoparticles were homogeneously embedded within the N–C matrix. The distinct fringe spacings of 0.26 nm were attributed to (111) planes of cubic MnO. TEM image of MnO (Fig. 3j) showed particle aggregated after calcination of MnCO3. HRTEM images of MnO (Fig. 3k and l) showed the presence of large MnO particles with bare surface and the distinct fringe spacings of 0.26 nm were correspond to (111) planes of cubic MnO. Unlike the large MnO particles (in MnO), the uniformly embedded MnO nanoparticles within the N–C matrix (in MnO@N–C) are highly beneficial towards obtaining a high specific capacity during the conversion reaction. In addition, the continuous N–C matrix will maintain efficient electrical integrity to the electrode MnO@N–C during cycling.


image file: c4ra01285b-f3.tif
Fig. 3 TEM images of (a) MnCO3, (d) MnCO3@PDA, (g) MnO and (j) MnO@N–C. HRTEM images of (b and c) MnCO3, (e and f) MnCO3@PDA, (h and i) MnO and (k and l) MnO@N–C.

X-ray photoelectron spectroscopy (XPS) was used to further evaluate the valence state of Mn, C, and N in MnO@N–C. The XPS survey spectrum (Fig. 4a) features peaks corresponding to Mn (2s, 2p1/2, 2p3/2, 3s, and 3p), O1s, C1s, and N1s. The two peaks at 641.5 and 653.3 eV, as observed in the high-resolution Mn 2p spectrum (Fig. 4b), can be ascribed to Mn(II) 2p3/2 and 2p1/2, respectively, confirming the presence of Mn(II) in MnO@N–C.2 XPS C1s spectra are shown in Fig. 4c. The strong C1s signal at 284.6 eV corresponds to sp2C–sp2C, whereas the weaker signals at 285.2, 286.2, and 288.3 eV are ascribed to N–sp2C, N–sp3C, and residual O species bonded to C atoms, respectively.29 The high-resolution N1s spectrum (Fig. 4d) displays three peaks corresponding to pyridinic (N1, 398.4 eV), pyrrolic (N2, 400.5 eV), and graphitic (N3, 402.0 eV) N atoms, respectively,29,30 indicating the presence of a N–C matrix. The N binding configuration comprises 44.1% pyridinic N, 49.0% pyrrolic N, and 5.1% graphitic N. The high contents of pyridinic and pyrrolic N are expected to play an important role in improving the lithium storage performance of the N–C matrix.31


image file: c4ra01285b-f4.tif
Fig. 4 XPS spectra of MnO@N–C: (a) survey spectra, (b) Mn 2p peaks, (c) C1s peaks, and (d) N1s peaks.

Fig. 5 shows the Raman spectra of MnCO3, MnCO3@PDA, MnO@N–C and MnO. Two distinct peaks at 722 and 1085 cm−1 attributed to MnCO3 were disappeared for MnCO3@PDA, which indicated that MnCO3 was well coated with the PDA coating layer. The spectrum of MnO@N–C displayed two distinct peaks at 1350 and 1584 cm−1 that are related to the D-band (A1g vibration mode of the disordered carbon) and G-band (E2g vibration mode of the ordered graphitic carbon), respectively.14 The D-band with high intensity is ascribed to the existence of nongraphitic C and N-doped C, which possesses significantly more Li storage sites than graphitic carbon.21,32 In comparison with the Raman spectrum of MnO, the spectrum of MnO@N–C displayed no peaks attributed to MnO. In combination with XRD and HRTEM results, it is well convinced that MnO nanoparticles are embedded within the N–C matrix for MnO@N–C.


image file: c4ra01285b-f5.tif
Fig. 5 Raman spectra of MnCO3, MnCO3@PDA, MnO@N–C and MnO.

Electrochemical performance

The electrochemical performance of MnO@N–C and MnO was investigated by galvanostatic discharge/charge tests. The calculated specific capacity was based on the total mass of MnO and C for MnO@N–C. Fig. 6a shows the discharge/charge curves of MnO@N–C and MnO at a current density of 0.2 A g−1 between 0.01 and 3 V. Taking MnO@N–C for example, during the first discharge process, a sustained voltage plateau at ∼0.25 V is observed that increased to ∼0.5 V in subsequent discharge processes, which is similar to the discharge curves of MnO reported in previous literatures,13,33 and can be assigned to the reduction from Mn2+ to Mn0. The voltage plateau is at ∼1.2 V during the charge process, and can be assigned to the oxidation from Mn0 to Mn2+. MnO shows similar discharge/charge curves as MnO@N–C, with a activation process and voltage hysteresis. The first discharge and charge specific capacities of MnO@N–C are up to 1297.7 mA h g−1 and 810.2 mA h g−1 with a columbic efficiency of 62.4%. However, the first discharge and charge specific capacities of MnO are lower, i.e., 926.1 mA h g−1 and 551.7 mA h g−1, with a lower columbic efficiency of 59.6%. The galvanostatic studies show that MnO@N–C exhibits a higher reactivity than MnO. The cyclic performance of MnO@N–C and MnO at 0.2 A g−1 is shown in Fig. 6b. MnO@N–C exhibits favorable cyclic stability with a slow decreasing capacity in the first few cycles and a high reversible capacity of ∼640 mA h g−1 that is maintained following 400 cycles. In contrast, the reversible capacity of MnO rapidly decreases to ∼460 mA h g−1 within a few cycles, then increases to ∼600 mA h g−1 after 100 cycles, and quickly decreases to ∼300 mA h g−1 after 250 cycles, exhibiting poor cyclic performance.
image file: c4ra01285b-f6.tif
Fig. 6 (a) Discharge/charge curves for MnO@N–C and MnO. (b) Cyclic performance of MnO@N–C and MnO under a current density of 0.2 A g−1.

To evaluate the structural stability of the MnO@N–C, the cells after 3 and 400 cycles were disassembled and the electrodes were washed several times with dimethyl carbonate to remove the electrolyte. The morphology of MnO@N–C following 0, 3, and 400 cycles is shown in Fig. 7. The original Chinese lantern-like structure of MnO@N–C was maintained after 3 cycles (Fig. 7b). The edges of MnO@N–C were slightly thicker and smoother, indicative of the formation of a solid electrolyte interface (SEI) film on the surface. The Chinese lantern-like structure was also retained following 400 cycles (Fig. 7c). For comparison, the surface of MnO (Fig. S5) became more and more rough with the increasing cyclic number, which indicated that the structure of MnO was damaged during the repeated conversion reaction. These findings reveal that MnO@N–C possesses high structural stability during cycling, which is the primary reason for the observed high cyclic performance.


image file: c4ra01285b-f7.tif
Fig. 7 FESEM images of MnO@N–C after (a) 0 cycle, (b) 3 cycles, and (c) 400 cycles.

The rate performance of MnO@N–C and MnO was also examined by increasing the current density from 0.2 to 4 A g−1, as shown in Fig. 8. As observed, MnO@N–C shows excellent rate capability with average capacities of 758, 600, 496, 451, 370, and 285 mA h g−1 at the current density of 0.2, 0.4, 0.8, 1.0, 2.0 and 4 A g−1, respectively. Moreover, a stable capacity of ∼680 mA h g−1 can be maintained when the current density recovers to 0.2 A g−1. The results indicate that the Chinese lantern-like structure of MnO@N–C also remains stable even under high rates. In contrast, MnO shows poor rate capability with average capacities of 663, 469, 359, 331, 277, and 214 mA h g−1 at the current density of 0.2, 0.4, 0.8, 1.0, 2.0 and 4 A g−1, respectively.


image file: c4ra01285b-f8.tif
Fig. 8 Rate performance of MnO@N–C and MnO.

To establish the relationship between electrochemical performance and electrode kinetics for MnO@N–C and MnO, electrochemical impedance spectroscopy (EIS) was performed. Prior to the EIS tests, the cells were ran for 10 cycles at a current density of 0.2 A g−1 to obtain stable electrodes. The tests were then carried out at different voltage values during the discharge process. The voltage values were set at 3.0, 2.0, 1.5, 1.0, and 0.5 V, as shown in Fig. 9a–e. The resistance values were evaluated by the equivalent circuit (Fig. 9f) and listed in Table 1. In the equivalent circuit, Ro, Rs, Rct, and Zw represent the ohmic resistance of the cell, the SEI resistance, the charge-transfer resistance and Warburg diffusion impedance, respectively. The Ro values of the MnO@N–C and MnO electrodes were comparable (∼2.0–3.5 Ω) because of the same assembling process for the coin-cells. The MnO@N–C electrode exhibits a lower SEI resistance Rs (∼44–50 Ω) than the MnO electrode (∼57–65 Ω); this suggests that the N–C matrix may have reduced the undesirable growth of the SEI layer.34 Values of Rct at different voltages are a bit more complicated. For the MnO@N–C electrode, values of Rct at 3.0 and 2.0 V are not obtained, indicating very low reactivity for Li-reaction kinetics responding to barely capacity above 2.0 V in the discharge curve in Fig. 6a. Values of Rct at 1.5 and 1.0 V are mainly responded to the reaction between Li+ and N–C matrix. The decreased values of Rct as the decreased voltage indicates the increased reactivity for N–C matrix. However, the increased value of Rct at 0.5 V which is mainly responded to the reaction between Li+ and MnO within the N–C matrix indicates the lower reactivity for MnO compared with N–C matrix. For the MnO electrode, values of Rct at 3.0, 2.0 and 1.5 V are not obtained, responding to barely capacity above 1.5 V in the discharge curve in Fig. 6a. Rct decreases quickly as the voltage decreases from 1.0 V to 0.5 V, indicating the increased reactivity for MnO. The MnO@N–C electrode shows a lower Rct at 0.5 V than the MnO electrode, thereby indicating the improved Li-reaction kinetics for the MnO@N–C electrode.1 Therefore, the improved Li-reaction kinetics of the MnO@N–C electrode contributed to the significant improvement of the observed electrochemical performance.


image file: c4ra01285b-f9.tif
Fig. 9 Nyquist plots of the MnO@N–C and MnO electrodes at (a) 3.0, (b) 2.0, (c) 1.5, (d) 1.0, and (e) 0.5 V. (f) The equivalent circuit.
Table 1 Resistance values of the electrodes
Sample Voltage/V Ro RS Rct
MnO@N–C 3.0 2.1 49.6
2.0 2.8 44.0
1.5 2.9 49.2 31.8
1.0 3.0 45.4 26.0
0.5 3.5 46.2 44.9
MnO 3.0 1.7 62.8
2.0 1.8 64.7
1.5 2.0 63.7
1.0 2.3 57.7 489.1
0.5 3.0 69.1 103


In comparison with materials reported in the literature,14,16,19–25,35–37 the currently prepared MnO@N–C displays high specific capacity, cyclic stability, and rate capability that can be attributed to its unique Chinese lantern-like structure, as illustrated in Scheme 2. The homogeneously embedded MnO nanoparticles within the N–C matrix can realize a high electrochemical utilization of the materials for electrochemical conversion reaction to generate a high specific capacity. The N–C matrix and the voids between the nanoplates can limit strain and thus maintain the structural of the MnO@N–C electrode during the discharge/charge process, consequently enabling improved cyclic performance. The MnO@N–C nanoplates with high specific surface area in the Chinese lantern-like framework can shorten the path diffusing length of the lithium ions and the N–C matrix can provide efficient electrical integrity to the electrode, which can enhance the rate capability. Therefore, MnO@N–C exhibits excellent electrochemical performance.


image file: c4ra01285b-s2.tif
Scheme 2 Schematic illustration of the discharge/charge process of MnO@N–C.

Conclusion

A novel Chinese lantern-like MnO@N–C was fabricated by a facile and green strategy. The unique microstructure of MnO@N–C consists of numerous nanoplates, with a thickness of ∼35 nm, comprising MnO nanoparticles (∼15 nm) uniformly embedded within an N–C matrix. Owing to the unique Chinese lantern-like structure, MnO@N–C shows excellent electrochemical performance with a high reversible specific capacity, favorable cyclic stability, and excellent rate capability. The herein prepared Chinese lantern-like MnO@N–C is a promising high-performance anode material for LIBs.

Acknowledgements

This work was funded by the National Basic Research Program of China (Grant no. 2014CB932103), the National Natural Science Foundation of China (51272020, 21236003), the Excellent Ph.D. Thesis Fund of Beijing (YB20101001001) and the Research Fund for the Doctoral Program of Higher Education of China (20120010110013).

References

  1. Y. Sun, X. Hu, W. Luo, F. Xia and Y. Huang, Adv. Funct. Mater., 2013, 23, 2436–2444 CrossRef CAS.
  2. Y. Xia, Z. Xiao, X. Dou, H. Huang, X. Lu, R. Yan, Y. Gan, W. Zhu, J. Tu, W. Zhang and X. Tao, ACS Nano, 2013, 7, 7083–7092 CrossRef CAS PubMed.
  3. G. Zhou, D. Wang, F. Li, L. Zhang, N. Li, Z. Wu, L. Wen, G. Lu and H. Cheng, Chem. Mater., 2010, 22, 5306–5313 CrossRef CAS.
  4. W. Li, L. Xu and J. Chen, Adv. Funct. Mater., 2005, 15, 851–857 CrossRef CAS.
  5. B. Varghese, M. Reddy, Z. Yanwu, C. Lit, T. Hoong, G. Subba Rao, B. Chowdari, A. Wee, C. Lim and C. Sow, Chem. Mater., 2008, 20, 3360–3367 CrossRef CAS.
  6. J. Park, J. Kim, H. Kwon and H. Song, Adv. Mater., 2009, 21, 803–807 CrossRef CAS.
  7. J. Liu, Y. Li, R. Ding, J. Jiang, Y. Hu, X. Ji, Q. Chi, Z. Zhu and X. Huang, J. Phys. Chem. C, 2009, 113, 5336–5339 CAS.
  8. P. Poizot, S. Laruelle, S. Grugeon, L. Dupont and J. Tarascon, Nature, 2000, 407, 496–499 CrossRef CAS PubMed.
  9. G. Jeong, Y. Kim, H. Kim, Y. Kim and H. Sohn, Energy Environ. Sci., 2011, 4, 1986–2002 CAS.
  10. L. Ji, Z. Lin, M. Alcoutlabi and X. Zhang, Energy Environ. Sci., 2011, 4, 2682–2699 CAS.
  11. P. Poizot, S. Laruelle, S. Grugeon and J. Tarascon, J. Electrochem. Soc., 2002, 149, A1212–A1217 CrossRef CAS PubMed.
  12. K. Zhong, X. Xia, B. Zhang, H. Li, Z. Wang and L. Chen, J. Power Sources, 2010, 195, 3300–3308 CrossRef CAS PubMed.
  13. W. Chen, L. Qie, Y. Shen, Y. Sun, L. Yuan, X. Hu, W. Zhang and Y. Huang, Nano Energy, 2013, 2, 412–418 CrossRef CAS PubMed.
  14. X. Li, S. Xiong, J. Li, X. Liang, J. Wang, J. Bai and Y. Qian, Chem.–Eur. J., 2013, 19, 11310–11319 CrossRef CAS PubMed.
  15. K. Zhong, B. Zhang, S. Luo, W. Wen, H. Li, X. Huang and L. Chen, J. Power Sources, 2011, 196, 6802–6808 CrossRef CAS PubMed.
  16. X. Li, D. Li, L. Qiao, X. Wang, X. Sun, P. Wang and D. He, J. Mater. Chem., 2012, 22, 9189–9194 RSC.
  17. G. Xu, Y. Xu, J. Fang, F. Fu, H. Sun, L. Huang, S. Yang and S. Sun, ACS Appl. Mater. Interfaces, 2013, 5, 6316–6323 CAS.
  18. J. Liu and Q. Pan, Electrochem. Solid-State Lett., 2010, 13, A139–A142 CrossRef CAS PubMed.
  19. Y. Ding, C. Wu, H. Yu, J. Xie, G. Cao, T. Zhu, X. Zhao and Y. Zeng, Electrochim. Acta, 2011, 56, 5844–5848 CrossRef CAS PubMed.
  20. Y. Liu, X. Zhao, F. Li and D. Xia, Electrochim. Acta, 2011, 56, 6448–6452 CrossRef CAS PubMed.
  21. W. Luo, X. Hu, Y. Sun and Y. Huang, ACS Appl. Mater. Interfaces, 2013, 5, 1997–2003 CAS.
  22. L. Su, Y. Zhong, J. Wei and Z. Zhou, RSC Adv., 2013, 3, 9035–9041 RSC.
  23. Y. Mai, D. Zhang, Y. Qiao, C. Gu, X. Wang and J. Tu, J. Power Sources, 2012, 216, 201–207 CrossRef CAS PubMed.
  24. D. Qiu, L. Ma, M. Zheng, Z. Lin, B. Zhao, Z. Wen, Z. Hu, L. Pu and Y. Shi, Mater. Lett., 2012, 84, 9–12 CrossRef CAS PubMed.
  25. C. Hsieh, C. Lin and J. Lin, Electrochim. Acta, 2011, 56, 8861–8867 CrossRef CAS PubMed.
  26. J. Sun, H. Liu, X. Chen, D. Evans and W. Yang, Nanoscale, 2013, 5, 7564–7571 RSC.
  27. Y. Sha, B. Zhao, R. Ran, R. Cai and Z. Shao, J. Mater. Chem. A, 2013, 1, 13233–13243 CAS.
  28. F. Lu, Q. Wu, X. Yang, L. Chen, J. Cai, C. Liang, M. Wu and P. Shen, Phys. Chem. Chem. Phys., 2013, 15, 9768–9774 RSC.
  29. K. Zhang, P. Han, L. Gu, L. Zhang, Z. Liu, Q. Kong, C. Zhang, S. Dong, Z. Zhang, J. Yao, H. Xu, G. Cui and L. Chen, ACS Appl. Mater. Interfaces, 2012, 4, 658–664 CAS.
  30. C. Lei, F. Han, D. Li, W. Li, Q. Sun, X. Zhang and A. Lu, Nanoscale, 2013, 5, 1168–1175 RSC.
  31. H. Wang, C. Zhang, Z. Liu, L. Wang, P. Han, H. Xu, K. Zhang, S. Dong, J. Yao and G. Cui, J. Mater. Chem., 2011, 21, 5430–5434 RSC.
  32. Z. Wu, W. Ren, L. Xu, F. Li and H. Cheng, ACS Nano, 2011, 5, 5463–5471 CrossRef CAS PubMed.
  33. G. Zhang, H. Wu, H. Hoster and X. Lou, Energy Environ. Sci., 2014, 7, 302–305 CAS.
  34. S. Yang, S. Nam, T. Kim, J. Im, H. Jung, J. Kang, S. Wi, B. Park and C. Park, J. Am. Chem. Soc., 2013, 135, 7394–7397 CrossRef CAS PubMed.
  35. B. Sun, Z. Chen, H. Kim, H. Ahn and G. Wang, J. Power Sources, 2011, 196, 3346–3349 CrossRef CAS PubMed.
  36. C. Chae, H. Park, D. Kim, J. Kim, E. Oh and J. Lee, J. Power Sources, 2013, 244, 214–221 CrossRef CAS PubMed.
  37. H. Qiao, D. Yao, Y. Cai, F. Huang and Q. Wei, Ionics, 2013, 19, 595–600 CrossRef CAS.

Footnote

Electronic supplementary information (ESI) available. See DOI: 10.1039/c4ra01285b

This journal is © The Royal Society of Chemistry 2014
Click here to see how this site uses Cookies. View our privacy policy here.