 Open Access Article
 This Open Access Article is licensed under a Creative Commons Attribution-Non Commercial 3.0 Unported Licence
A successful DFT calculation of carbon-13 NMR chemical shifts and carbon–fluorine spin–spin coupling constants in (η6-fluoroarene)tricarbonylchromium complexes†
Adam Gryff-Keller* and
Przemysław Szczeciński
Department of Chemistry, Warsaw University of Technology, Noakowskiego 3, 00-664 Warszawa, Poland. E-mail: agryff@ch.pw.edu.pl
First published on 12th June 2014
Abstract
Carbon-13 isotropic shielding constants and carbon–fluorine spin–spin coupling constants for fluorobenzene (1), 3-dimethylaminofluorobenzene (2) and 4-dimethylaminofluorobenzene (3) as well as for their tricarbonylchromium complexes (3–6) have been calculated using DFT method with B3LYP and/or BHandH functionals and 6-311++G(2d,p) basis set. In the case of the complexes, the calculations have been performed for two expected orientations of the tricarbonylchromium tripod with respect to the benzene ring. It has been found that, when using B3LYP functional, the experimental 13C NMR chemical shifts for all the investigated compounds can be well reproduced, provided that for the complexes the populations of conformers are adjusted during the experiment/theory correlation. The population parameters determined this way follow perfectly the expectations based on the literature knowledge of the effects of the benzene ring substituents. The calculations with BHandH functional have not been able to reproduce the 13C NMR chemical shifts of carbonyl carbons in tricarbonylchromium complexes. On the other hand, BHandH is a functional of choice in calculations of carbon–fluorine spin–spin coupling constants. All such constants, including the through-space coupling constants between the carbonyl carbons and fluorine, have been reproduced very well. This last coupling constant has been calculated for various relative orientations of carbonyl and C–F bond and a strong angular dependence of this constant has been found.
Introduction
For a long time the chemical properties and stereochemistry of (η6-arene)tricarbonylchromium complexes have attracted the interest of many groups of investigators.1 Formation of tricarbonylchromium complex substantially modifies the electronic structure of the arene unit and changes its chemical behavior. The electron-withdrawing effect of the Cr(CO)3 unit enables efficient nucleophilic attack on the arene ring allowing dearomatization reactions, activates halogen substituents for cross-coupling reactions and stabilizes negative charges in benzylic positions.1,2 Moreover, properly substituted aromatic compounds form chiral complexes which can be used as intermediates, auxiliary compounds or catalysts in asymmetric synthesis.2 Apart from the various synthetic applications of tricarbonylchromium arene complexes, several articles report the results of investigations of intramolecular interring haptotropic rearrangements of these compounds.3–6Susceptibility of these complexes to the various reactions and rearrangements is tightly connected with the orientation of the tricarbonylchromium tripod with respect to the aromatic ligand.1,2,7,8 In the solid state this conformation can be established by crystallographic methods. In liquids the problem is more severe, although a detailed interpretation of 1H NMR, 13C NMR or 19F NMR spectra can provide information allowing a preferred conformation to be recognized.1,2,9–11 High sensitivity of NMR parameters to complexation and complex conformation is not a surprise, taking into account the huge impact of the tricarbonylchromium moiety on the electronic structure of the aromatic ligand. The large up-field shift of the 13C NMR signals of the aromatic carbons upon complexation was discovered ca. 50 years ago.12 Also the dependence of carbon–fluorine spin–spin coupling constants on the complex stereochemistry has been known for a long time.13,14
The indirect spin–spin coupling constants, in general, are very useful parameters in investigations of structure and stereochemistry of organic molecules. It is caused by the fact that these constants depend on the number of bonds separating the coupled nuclei, their geometrical arrangement in the molecule and the electron properties of the substituents attached to the atoms on the coupling path.15 Usually, the information about spin states is transmitted between coupled nuclei by the bond electrons. In some sterically crowded molecules, however, this transmission may be accomplished also ‘through space’ by non-bonding orbitals. In this case the coupling constant value is closely related to the spatial distance between the interacting nuclei, which, in convenient circumstances, may be a valuable hint in solving stereochemical problems.16,17 It is known that the coupling of this type is especially effective when a fluorine nucleus is involved in the ‘through-space’ interaction. Among others, it is believed that such a mechanism is responsible for the stereoselective coupling between carbonyl carbons and fluorine substituents in (η6-fluoroarene)tricarbonylchromium complexes.17–19
Nowadays, the theoretical quantum chemical calculations are very helpful in solving conformational problems. Also in the case of (η6-arene)tricarbonylchromium complexes DFT calculations have proven their effectiveness, e.g. in investigations of haptotropic rearrangements.3–6 On the other hand, to the best of our knowledge, the calculations of NMR parameters for (η6-fluoroarene)tricarbonylchromium complexes have not been attempted yet. The DFT calculations for fluorocompounds have a reputation of being a challenging case, demanding usage of large basis sets and, consequently, long computing times.20 Presumably, that opinion resulted in a limited interest in theoretical approaches to interpretation of NMR data for these compounds. Recently, however, Tormena et al.21 have shown that application of BHandH functional and sufficiently large basis set allows fluorine–carbon spin–spin coupling to be calculated for fluoroaromatic compounds with a reasonable accuracy. That finding prompted us to apply their calculational method to compounds investigated experimentally in our laboratory in the past.13
Results and discussion
13C NMR chemical shifts
The calculations whose results are reported in this work have been performed for three fluoroaromatic ligands: fluorobenzene (1), 3-fluoro-N,N-dimethylaniline (2) and 4-fluoro-N,N-dimethylaniline (3) and their tricarbonylchromium complexes (4–6). The structures of these compounds and labelling of their carbon atoms, convenient for the further discussion, although different from the conventional chemical labelling, are given beneath.
These complexes were synthesized and investigated experimentally in our laboratory in the past and their NMR spectra were interpreted using traditional methods.13 The general knowledge on substituent effects in aromatic compounds and in their tricarbonylchromium complexes allows one to expect that these objects are quite different as far as the electron distribution in aromatic rings is concerned. Also the orientation of the Cr(CO)3 tripod with respect to C–F bond in complexes 4, 5 and 6 (complex conformation) should be different. This variety is reflected well in their NMR spectra.
It is well known that for substituted benzene derivatives 13C NMR chemical shifts can be reproduced accurately by various DFT methods, especially when the scaling procedure is used.22 The results of our calculations performed for free ligands 1–3 are in full agreement with these observations. The deviations from the regression line representing correlation of the experimental 13C NMR chemical shifts and isotropic shielding constants calculated theoretically using DFT/B3LYP/6-311++G(2d,p) method are illustrated in Fig. 1. It can be seen that these deviations are rather small even for fluorinated carbons. Taking the root-mean-squares deviation (RMSD) for a given experiment/theory correlation as a criterion we have found out that in the case of free ligands the PBE1PBE functional has yielded the best results, although all three functionals used work very well (Table 1), provided that during geometry optimization and shielding calculation the same functional is used.
 | ||
| Fig. 1 Deviations from the regression lines representing correlations of the experimental 13C NMR chemical shifts and isotropic shielding constants calculated theoretically using DFT/B3LYP/6-311++G(2d,p) method, for free ligands (1–3), for their tricarbonylchromium complexes (4–6), and for all the investigated compounds (1–6). | ||
| Methoda | Slope | Interceptb | RMSDb | Max. dev.bc |
|---|---|---|---|---|
| a The specified method concerns calculation of NMR parameters whereas during the molecular geometry optimization the 6-311++G(2d,p) basis set was used in each case.b In ppm.c The maximum deviation of an experimental point from the regression line. | ||||
| B3LYP/6-311++G(2d,p) | −0.937(10) | 186.5(1.4) | 1.43 | 2.62 |
| B3LYP/6-311++G(3df,3pd) | −0.941(10) | 185.1(1.4) | 1.48 | 3.0 |
| B3LYP/6-311++G(2d,p)/PCM | −0.934(8) | 186.9(1.2) | 1.21 | 2.41 |
| B3LYP/6-311++G(3df,3pd/PCM | −0.938(8) | 185.5(1.2) | 1.25 | 2.79 |
| PBE1PBE/6-311++G(2d,p) | −0.958(9) | 190.4(1.2) | 1.30 | 2.36 |
| PBE1PBE/6-311++G(3df,3pd) | −0.961(9) | 188.9(1.2) | 1.27 | 2.37 |
| PBE1PBE/6-311++G(2d,p)/PCM | −0.955(7) | 190.8(9) | 1.01 | 1.87 |
| PBE1PBE/6-311++G(3df,3pd)/PCM | −0.958(7) | 189.3(9) | 0.96 | 2.13 |
| BHandH/6-311++G(2d,p) | −0.934(9) | 193.7(1.3) | 1.31 | −2.63 |
| BHandH/6-311++G(3df,3pd) | −0.936(9) | 192.5(1.2) | 1.26 | −3.1 |
| BHandH/6-311++G(2d,p)/PCM | −0.931(9) | 194.1(1.3) | 1.32 | −2.85 |
| BHandH/6-311++G(3df,3pd)/PCM | −0.932(8) | 192.9(1.2) | 1.26 | −3.30 |
Examining the results collected in Table 1 one can additionally notice some differences between various calculational methods. Namely, in the case of calculations with PBE1 and BHandH functionals, enlargement of the basis set from 6-311++G(2d,p) to 6-311++G(3df,3pd), at the step of NMR parameters calculation, has a positive effect (cf. RMSD column of Table 1). Moreover, inclusion of the solvent effects into calculations, by means of the polarizable continuum model (PCM), has improved the results for B3LYP and PBE1PBE, but not for BHandH functional. However, these effects are not large and are gained at an expense of the remarkable elongation of the computation time, which also has to be taken into account.
Formation of an (η6-arene)tricarbonylchromium complex drastically modifies electron distribution within the ligand, which substantially changes its chemical properties.2 At the same time, in the 13C NMR spectrum of the ligand, remarkable changes are observed: the carbon signals of the complexed ring usually move to the spectral region typical for oxygen bonded aliphatic carbons (Table 2).
There is, however, the second factor which makes attempts at theoretical calculation of the 13C NMR chemical shifts for this class of compounds difficult, namely, the (η6-arene)tricarbonylchromium complexes usually exist in solution as an equilibrium mixture of conformers.1,2 The composition of this equilibrium depends, first of all, on the π-electron distribution in the arene ring, which is governed by the ring substituents. More or less intuitive and qualitative interpretations of 1H NMR and 13C NMR spectra have led the investigators in the seventies and eighties of the past century to the conclusion that in an energetically preferred conformation the tricarbonylchromium tripod eclipses carbon atoms bearing π-electron donating substituent. Thus, in the case of a benzene ring substituted with one substituent the chromium-bound carbonyls eclipse preferentially the ipso and meta carbons, while the second conformer, in which the carbonyls are closer to ortho and para carbons, is less abundant.1,2 However, quantitative information about populations of these conformers is usually unavailable. Thus, in order to predict carbon chemical shifts for the molecules considered, not only do the shielding constants for both conformers have to be calculated, but also the population parameter has to be adjusted during the fitting procedure. Finally, it is not clear whether the chemical shifts of chromium-bonded carbons can be properly predicted without including relativistic effects into the theoretical model.
The molecular geometry optimizations for complexes 4, 5 and 6 have yielded the expected results,13 which are independent of the functional used in the calculation. Namely, in the case of 4 and 5 the conformer with the carbonyl close to the fluorine substituent is preferred, whereas for 6 the other conformer eclipsing –N(CH3)2, a stronger electron donor, prevails. Moreover, in the case of 5, where F and –N(CH3)2 substituents cooperate, the alternative arrangement of the tricarbonylchromium tripod does not seem to represent a minimum energy conformation. Essentially, interpretation of the calculated energy differences in terms of Boltzman distribution and conformer populations should be possible.23 On the other hand, we realize that the level of theory used in our calculations is rather moderate and quantitative results of such an approach could be uncertain. That is why we decided to treat the conformer populations as additional adjustable parameters and to determine them from the experimental NMR data (see Experimental).
The results of analysis of 13C NMR chemical shifts for the investigated compounds collected in Table 3 and Fig. 1 show that a relatively simple calculational procedure, DFT B3LYP/6-311++G(2d,p), can successfully reproduce experimental data despite all the above obstacles. Additionally, examination of the results in Table 3 shows that the BHandH functional is unable to reproduce the chemical shifts of the carbonyl carbons (see row 2 of Table 3). One may also admit that the experimental data set composed of the 13C NMR chemical shifts of all the compounds is reproduced sufficiently well by the theoretical data (Fig. 1), however, in such correlation the mean deviation from the regression line is somewhat higher than in separate correlations of the data for each subset. Apparently, the series of very different compounds investigated in this work, free ligands and their complexes, do exhibit their specificity in the course of experiment/theory correlation. As it concerns the determined population parameters (Table 3), their values are independent of the method of data analysis and, which is more important, they agree very well with the general knowledge in the area as well as with our molecular geometry calculations. Small, though finite apparent population of alternative conformer of 5, which probably does not exist, may reflect librational motion of the Cr(CO)3 moiety, which is neglected in the above analysis.
| Compounds | Methoda | p4 | p5 | p6 | Slope | Intercept | RMSD |
|---|---|---|---|---|---|---|---|
| a In all cases the 6-311++G(2d,p) basis set was used.b Without chemical shifts of carbonyl groups. | |||||||
| 4–6 | B3LYP | 0.78(4) | 0.93(4) | 0.33(5) | −0.932(4) | 184.2(7) | 1.02 |
| 4–6 | BHandH | 0.91(16) | 1.18(16) | 0.31(17) | −0.860(14) | 204.1(2.5) | 3.42 |
| 4–6b | B3LYP | 0.78(5) | 0.92(5) | 0.33(5) | −0.935(12) | 183.9(1.4) | 1.10 |
| 4–6b | BHandH | 0.76(4) | 0.87(5) | 0.34(4) | −0.978(10) | 191.0(1.1) | 0.97 |
| 1–6 | B3LYP | 0.79(7) | 0.94(7) | 0.33(8) | −0.932(7) | 185.6(10) | 1.86 |
| 1–6b | BHandH | 0.80(7) | 0.95(7) | 0.34(7) | −0.939(9) | 194.1(1.2) | 1.71 |
Carbon–fluorine spin–spin coupling constants
Following the recent finding by Tormena et al.21 of unprecedented effectiveness of DFT calculations with BHandH functional we have applied this method to calculate 13C–19F indirect spin–spin coupling constants in compounds 1–6. The BHandH (half of the HF exchange with half of the uniform electron gas exchange) is a hybrid functional which includes larger contribution of the exact Hartree–Fock exchange than the B3LYP functional. This modification leads, at least in some cases, to an improvement of the results of calculations of spin–spin coupling constants for spin pairs involving lone-pair-bearing atoms. The calculations performed for fluorobenzene have confirmed the prevalence of this functional over two other popular functionals, B3LYP and PBE1PBE (Table 4). It is interesting that already for the moderate basis set, 6-311++G(2d,p), the theoretical results obtained for all four 13C–19F coupling constants and BHandH functional are very good. Enlargement of the basis improves these results (also for two other functionals), but, obviously, at an expense of much longer computation time. The inclusion of the solvent effects into calculation by the polarizable continuum model results in slight modification of calculated values of the spin–spin coupling constants. However, taking into account that the data being compared have not been corrected for vibrations and that differences between experimental and theoretical values are generally small, it is difficult to judge if PCM improves theoretical results or not.| Methoda | 1J | 2J | 3J | 4J |
|---|---|---|---|---|
| a Functionals: B – B3LYP, P – PBE1PBE, A – BhandH; basis sets: b1 – 6-311++G(2d,p), b2 – 6-311++G(3df,3pd), b3 – aug-cc-TZP-J; PCM – polarizable continuum model of solvent.b Absolute values measured at 25 °C in CDCl3 solution. | ||||
| Fluorobenzene (1) | ||||
| Experimentalb | ||||
| 245.7 | 21.0 | 7.7 | 3.2 | |
| Calculated | ||||
| B b1 | −306.6 | 13.7 | 4.6 | 4.2 |
| B b2 | −297.1 | 15.9 | 5.0 | 4.3 |
| B b3 | −320.2 | 19.6 | 6.1 | 4.7 |
| P b1 | −302.1 | 15.9 | 3.8 | 5.2 |
| P b2 | −291.6 | 18.1 | 4.2 | 5.3 |
| A b1 | −254.1 | 21.9 | 4.2 | 5.8 |
| A b1 PCM | −250.6 | 22.0 | 4.5 | 5.5 |
| A b2 | −242.2 | 24.0 | 4.8 | 5.7 |
| A b2 PCM | −239.1 | 24.1 | 5.0 | 5.4 |
| 3-(Dimethylamino)-1-fluorobenzene (2) | ||||
| Experimentalb | ||||
| 241.7 | 25.9C2, 21.6C6 | 10.7C3, 10.4C5 | 2.2 | |
| Calculated | ||||
| A b1 | −250.6 | 27.0C2, 22.3C6 | 7.9C3, 7.1C5 | 4.2 |
| A b1 PCM | −246.6 | 27.2C2, 22.3C6 | 8.4C3, 7.5C5 | 3.9 |
| A b2 | −240.3 | 29.4C2, 24.4C6 | 8.1C3, 7.6C5 | 4.1 |
| A b2 PCM | −236.6 | 29.5C2, 24.5C6 | 8.7C3, 7.9C5 | 3.8 |
| 4-(Dimethylamino)-1-fluorobenzene (3) | ||||
| Experimentalb | ||||
| 235.0 | 22.8 | 7.3 | 1.8 | |
| Calculated | ||||
| A b1 | −241.4 | 22.9 | 3.4 | 3.60 |
| A b1 PCM | −236.6 | 22.9 | 3.8 | 3.9 |
| A b2 | −230.2 | 24.9 | 3.9 | 3.6 |
| A b2 PCM | −225.8 | 24.9 | 4.2 | 3.2 |
Similar calculations for tricarbonylchromium complexes 4, 5 and 6 have been performed using the simplest of the effective methods, namely, DFT/BHandH/6-311++G(2d,p). It has been mentioned above that in order to reproduce theoretically the NMR parameter values, the conformational equilibrium must be taken into account. Moreover, in the case of carbonyl carbons, the averaging by the rapid internal rotation has to be included. Thus, the carbon–fluorine coupling constants have been calculated for each complex for two conformers, i.e. one in which Cr–CO and C–F bonds are eclipsed and one in which they are twisted by 60°. Moreover, in each case the population-weighted coupling constants have been calculated (Table 5) using population parameters determined in the course of the analysis of the chemical shifts. Taking into account the chemical nature of the investigated objects, conformational equilibriums and neglect of the vibrational effects we must say that the experiment/theory agreement is better than expected.
| J | F–C1 | F–C2 | F–C3 | F–C4 | F–C5 | F–C6 | F–CO |
|---|---|---|---|---|---|---|---|
| Fluorobenzene-Cr(CO)3 (4) | |||||||
| Exp. | 266.3 | 19.8 | 7.4 | 0.0 | 7.4 | 19.8 | 2.1 |
| e | −260.5 | 20.6 | 5.9 | 0.6 | 5.9 | 20.6 | 2.8 |
| s | −255.8 | 19.8 | 3.8 | 0.4 | 3.8 | 19.8 | −1.1 |
| 0.78e + 0.22s | −259.5 | 20.4 | 5.5 | 0.6 | 5.5 | 20.4 | 1.9 |
| 3-(Dimethylamino)-1-fluorobenzene-Cr(CO)3 (5) | |||||||
| Exp. | 262.5 | 23.2 | 8.4 | 0.0 | 8.1 | 20.2 | 2.8 |
| e | −257.1 | 24.1 | 7.8 | 0.2 | 5.8 | 21.1 | 2.9 |
| s | −254.4 | 24.6 | 6.1 | 0.2 | 3.9 | 19.9 | −0.9 |
| 0.93e + 0.07s | −256.9 | 24.1 | 7.7 | 0.2 | 5.7 | 21.0 | 2.6 |
| 4-(Dimethylamino)-1-fluorobenzene-Cr(CO)3 (6) | |||||||
| Exp. | 258.9 | 21.1 | 6.5 | 0.0 | 6.5 | 21.1 | 0.7 |
| e | −256.6 | 21.6 | 5.9 | 0.7 | 5.9 | 21.6 | 2.8 |
| s | −250.8 | 20.9 | 3.9 | −0.5 | 3.9 | 20.9 | −1.0 |
| 0.33e + 0.67s | −252.7 | 21.1 | 4.6 | −0.1 | 4.6 | 21.1 | 0.3 |
Especially interesting is the good reproduction of the experimental values of the small ‘through-space’ coupling constants and their dependence on the conformation of the complex (Table 5). These findings confirm reliability of DFT calculations of the coupling constants of that type. Thus, it seems worthwhile to reproduce here graphically the calculated angular dependence of the 19F–13CO coupling (Fig. 2). The plot has been constructed on the basis of the data calculated for complex 4 (Table 6), although for two remaining compounds these relationships are similar. Table 6 contains the data on contributions of all four mechanisms to that coupling. Inspection of these data shows that the coupling is highly dominated by the Fermi contact mechanism. The contributions of other mechanisms also seem to be angular-dependent, but are generally small and largely compensate one another. Their common impact on the overall coupling constant does not exceed 0.5 Hz and so is unimportant.
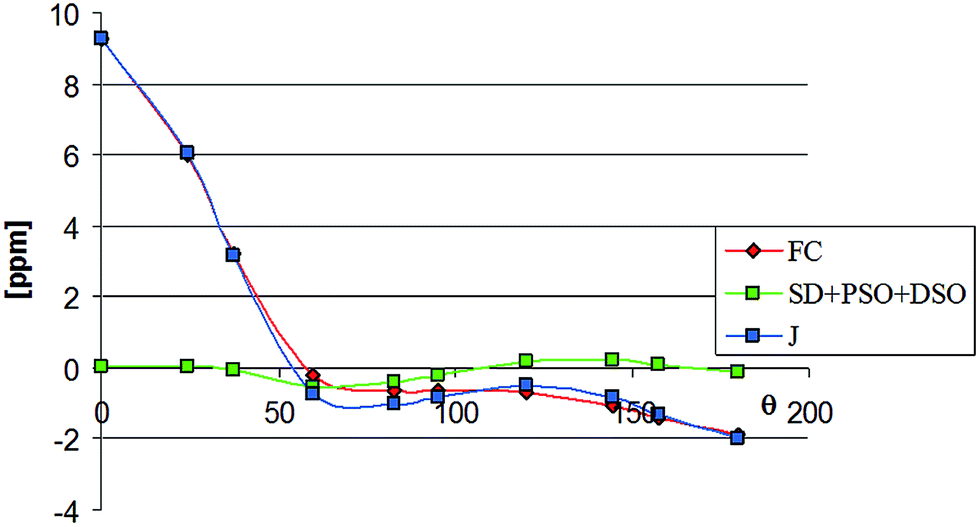 | ||
| Fig. 2 Visualization of the data from Table 6. | ||
| θ | FC | SD + PSO + DSO | J |
|---|---|---|---|
| 0 | 9.26 | 0.04 | 9.30 |
| 24.6 | 6.01 | 0.03 | 6.05 |
| 37.4 | 3.23 | −0.06 | 3.17 |
| 60 | −0.21 | −0.52 | −0.73 |
| 82.6 | −0.61 | −0.41 | −1.02 |
| 95.4 | −0.61 | −0.19 | −0.81 |
| 120 | −0.69 | 0.18 | −0.50 |
| 144.6 | −1.05 | 0.22 | −0.83 |
| 157.4 | −1.38 | 0.08 | −1.30 |
| 180 | −1.87 | −0.11 | −1.98 |
Experimental
The carbon-13 NMR chemical shifts as well as carbon–fluorine coupling constants for compounds 1 and 3,24 2 (ref. 25) and 4–6,13 analyzed in this work, were measured for CDCl3 solutions and reported elsewhere.The theoretical calculations for all the investigated objects were accomplished using the Gaussian 03 program.26 DFT calculations using the BHandH27 functional were performed because of its high effectiveness in predicting values for carbon–fluorine spin–spin coupling constants.21 The calculations with the use of two other hybrid functionals, B3LYP28 and PBE1PBE (also known as PBE0),29 which are popular in the magnetic shielding calculations, were also performed for the sake of comparison. The molecular geometry optimizations were started from realistic structures using the 6-31* basis set. Final optimizations were then performed using 6-311++G(2d,p) basis set. The alternative conformations of complexes were generated from the initially optimized structures by imposing appropriate constraints (the “modredundant” keyword in the Gaussian software) and performing conditional re-optimization. Then the constraints were removed and the structure was allowed to relax to the new energy minimum. The atomic coordinates found for the minimum energy conformers of the investigated complexes are available in the ESI.† The NMR parameters were calculated using the same method as that used during the final geometry optimization. Additionally, some calculations of NMR parameters were performed with the use of larger basis sets such as 6-311++G(3df,3pd) or aug-cc-pVTZ-J. We have found it important to use the same functional at both calculation steps. Some calculations included the impact of solvent at both calculation stages, using the polarizable continuum model (PCM) of Tomasi et al.30 and defining the cavity according to the UAKS scheme.31
The experimental chemical shifts, δc,i, were correlated with theoretically calculated isotropic shielding constants, σc,i,j, assuming the relationship:
| δc,i = a[pcσc,i,1 + (1 − pc)σc,i,2 − b] |
Conclusions
We have shown that properly selected DFT-based calculational methods are able to reproduce quite well the experimental 13C NMR parameters for fluoroarenes as well as for their tricarbonylchromium complexes. In the case of 13C NMR chemical shifts a good choice is the DFT/B3LYP/6-311++G(2d,p) calculation method while for 13C–19F indirect spin–spin coupling constants the DFT/BHandH/6-311++G(2d,p) method yields much better results. The analysis of 13C chemical shifts with the use of calculated shielding constants can provide the conformer populations. Moreover, thanks to theoretical calculations, a better exploitation of the experimental values of the spin–spin coupling constants between 13C and 19F nuclei is possible. Thus, it seems that a theoretical approach based on relatively simple quantum chemical calculations, opens new possibilities for investigations of stereochemistry of this intriguing and important class of compounds.Acknowledgements
This work was financially supported by Warsaw University of Technology.References
- A. Solladie-Cavallo, Polyhedron, 1985, 4, 901 CrossRef CAS.
- M. Rosillo, G. Dominguez and J. Perez-Castells, Chem. Soc. Rev., 2007, 36, 1589 RSC.
- J. O. C. Jimenez-Halla, J. Robles and M. Sola, J. Phys. Chem. A, 2008, 112, 1202 CrossRef CAS PubMed.
- Y. F. Oprunenko and I. P. Gloriozov, J. Organomet. Chem., 2009, 694, 1195 CrossRef CAS PubMed.
- C. J. Czerwinski, I. A. Guzei, K. M. Riggle, J. R. Schroeder and L. C. Spencer, Dalton Trans., 2011, 40, 9439 RSC.
- C. J. Czerwinski, E. O. Fetisov, I. P. Gloriozov and Y. F. Oprunenko, Dalton Trans., 2013, 42, 10487 RSC.
- S. Chamberlin, N. Majumdar, W. D. Wulff, J. V. Muntean, R. L. Ostrander and A. L. Rheingold, Inorg. Chim. Acta, 2010, 364, 205 CrossRef CAS PubMed.
- H. Paramahamsan, A. J. Pearson, A. A. Pinkerton and E. A. Zhurova, Organometallics, 2008, 27, 900 CrossRef CAS.
- W. R. Jackson, C. F. Pincombe, I. D. Rae and S. Thapebinkarn, Aust. J. Chem., 1975, 28, 1535 CrossRef CAS.
- B. P. Roques, C. Segard, S. Combrisson and F. Wehrli, J. Organomet. Chem., 1974, 73, 327 CrossRef CAS.
- A. Solladie-Cavallo and J. Suffert, Org. Magn. Reson., 1980, 14, 426 CrossRef CAS.
- (a) B. E. Mann, J. Chem. Soc., Chem. Commun., 1971, 976 RSC; (b) L. F. Farnel, E. W. Randal and E. Rosemberg, J. Chem. Soc., Chem. Commun., 1971, 1078 RSC; (c) B. E. Mann, J. Chem. Soc., Dalton Trans., 1973, 2012 RSC.
- P. Szczeciński, J. Organomet. Chem., 1992, 423, 23 CrossRef.
- P. Szczeciński, J. Organomet. Chem., 1990, 393, 111 CrossRef.
- R. H. Contreras and J. E. Peralta, Prog. Nucl. Magn. Reson. Spectrosc., 2000, 37, 321 CrossRef CAS.
- L. C. Hsee and D. J. Sardella, Magn. Reson. Chem., 1990, 28, 688 CrossRef CAS , and refs. cited therein.
- (a) P. Szczeciński and K. Wiśniewski, J. Organomet. Chem., 1992, 423, C13 CrossRef; (b) P. Szczeciński and J. Zachara, J. Organomet. Chem., 1993, 447, 421 CrossRef.
- P. Szczeciński, J. Organomet. Chem., 1993, 457, 119 CrossRef.
- P. Szczeciński and A. Gryff-Keller, Magn. Reson. Chem., 1988, 26, 990 CrossRef.
- (a) J. Vaara, J. Kaski and J. Jokisaari, J. Phys. Chem. A, 1999, 103, 5675 CrossRef CAS; (b) V. Barone, J. E. Peralta, R. H. Contreras and J. P. Snyder, J. Phys. Chem. A, 2002, 106, 5607 CrossRef CAS; (c) I. Alkorta, F. Blanco, J. E. Del Bene, J. Elguero, L. Hernandez-Folgado and M. L. Jimeno, Magn. Reson. Chem., 2010, 48, 68 CrossRef CAS PubMed.
- J. D. Vilcachagua, L. C. Ducati, R. Rittner, R. H. Contreras and C. F. Tormena, J. Phys. Chem. A, 2011, 115, 1272 CrossRef CAS PubMed.
- A. Gryff-Keller, Concepts Magn. Reson., Part A, 2011, 38, 289 Search PubMed.
- (a) G. Barone, L. Gomez-Paloma, D. Duca, A. Silvestri, R. Riccio and G. Bifulco, Chem.–Eur. J., 2002, 8, 3233 CrossRef CAS; (b) G. Barone, D. Duca, A. Silvestri, L. Gomez-Paloma, R. Riccio and G. Bifulco, Chem.–Eur. J., 2002, 8, 3240 CrossRef CAS; (c) P. Tähtinen, A. Bagno, K. D. Klika and K. Pihlaja, J. Am. Chem. Soc., 2003, 125, 4609 CrossRef PubMed; (d) J. Mäki, P. Tähtinen, L. Kronberg and K. D. Klika, J. Phys. Org. Chem., 2005, 18, 240 CrossRef.
- National Institute of Advanced Industrial Science and Technology, August 2013, http://sdbs.riodb.aist.go.jp.
- D. A. Watson, Science, 2009, 325, 1661 CrossRef CAS PubMed.
- M. J. Frisch, G. W. Trucks, H. B. Schlegel, G. E. Scuseria, M. A. Robb, J. R. Cheeseman, J. A. Montgomery Jr, T. Vreven, K. N. Kudin and J. C. Burant, et al., Gaussian 03, Gaussian, Inc., Wallingford CT, 2004 Search PubMed.
- (a) A. Frish, M. J. Frish and G. W. Trucks. Gaussian 03 User's Reference, Gaussian, Inc., 2003 Search PubMed; (b) cf. also: A. D. Becke, J. Chem. Phys., 1993, 98, 1372 CrossRef CAS PubMed.
- A. D. Becke, J. Chem. Phys., 1993, 98, 5648 CrossRef CAS PubMed.
- C. Adamo and V. Barone, J. Chem. Phys., 1999, 110, 6158 CrossRef CAS PubMed.
- J. Tomasi, B. Mennucci and R. Cammi, Chem. Rev., 2005, 105, 2999 CrossRef CAS PubMed.
- The GNU Compiler Collection, GNU Fortran website, http://gcc.gnu.org/fortran/@.
Footnote |
| † Electronic supplementary information (ESI) available: Optimized molecular geometries of the minimum energy conformers of the investigated arenetricarbonylchromium complexes 4–6. See DOI: 10.1039/c4ra01249f |
| This journal is © The Royal Society of Chemistry 2014 |