DOI:
10.1039/C4RA01044B
(Paper)
RSC Adv., 2014,
4, 14048-14054
Designed hierarchical MnO2 microspheres assembled from nanofilms for removal of heavy metal ions
Received
6th February 2014
, Accepted 4th March 2014
First published on 5th March 2014
Abstract
Hierarchical MnO2 microspheres assembled from nanofilms are fabricated through an environmental route and subsequent drying under vacuum. Adsorption kinetics and thermodynamics are investigated in detail. The unique nanofilm assembly structure with high BET surface area of 252.82 m2 g−1 can allow for higher exposure of adsorption sites to adsorbate molecules than a solid one, and thus results in the high removal efficiency of heavy metal ions. The final removal efficiency of Pb(II), Cd(II), Cu(II) and Cr(VI) from acid aqueous solutions can reach 100%, 99.6%, 99.1% and 95.2%, respectively. Moreover, the relatively large submicrometer particles are easy to recover after adsorption. Therefore, it may serve as an ideal candidate for heavy metal ion removal in water treatment.
Introduction
Heavy metal ions, unlike organic contaminants, have become an ecotoxicological hazard of prime interest and increasing significance because once emitted they can reside in the environment for hundreds of years or more and tend to accumulate in living organisms.1–3 Among the known heavy metals, lead is an industrial pollutant, and contamination of water resources by lead is one of the most serious problems for public health and the environment. The major sources are from a variety of industrial wastes, such as electroplating, manufacturing of batteries, pigments and ammunition. Human exposure to lead can occur via food, air, soil and dust,4,5 and lead is linked to reproductive and nervous system problems, high blood pressure, kidney damage, memory and concentration difficulties in high amounts, coma, convulsions and death. Therefore, this element must be removed from wastewater prior to discharge. The normal techniques for heavy metals removal from water effluents are: ion exchange, coagulation–precipitation, electro-dialysis, filtration, electro-chemical precipitation, reverse osmosis, evaporation, chemical precipitation and adsorption.6,7 The major drawbacks with these processes are high cost, toxic sludge generation or incomplete metal removal.8–10
Most recently, manganese oxides have attracted great interest and been demonstrated adsorption and catalytic properties suitable for using in environmental remediation,11 catalysis,12 sensors,13 and energy storage14 due to the existence of unique layers or tunnels in crystal lattices, low cost, high activity/stability, high specific surface areas, and environmental compatibility.15–20 Many efforts have been focused on synthetic procedures for manganese oxides including laser ablation, sonochemical methods, hydrothermal methods and synthesis using polyelectrolytes. In the past decades, for the sorption by manganese dioxide of cationic or anionic pollutants, such as heavy metal ions, organic contaminants like substituted phenols, dyes, aromatic amines, explosives and pesticides21,22 from natural waters has attracted considerable attention, because it would significantly mediate the fate and mobility of the targeted pollutants in water.23 For example, Chen and co-workers24 synthesised porous MnO2 microspheres for the adsorption of methyl blue. Especially, Kanungo et al.25 found that some toxic metals (Co(II), Ni(II), Cu(II), and Zn(II) ions) can be effectively trapped by manganese dioxide through electrostatic forces and formation of inner-sphere complexes, which rendered it a potential sorbent for heavy metal removal from contaminated waters. Pan and co-workers26 used hydrous manganese dioxide as a potential sorbent for selective removal of lead, cadmium, and zinc ions from water. Kim and co-workers27 prepared hierarchical MnO2-coated magnetic nanocomposite with good performance for removing heavy metal ions from contaminated water systems. These results prompt us to carry out the corresponding work on removal of heavy metal ions from wastewater.
Furthermore, controlling crystal phase, particle size, crystallinity, morphology of manganese oxides have been proved to be an efficient and innovating solution to environmental problems.28–33 Nanosized manganese oxides are one of the most reactive minerals that have high surface area, strong oxidizing/adsorptive abilities, and good stability under acidic conditions.26,27,33 Especially, the thin film structures at the nano scale are attracting fast growing interest because they can be used to find new applications owing to their specific geometry and structural flexibility.34–38 Up to now, the common synthetic strategy for the fabrication of those structures with complex interiors employs sacrificial templates, such as polymer, silica, carbon inorganic spheres and ionic liquids. However, templating methods for constructing complex nanostructures are usually time consuming and costly because of the need for the synthesis of the templates and the multi-step templating process, and thus it is highly desirable to develop facile, scalable approaches for the rational synthesis of those structures with designed interior structures. Therefore, a general approach of rationally fabricating microspheres assembled by nanofilms for removal of heavy metal ions is still lacking and it is desirable to obtain these materials through more facile, economic and environment-friendly process. Besides, an advantage for chemists is to elaborate possible new constructions from all chemical components without any time-restricted conditions.
Herein, we chose MnO2 to demonstrate our concept and propose a facile generic strategy to prepare microspheres assembled by nanofilms with a high purity, high surface areas, and enhanced adsorption activity for the removal of heavy metal ions. Compared with conventional template-assisted methods, MnO2 materials prepared as such have relatively lower density, higher surface area and more stable configuration without the destructive effect of template removal on product morphology. To our best knowledge, the fabrication of MnO2 microspheres assembled by nanofilms and the adsorption mechanism of Pb2+ on manganese dioxides have never been reported previously. Hence, a higher degree of metal utilization as enhanced performance for removal of heavy metal ions can be expected. Additionally, this route is environmentally friendly, mass-productive and low cost.
Experimental
Synthesis of MnO2 microspheres assembled by nanofilms
In a typical synthesis process, 0.28 g of KMnO4, 0.01 g of NH4H2PO4 and 0.01 g of Na2SO4·10H2O were dissolved by a specific amount of distilled water respectively then mixed together and subsequently distilled water was added to the mixture to keep the final volume at 90 mL. The solution above was agitated with a magnetic stirrer for 15 min, then the mixture was transferred into a Teflon-lined stainless steel autoclave with a capacity of 100 mL for hydrothermal treatment at 140 °C for 48 h. As the autoclave cooled down to room temperature, the gray precipitate was harvested by several rinse–centrifugation cycles with deionized water and absolute ethanol, and finally dried under vacuum at 70 °C overnight for further characterization.
Characterization
X-ray diffraction (XRD) was carried out to identity the phase composition of synthesized samples over the 2θ range from 20° to 90° using a Rigaku D/max-A diffractometer with Co Kα radiation. A Fourier transform infrared spectroscope (FTIR, Themo Nicolet 670FT-IR) was used for recording the FTIR spectra of the sample ranged from 400 to 4000 cm−1. Morphologies of the synthesized samples were observed with a AMRAY 1000B scanning electron microscope (SEM), and the microstructural characteristics of samples were observed by high-resolution transmission electron microscope (HR-TEM, JEOL JEM-2100) working at 200 kV accelerating voltage and the lattice structure was identified by selected area electron diffraction (SAED) technique. Nitrogen adsorption–desorption measurements were conducted at 77 K on a Micromeritics Tristar apparatus. Specific surface areas were determined following the Brunauer–Emmet–Teller analysis. Atomic adsorption spectroscopy (AAS) analyses, on a S4 Thermo Electron spectrometer equipped with hollow cathode lamps and an acetylene–air flame, were used for quantitation.
Heavy metal ion removal experiments
The removal experiments of heavy metal ions were carried out at room temperature. Firstly, the adsorption solutions of Pb(II), Cd(II), Cu(II) and Cr(VI) were prepared by adding a certain amount of original heavy metal ion solutions in four closed vessels respectively, and then a mixed solution of 0.1 M HCl and 0.1 M NH3·H2O was added to adjust the pH value to 3. And finally the volume the adsorption solutions of Pb(II), Cd(II), Cu(II) and Cr(VI) was 100 mL with the concentrations of 10 mg L−1 respectively. Then 20 mg of the sample was added to the solutions above, and stirred for 24 h. During the adsorption process, at different periods (0, 0.5, 1, 1.5, 2, 4, 6, 10, and 24 h), about 0.2 mL of each solution above was extracted with a needle tube equipped with a membrane filter and then diluted to be used for AAS measurements.
Results and discussion
Structure and morphology of MnO2 microspheres assembled by nanofilms
The XRD patterns of the synthesized MnO2 microspheres assembled by nanofilms as shown in Fig. 1, declare a tetragonal α-MnO2 structure (JCPDS card no. 44-0140, a = 0.978 nm, c = 0.285 nm) of the synthesized sample. No other peaks are identified, which indicates a good purity of the samples. Detailed analysis of the peak broadening of the (3 1 0) reflection using the Scherrer equation indicates an average crystallite size ca. 3 nm, suggesting that these MnO2 particles are composed of nanocrystal subunits.
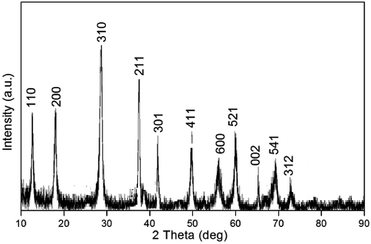 |
| | Fig. 1 XRD pattern of MnO2 (JCPDS card no. 44-0140) microspheres assembled by nanofilms. | |
SEM image of the MnO2 microspheres assembled by nanofilms is shown as Fig. 2a, which illuminates the as-synthesized samples are uniform microspheres with an average size of ca. 700 nm. It is interesting to find that the obtained MnO2 powder is made up from thin nanosheets. The unique morphology of MnO2 samples is also characterized by TEM and HR-TEM, as illustrated in Fig. 2b–e. Fig. 2b shows the resulting MnO2 microspheres are visible nano thin film assembly obviously, which is consistent with the SEM analysis. Fig. 2c confirms that the relatively large particle is aggregates of thin nanosheets, and its thickness is as thin as 2–3 nm according to Fig. 2d. The detected lattice spacing of 0.311 nm agrees with tetragonal α-MnO2 (3 1 1) plane spacing from Fig. 2e. The selected area electron diffraction (SAED) pattern is displayed in Fig. 2f, revealing the diffraction rings 1–3 are indexed to (2 0 0), (3 1 0) and (2 1 1) diffraction of tetragonal α-MnO2, respectively. It indicates that the MnO2 is composed of fine crystal particles with partial orientation. These results are in total agreement with the observed XRD analysis. The unique hierarchical nanofilm assembly structure would allow higher exposure efficiency of adsorption site to the adsorbate than a solid one, and thus is expected to be favorable for enhanced absorption activity for removal of heavy metal ions.
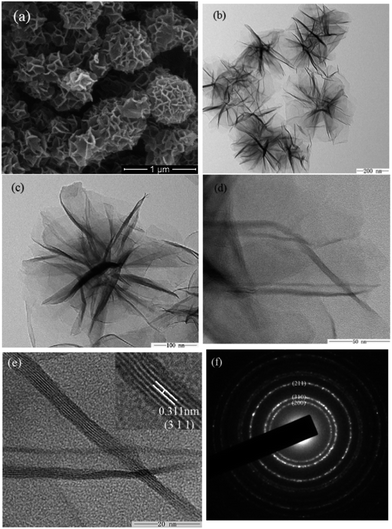 |
| | Fig. 2 SEM (a), TEM (b–d) images, HRTEM micrographs (e), and selected area electron diffraction (f) of as-synthesized MnO2 samples, which is yielded by solvothermal reaction at 140 °C for 48 h, and subsequent dried under vacuum at 70 °C overnight. | |
The N2 adsorption–desorption isotherms and the pore size distribution of the obtained MnO2 samples is shown as Fig. 3. The isotherm is identified as type IV, which is the characteristic isotherm of mesoporous materials. The pore size distribution data indicates that average pore diameters of the product are in the range of 3.2–7.5 nm. The BET surface area of the sample is 252.82 m2 g−1, which is high than most reports.24–27 The single-point total volume of pores at P/P0 = 0.975 is 0.202 cm3 g−1. The BET surface area and the large total pore volume strongly indicate that the prepared MnO2 products have a loose mesoporous structure, which is benefit for the enhanced adsorption performance.
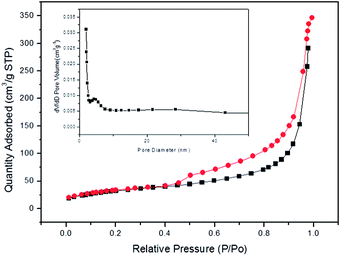 |
| | Fig. 3 Nitrogen adsorption–desorption isotherm and Barrett–Joyner–Halenda (BJH) pore size distribution plot (inset) of the prepared MnO2 samples. | |
Adsorption capacity
The adsorption capacity of MnO2 sample for removing heavy metal ions of Pb(II), Cd(II), Cu(II) and Cr(VI) from acid aqueous solutions (pH = 3) at room temperature are investigated by conducting a series of kinetic experiments as shown in Fig. 4. It can be seen that all the adsorption ions can be well adsorbed with final removal efficiency of 100%, 99.6%, 99.1% and 95.2% corresponding to Pb(II), Cd(II), Cu(II) and Cr(VI), respectively. The intrinsic hierarchical microstructure assembled by nanofilms with high specific surface areas provides MnO2 with more active site, and thus results in the high removal efficiency of heavy metal ions. Moreover, the relative large submicrometer particles are easy to be recovered after adsorption.
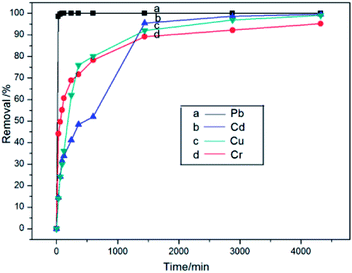 |
| | Fig. 4 Relationship between the removal efficiency and time for the adsorption of Pb(II), Cd(II), Cu(II) and Cr(VI) by MnO2 (200 mg L−1) sample at initial concentrations of heavy metal ions of 10 mg L−1, respectively. | |
The removal rates of Cd(II), Cu(II) seem not good than that of Pb(II). This is reasonable because the adsorption for heavy metal ions usually occur via ion-exchange, and electrostatic interaction between free metal ions and the surface of the samples in solutions. So, the Pb(II) is heavy and not easy desorption after ion-exchange compared with relative light element of Cd, Cu and Cr.39–45 To identify the interaction between MnO2 samples and heavy metal ions during the adsorption process, the FTIR spectra of the sample with the highest adsorption capacity of Pb2+ before and after adsorption is shown in Fig. 5 as curve a and b, respectively. The broad vibration band (ca. 3426 cm−1) is attributed to the stretching vibration of the –OH group from H3O+ formed by ion exchange reactions or physical adsorption water molecules. The peak at 2320.54 cm−1 is from the stretching vibration of CO2. While the peak at ca. 1630 cm−1 and 1401 cm−1 can be normally associated with the O–H bending mode. The strongest broad peaks in the range of 400–1000 cm−1 are contribution from O–metal bonds. The peak at around 530 cm−1 is from manganese oxides.46–48 The peak intensity and position of metal–O bond has a little discrepancy before and after adsorption of Pb2+, implying Pb2+ sticks on the MnO2 strongly.
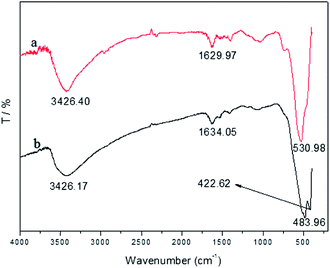 |
| | Fig. 5 FTIR spectra of the prepared MnO2 sample before (a) and after (b) adsorption of Pb(II). | |
Adsorption kinetics
For investigation of the adsorption capacity and kinetics of the MnO2 microspheres assembled by nanofilms, Pb2+ is chosen for removing from acid aqueous solutions (pH = 3). With different initial solution concentrations of 10, 30 and 50 mg L−1, the solution volume of 100 mL, and adsorption temperature of 30 °C, 10 mg adsorbent was added to a series of 250 mL conical flasks with Pb2+ solutions respectively. During the adsorption process, at different periods of 0, 7, 14, 21, 28, 35, 60, 180, 480, and 1440 min, about 1 mL of each solution above was extracted using a needle tube equipped with a membrane filter and then diluted to be used for AAS measurements. The adsorption kinetics of MnO2 sample could be perfectly fitted by a pseudo-second-order model expressed by eqn (1)–(3):| |
 | (1) |
| |
 | (2) |
| |
 | (3) |
where, qe and qt (mg g−1) are the amounts of Pb2+ adsorbed on unit mass of the adsorbent when the concentration is equilibrium and at time t (min), respectively; k2 (g mg−1 min−1) is the rate constant of the pseudo-second-order kinetic model. C0, Ce and Ct (mg L−1) are the concentrations of Pb(II) initially, at equilibrium and any time t, respectively, V is the volume of the Pb(II) solution (L), and W is the mass of adsorbent added (g). Fig. 6a shows the effectiveness of MnO2 sample in Pb2+ removal at three initial concentrations of 10, 30 and 50 mg L−1 as a function of reaction time at 30 °C. This result reveals the MnO2 microspheres assembled by nanofilms possessed super adsorption performance and good separability. Fig. 6b shows the plot of adsorption rate as a function of different concentrations of Pb2+ (10, 30 and 50 mg L−1). As observed that the adsorption rate of Pb2+ removal by MnO2 is related to its initial concentration, and with the lower concentration, the adsorption rate turns out to be the faster. This could be explained by a mechanism that involved specific metal ion adsorption at a limited number of surface active sites. In other words, with the increase of the Pb2+ concentration, the high energy sites were firstly saturated and then adsorption started on low energy sites, resulting in the decrease in the adsorption rate.49,50 Based on the data of the Pb2+ adsorption equilibrium and kinetics of MnO2 listed in Table 1, all the obtained correlation coefficient R2 are 0.999, which indicates that the pseudo-second-order model can represent the adsorption kinetics experimental data well.
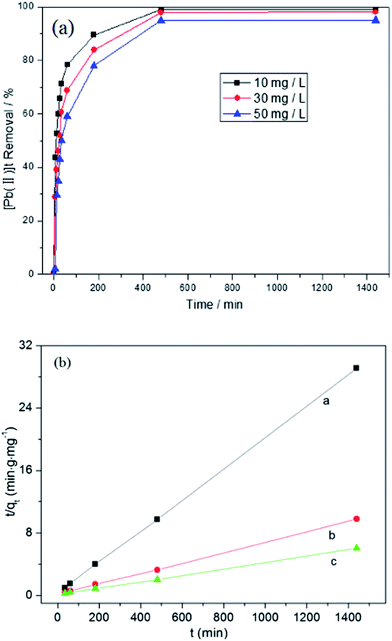 |
| | Fig. 6 (a) Relationship between the removal efficiency and time for the adsorption of Pb(II) by MnO2 (10 mg) at initial Pb2+ concentrations of 10 mg L−1, 30 mg L−1, 50 mg L−1. (b) Pseudo-second-order kinetics for adsorption of Pb2+ on the MnO2 sample (T = 30 °C; absorbent dose = 100 mg L−1; Pb2+ concentrations: a = 10 mg L−1, b = 30 mg L−1, c = 50 mg L−1). | |
Table 1 The fitted parameters for equilibrium and kinetic adsorption of Pb(II) by MnO2 sample
| Sample |
[Pb(II)]0 (mg L−1) |
qe,exp (mg g−1) |
qe,cal (mg g−1) |
k2 × 10−3 (g mg−1 min−1) |
R2 |
%E (24 h) |
| MnO2 |
10 |
49.50 |
50.00 |
1.46 |
0.999 |
99.5 |
| 30 |
147.00 |
149.25 |
0.29 |
0.999 |
98.7 |
| 50 |
237.50 |
243.90 |
0.12 |
0.999 |
95.2 |
Adsorption isotherms
To conduct the adsorption isotherm experiments, a suitable amount of adsorbent (10 mg) was added to a series of 250 mL conical flasks with Pb2+ solutions (100 mL, 10–60 mg L−1, pH = 3). Subsequently, the sealed conical flasks were placed in a thermostatic shaker for 24 hours at 150 rpm and kept the temperature at 30 °C. Then the supernatant solution was separated from the adsorbent by centrifugation, and measured by the AAS. Adsorption capacity of the MnO2 samples for Pb2+ at 30 °C can be obtained by the adsorption isotherms (Fig. 7a). The adsorption process can be explained by the Langmuir and Freundlich isotherms. According to the Langmuir equation that the adsorption is localized in a monolayer and there is no interaction between the adsorbate molecules.51 Besides, once a site was occupied by adsorbate molecules, no further adsorption can take place at that site. The linear form of the Langmuir isotherm is given as follows:| |
 | (4) |
where qmax is the theoretical maximum monolayer sorption capacity (mg g−1), kL is the Langmuir constant (L mg−1). However, the results are not fitted well with the Langmuir isotherms according to our analysis. The Freundlich isotherm is another common empirical model corresponding to linear form as eqn (5), which is supposed that the stronger binding sites are first occupied and the binding strength decreases with the increasing of the site occupation degree.52| |
 | (5) |
where kF and 1/n are the Freundlich constant (mg g−1)(L mg−1)1/n and the heterogeneity factor, respectively. Fig. 7b shows the detailed information of the constant kF and 1/n which can be determined by a plot of log![[thin space (1/6-em)]](https://www.rsc.org/images/entities/char_2009.gif) qe versus log
qe versus log![[thin space (1/6-em)]](https://www.rsc.org/images/entities/char_2009.gif) Ce. The Freundlich exponent n is greater than 1 from Table 2, suggesting an advantageous adsorption condition.52,53 It indicates that heterogeneity on the surfaces or pores of the MnO2 sample plays a key role in Pb2+ adsorption. Moreover, the correlation coefficient R2 of the sample is as high as 0.9915 as shown in Table 2, which confirms that Freundlich isotherm model is in good agreement with the experimental equilibrium analysis.
Ce. The Freundlich exponent n is greater than 1 from Table 2, suggesting an advantageous adsorption condition.52,53 It indicates that heterogeneity on the surfaces or pores of the MnO2 sample plays a key role in Pb2+ adsorption. Moreover, the correlation coefficient R2 of the sample is as high as 0.9915 as shown in Table 2, which confirms that Freundlich isotherm model is in good agreement with the experimental equilibrium analysis.
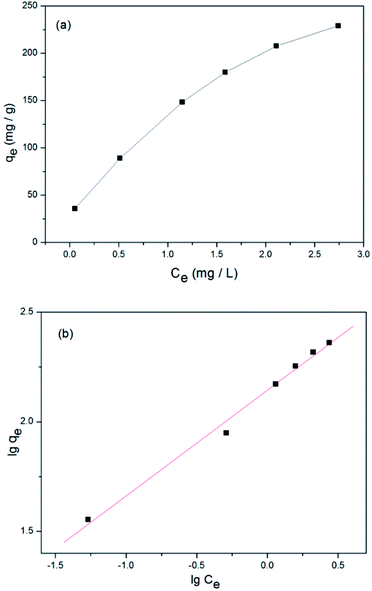 |
| | Fig. 7 (a) Adsorption isotherm for Pb2+ on the MnO2 sample (T = 30 °C; adsorbent dose = 100 mg L−1; Pb2+ concentration = 10–60 mg L−1). (b) Freundlich linear plots for adsorption isotherm of the MnO2 sample on removal of Pb2+ at 30 °C. | |
Table 2 Freundlich isotherm parameters of the MnO2
| Sample |
kF (mg g−1)(L mg−1)1/n |
n |
R2 |
| MnO2 |
139.28 |
2.07 |
0.9915 |
Adsorption thermodynamics
The thermodynamics analysis was carried out according to Arrhenius equation (eqn (6)) under certain assumption of an isolated system.54,55 In a typical experiment, with the initial concentration of 30 mg L−1, the adsorption volume of 100 mL, 10 mg adsorbent was added to the Pb2+ solutions contained in 250 mL conical flasks at three temperatures (30 °C, 40 °C and 50 °C), respectively. At different time intervals, the aqueous samples were sampled and the corresponding concentrations of Pb2+ were similarly measured through AAS to study the adsorption kinetics of Pb2+ at different temperatures. The Arrhenius equation has been applied to measure the activation energy, which is a threshold for the adsorption reaction.| |
 | (6) |
where Ea, A, R, T are the Arrhenius activation energy (kJ mol−1), the Arrhenius factor, the gas constant (8.314 J mol−1 K−1) and the absolute temperature (K), respectively. A straight line with the slope −Ea/R is obtained, when ln![[thin space (1/6-em)]](https://www.rsc.org/images/entities/char_2009.gif) k2 is plotted against 1/T (Fig. 8). The type of adsorption can be judged by the magnitude of activation energy. The activation energies of physisorption processes is often in the range of 0–40 kJ mol−1, while higher activation energies (40–800 kJ mol−1) implying chemisorption.54 The value of the activation energy is 28.08 kJ mol−1, revealing the adsorption process of Pb2+ onto the MnO2 is belong to physisorption.
k2 is plotted against 1/T (Fig. 8). The type of adsorption can be judged by the magnitude of activation energy. The activation energies of physisorption processes is often in the range of 0–40 kJ mol−1, while higher activation energies (40–800 kJ mol−1) implying chemisorption.54 The value of the activation energy is 28.08 kJ mol−1, revealing the adsorption process of Pb2+ onto the MnO2 is belong to physisorption.
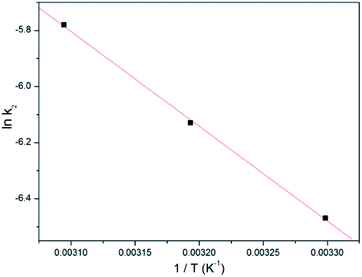 |
| | Fig. 8 Plot of ln![[thin space (1/6-em)]](https://www.rsc.org/images/entities/char_2009.gif) k2 versus 1/T for Pb2+ adsorption on the MnO2 sample. k2 versus 1/T for Pb2+ adsorption on the MnO2 sample. | |
Conclusions
Hierarchical MnO2 microspheres assembled by nanofilms are successfully synthesized by a facile and environmentally benign procedure combining with solvothermal synthesis. The unique nanofilm assembly structures allow for higher exposure of adsorption sites to adsorbate molecules than a solid one, and thus it exhibits a remarkable adsorption activity for removal of heavy metal ions. This strategy is simple, cheap and mass-productive, which may shed light on a new avenue for large-scale synthesis of hierarchical nano/micro functional materials for environmental remediation, catalyst, energy and other applications.
Acknowledgements
The authors would like to acknowledge financial support provided by the Science Foundation of Ministry of Education of China (no. 210204) and Major State Basic Research Development Program of China (973 Program, no. 2014CB643406).
Notes and references
- R. Krmer, Angew. Chem., 1998, 110, 804 CrossRef.
- H. Y. Lee, D. R. Bae, J. C. Park, H. Song, W. S. Han and J. H. Jung, Angew. Chem., 2009, 121, 1265 CrossRef.
- A. Shahbazi, H. Younesi and A. Badiei, Can. J. Chem. Eng., 2013, 91, 739 CrossRef CAS.
- M. R. Krigman, Environ. Health Perspect., 1978, 26, 117 CrossRef CAS.
- J. M. Davis, Neurotoxicology, 1990, 11, 285 CAS.
- M. H. Karaoglu, S. Zor and M. Ugŭrlu, Chem. Eng. J., 2010, 159, 98 CrossRef CAS PubMed.
- V. K. Gupta, V. K. Saini and N. Jain, J. Colloid Interface Sci., 2005, 288, 55 CrossRef CAS PubMed.
- C. Yan, G. Li, P. Xue, Q. Wei and Q. Li, J. Hazard. Mater., 2010, 179, 721 CrossRef CAS PubMed.
- B. Volesky, Water Res., 2007, 41, 4017 CrossRef CAS PubMed.
- K. A. Shroff and V. K. Vaidya, J. Chem. Technol. Biotechnol., 2012, 87, 294 CrossRef CAS.
- Y. Bessekhouad, D. Robert and J. V. Weber, J. Photochem. Photobiol., A, 2004, 163, 569 CrossRef CAS PubMed.
- F. Schurz, J. M. Bauchert, T. Merker, T. Schleid, H. Hasse and R. Glaser, Appl. Catal., A, 2009, 355, 42 CrossRef CAS PubMed.
- K. Miyazaki, M. Hieda and T. Kato, Ind. Eng. Chem. Res., 1997, 36, 88 CrossRef CAS.
- M. M. Thackeray, Prog. Solid State Chem., 1997, 25, 1 CrossRef CAS.
- W. Xiao, D. Wang and X. W. Lou, J. Phys. Chem. C, 2010, 114, 1694 CAS.
- H. Guo, R. Mao, D. Tian, W. Wang, D. Zhao, X. Yang and S. Wang, J. Mater. Chem. A, 2013, 1, 3652 CAS.
- H. Guo, Y. He, Y. Wang, L. Liu, X. Yang, S. Wang, Z. Huang and Q. Wei, J. Mater. Chem. A, 2013, 1, 7494 CAS.
- H. Guo, Y. Guo, T. Li, W. Wang, W. Chen, J. Chen and L. Liu, Green Chem., 2014 10.1039/c4gc00065j.
- H. Guo, W. Wang, L. Liu, Y. He, C. Li and Y. Wang, Green Chem., 2013, 15, 2810 RSC.
- H. Guo, L. Liu, T. Li, W. Chen, Y. Wang and W. Wang, Chem. Commun., 2014, 50, 673 RSC.
- S. P. Mishra, S. S. Dubey and D. Tiwari, J. Colloid Interface Sci., 2004, 279, 61 CAS.
- K. H. Kang, D. M. Lim and H. Shin, Water Res., 2006, 40, 903 CrossRef CAS PubMed.
- M. I. Zaman, S. Mustafa, S. Khan and B. S. Xing, J. Colloid Interface Sci., 2009, 330, 9 CrossRef CAS PubMed.
- R. X. Chen, J. G. Yu and W. Xiao, J. Mater. Chem. A, 2013, 1, 11682 CAS.
- S. B. Kanungo, S. S. Tripathy, S. K. Mishra, B. Sahoo and Rajeev, J. Colloid Interface Sci., 2004, 269, 11 CrossRef CAS PubMed.
- Q. Su, B. Pan, S. Wan, W. Zhang and L. Lv, J. Colloid Interface Sci., 2010, 349, 607 CrossRef CAS PubMed.
- E. Kim, C. Lee, Y. Chang and Y. Chang, ACS Appl. Mater. Interfaces, 2013, 5, 9628 CAS.
- S. Chandra, P. Dasa, S. Bag, R. Bhar and P. Pramanika, Mater. Sci. Eng., B, 2012, 177, 855 CrossRef CAS PubMed.
- M. L. Chacón-Patiño, C. Blanco-Tirado, J. P. Hinestrozab and M. Y. Combariza, Green Chem., 2013, 15, 2920 RSC.
- W. Zhang, Z. Yang, X. Wang, Y. Zhang, Z. Wen and S. J. Yang, Catal. Commun., 2006, 7, 408 CrossRef CAS PubMed.
- C. Karunakaran and P. Gomathisankar, ACS Sustainable Chem. Eng., 2013, 1, 1555 CrossRef CAS.
- M. Zhu, C. L. Farrow, J. E. Post, K. J. T. Livi, S. J. L. Billinge, M. Ginder-Vogel and D. L. G. Sparks, Geochim. Cosmochim. Acta, 2012, 81, 39 CrossRef CAS PubMed.
- D. Sarkar, C. K. Ghosh, S. Mukherjee and K. K. Chattopadhyay, ACS Appl. Mater. Interfaces, 2013, 5, 331 CAS.
- X. Y. Kong, Y. Ding, R. Yang and Z. L. Wang, Science, 2004, 303, 1348 CrossRef CAS PubMed.
- J. Wu, Z. M. Wang, V. G. Dorogan, S. Li, J. Lee, Y. I. Mazur, E. S. Kim and G. J. Salamo, Nanoscale Res. Lett., 2013, 8, 5 CrossRef PubMed.
- C. J. Jia, L. D. Sun, F. Luo, X. D. Han, L. J. Heyderman, Z. G. Yan, C. H. Yan, K. Zheng, Z. Zhang and M. Takano, J. Am. Chem. Soc., 2008, 130, 16968 CrossRef CAS PubMed.
- X. Li, J. Phys. Chem. C, 2010, 114, 15343 CAS.
- Q. Sun, Q. Wang, P. Jena, J. Yu and Y. Kawazoe, Phys. Rev. B: Condens. Matter Mater. Phys., 2004, 70, 2454 Search PubMed.
- M. Benavente, L. Moreno and J. Martinez, J. Taiwan Inst. Chem. Eng., 2011, 42, 976 CrossRef CAS PubMed.
- C. J. Karin, T. F. Valfredo, C. M. L. Mauro, N. Ademir and A. R. Peralt, J. Colloid Interface Sci., 2005, 291, 369 CrossRef PubMed.
- G. Sheng, S. Wang, J. Hu, Y. Lu, J. Li, Y. Dong and X. Wang, Colloids Surf., A, 2009, 339, 159 CrossRef CAS PubMed.
- M. H. Karaoğlu, İ. Kula and M. Uğurlu, Clean: Soil, Air, Water, 2013, 41, 548 Search PubMed.
- R. Xie, H. Wang, Y. Chen and W. Jiang, Environ. Prog. Sustainable Energy, 2013, 32, 688 CrossRef CAS.
- X. F. Sun, Z. Jing, H. Wang and Y. Li, J. Appl. Polym. Sci., 2013, 129, 1555 CrossRef CAS.
- E. Kusvuran, D. Yildirim, A. Samil and O. Gulnaz, Clean: Soil, Air, Water, 2012, 40, 1273 CAS.
- L. Kang, M. Zhang, Z. Liu and K. Ooi, Spectrochim. Acta, Part A, 2007, 67, 864 CrossRef PubMed.
- R. M. Potter and G. R. Rossman, Am. Mineral., 1979, 64, 1219 CAS.
- D. C. Golden, C. C. Chen and J. B. Dixon, Science, 1986, 231, 270 Search PubMed.
- I. A. Zouboulis, K. N. Lazaridis and K. A. Matis, J. Chem. Technol. Biotechnol., 2002, 77, 958 CrossRef.
- Y. B. Liu, Y. Q. Wang, S. M. Zhou, S. Y. Lou, L. Yuan, T. Gao, X. P. Wu, X. J. Shi and K. Wang, ACS Appl. Mater. Interfaces, 2012, 4, 4913 CAS.
- I. Langmuir, J. Am. Chem. Soc., 1918, 40, 1361 CrossRef CAS.
- H. M. F. Freundlich, Z. Phys. Chem., 1906, 57, 385 CAS.
- B. H. Hameed, A. A. Ahamd and N. Aziz, Chem. Eng. J., 2007, 133, 195 CrossRef CAS PubMed.
- J. J. Fan, W. Q. Cai and J. G. Yu, Asian J. Chem., 2011, 6, 2481 CrossRef CAS PubMed.
- K. V. Kumar and A. Kumaran, Biochem. Eng. J., 2005, 27, 83 CrossRef CAS PubMed.
|
| This journal is © The Royal Society of Chemistry 2014 |
Click here to see how this site uses Cookies. View our privacy policy here. 


![[thin space (1/6-em)]](https://www.rsc.org/images/entities/char_2009.gif) qe versus log
qe versus log![[thin space (1/6-em)]](https://www.rsc.org/images/entities/char_2009.gif) Ce. The Freundlich exponent n is greater than 1 from Table 2, suggesting an advantageous adsorption condition.52,53 It indicates that heterogeneity on the surfaces or pores of the MnO2 sample plays a key role in Pb2+ adsorption. Moreover, the correlation coefficient R2 of the sample is as high as 0.9915 as shown in Table 2, which confirms that Freundlich isotherm model is in good agreement with the experimental equilibrium analysis.
Ce. The Freundlich exponent n is greater than 1 from Table 2, suggesting an advantageous adsorption condition.52,53 It indicates that heterogeneity on the surfaces or pores of the MnO2 sample plays a key role in Pb2+ adsorption. Moreover, the correlation coefficient R2 of the sample is as high as 0.9915 as shown in Table 2, which confirms that Freundlich isotherm model is in good agreement with the experimental equilibrium analysis.

![[thin space (1/6-em)]](https://www.rsc.org/images/entities/char_2009.gif) k2 is plotted against 1/T (Fig. 8). The type of adsorption can be judged by the magnitude of activation energy. The activation energies of physisorption processes is often in the range of 0–40 kJ mol−1, while higher activation energies (40–800 kJ mol−1) implying chemisorption.54 The value of the activation energy is 28.08 kJ mol−1, revealing the adsorption process of Pb2+ onto the MnO2 is belong to physisorption.
k2 is plotted against 1/T (Fig. 8). The type of adsorption can be judged by the magnitude of activation energy. The activation energies of physisorption processes is often in the range of 0–40 kJ mol−1, while higher activation energies (40–800 kJ mol−1) implying chemisorption.54 The value of the activation energy is 28.08 kJ mol−1, revealing the adsorption process of Pb2+ onto the MnO2 is belong to physisorption.


