DOI:
10.1039/C4RA00338A
(Paper)
RSC Adv., 2014,
4, 20964-20973
Amelioration of sodium arsenite induced toxicity by diallyl disulfide, a bioactive component of garlic: the involvement of antioxidants and the chelate effect†
Received
13th January 2014
, Accepted 14th March 2014
First published on 17th March 2014
Abstract
Chronic exposure to high concentrations of arsenic in drinking water poses severe health problems. Despite arsenic being a severe health hazard, a safe and effective remedy against arsenic poisoning remains elusive. Previously, studies from our group showed that aqueous garlic extract could be a potential protective substance against arsenic toxicity. In the present study, we aimed to identify the bioactive component of garlic that participates in the remediation of arsenic toxicity. To this end we studied the interaction between diallyl disulphide (DADS), a stable antioxidant present in garlic, with NaAsO2 by UV spectrophotometry. The UV spectral data revealed the chemical interactions between DADS and As(III) in a 3
:
1 molar ratio. Furthermore, we investigated the potency of DADS in combating arsenic toxicity in human hepatocellular carcinoma cell line (HepG2) by MTT assay. The results showed that 50 μM DADS along with 10 μM NaAsO2 could effectively attenuate the arsenite-induced cytotoxicity, production of reactive oxygen species (ROS), lipid peroxidation and DNA damage. Application of DADS along with NaAsO2 in HepG2 cells resulted in the modulation of arsenite-induced activities of antioxidant enzymes like superoxide dismutase (SOD) and catalase (CAT) to near normal levels. Finally, we attempted to trace the chemical interaction between As(III) and DADS in the HepG2 cellular environment. High-performance liquid chromatography (HPLC) analysis of the NaAsO2 and DADS treated cell lysate revealed similar interactions between NaAsO2 and DADS to those observed in vitro.
1. Introduction
Ground water arsenic contamination has been reported in many countries, including India and Bangladesh.1 In particular, the high level of arsenic content in water from West Bengal and Bangladesh constitutes a serious public health concern. In West Bengal, arsenic has been found in drinking water at a concentration of 50 μg l−1, which is far above the permissible limit prescribed by the World Health Organization.1 Arsenic exposure leads to diseases such as melanosis, hyperkeratosis, Bowen's disease, and basal and squamous cell carcinomas.2
The two environmentally and biologically pertinent forms of arsenic in neutral aqueous solution are arsenate [As(V)] and arsenite [As(III)].3 Arsenite is more toxic than arsenate, and it is brought into cells by aquaglyceroporins, which transport small molecules.4 Moreover, trivalent compounds are absorbed more readily than their pentavalent forms because of their high lipid solubility.5
Arsenic mediates its toxic effect by triggering the production of reactive oxygen species (ROS), inhibiting the activities of antioxidant enzymes like superoxide dismutase (SOD) and catalase (CAT), which leads to an alteration in the cell's intrinsic antioxidant defences. This causes a disturbed anti-oxidant/pro-oxidant ratio.4,6 Excessive ROS might create oxidative stress by targeting proteins, structural carbohydrates, lipids and DNA, which are the primary electron-rich sites within the cell.7 Other report suggested that the generation of oxidative DNA damage leads to breakage of DNA strands and DNA–protein crosslinks.8 Arsenic also deactivates enzymes by binding with enzyme sulfhydryl groups.9
A report from our laboratory suggested that garlic, a common Indian household spice containing a number of organosulfur compounds (OSCs), has an inhibitory effect on arsenic-induced toxicity. Aqueous garlic extract (AGE) attenuated arsenic-induced cytotoxicity and reduced intracellular ROS levels in human malignant melanoma cells, human keratinocyte cells (HaCaT) and cultured human normal dermal fibroblast cells. Moreover, it was also observed that Sprague-Dawley rats fed with AGE had 40% less arsenic in their blood and liver, and 45% more arsenic was excreted in their urine.10 Thus, AGE could be a potential substitute for synthetic chelators, which have various side effects associated with them.11
The anti-arsenic effect of garlic could be attributed to the various sulfur containing compounds in garlic. However, the literature suggests differences in the sulphur containing compounds in garlic grown under different climatic conditions.12 Therefore, the efficacy of garlic for combating arsenic-induced toxicity may vary with the composition of sulphur compounds in the garlic. Hence, there is a need to study the effect of individual garlic components on arsenic-induced toxicity.
Allicin, the most effective substance found in garlic, changes upon ingestion from its reactive form into stable sulfides in the intra-stomach acidic solution, or breaks down into products like allyl methyl sulfides and, finally, into mercaptan, in vivo.13 Garlic alkenyl sulfides, like diallyl disulfide (DADS), diallyl trisulfide, and diallyl tetrasulfides, are well known antioxidants.14 Among these, DADS, which represents 40–60% of garlic essential oil, is the most stable one.15 A report suggested that DADS can attenuate ethanol-induced cytotoxicity in human hepatocytes.16 Moreover, it can also protect rat hepatocytes from aflatoxin-B(1)-induced DNA damage.17
The present study has been designed to monitor the chemical interaction between DADS and As(III) spectrometrically, and examine its effect in the mitigation of arsenic-induced cytotoxicity, ROS production, genotoxicity, disrupted enzyme activity as well as lipid peroxidation. We further demonstrated the formation of an As(III)–DADS interaction complex in vitro, which might play a key role in the modulation of arsenic toxicity by DADS.
2. Materials and methods
2.1. Chemicals
Sodium arsenite (NaAsO2), diallyl disulphide (DADS), and 1-diphenyl-2-picrylhydrazyl (DPPH) were purchased from Sigma-Aldrich, USA. Dulbecco's Modified Eagle's Medium (DMEM) and 5-(and-6)-chloromethyl-2′,7′-dichlorodihydrofluorescein diacetate acetyl ester (CM-H2DCF-DA) were obtained from Invitrogen, USA. Cell culture plastic wares were obtained from Nunc, Roskilde, Denmark. Poly-ADP ribose polymerase (PARP) IgG polyclonal antibody was obtained from Santa Cruz Biotechnology, USA. Goat antimouse IgG, alkaline phosphatase conjugated secondary antibody and 5-bromo-4-chloro-3-indolyl phosphate–nitro blue tetrazolium (BCIP–NBT) were obtained from Bangalore Genei, India. For each experiment, freshly prepared NaAsO2 solution was passed through a 0.22 μm membrane filter.
2.2. Determination of the antioxidant activity of DADS
The antioxidant capacity of DADS was assessed by DPPH-radical scavenging assay. Various concentrations of DADS (10, 20, 40, 50, 100 μM) were mixed with a methanolic solution of DPPH (0.2 mM), and left to stand at room temperature (30 min) in the dark. Absorbances were measured at 517 nm (EMax Precision Micro-Plate Reader, Molecular Devices, USA). The ability of DADS to scavenge DPPH was calculated using the equation:
% Radical scavenging activity = [(ADPPH − AS)/ADPPH] × 100 |
where
ADPPH and
AS are the absorbances of DPPH solution alone and with a particular concentration of DADS, respectively.
2.3. UV spectral analysis
The interaction of As(III) with DADS was studied spectrophotometrically. Briefly, 0.2 mM NaAsO2 was added to 2 mM DADS (forward), or 0.2 mM DADS was added to 2 mM NaAsO2 (reverse), and changes in absorbance were recorded at 200–400 nm at 30 min intervals for the forward titration and 60 min intervals for the reverse titration, up to 7 h and finally at 24 h, using a UV-1700 spectrophotometer (Shimadzu, Japan). The kinetics of the As(III)–DADS interactions was followed at 215 nm for over 24 h. To determine the stoichiometry of the As(III)–DADS interactions, changes in the absorbance were measured at various molar ratios (0
:
1, 1
:
1, 2
:
1, 3
:
1, 4
:
1, 5
:
1, 6
:
1) of DADS
:
As(III) at 215 nm under anaerobic conditions.
2.4. FT-IR study of the As(III)–DADS complex
NaAsO2 and DADS (1
:
3 molar ratio) were mixed in a 50% aqueous methanol solution. The mixture was completely de-oxygenated by purging with nitrogen gas, stirred overnight and finally extracted with diethyl ether. The organic layer was washed thoroughly with water and dried in the presence of anhydrous sodium sulphate. The resulting solution was concentrated under reduced pressure using a rotary evaporator, and the viscous liquid thus obtained was analysed using a Spectrum 100 FTIR spectrometer (Perkin Elmer, USA).
2.5. Cell culture
Human hepatoma cells (HepG2, NCCS, Pune, India) were grown in DMEM supplemented with 10% FBS and antibiotics (penicillin, 100 μg ml−1; streptomycin, 50 μg ml−1). Cells were cultured at 37 °C in 95% air, 5% CO2 in an incubator.
2.6. MTT assay
The in vitro growth inhibition effect of NaAsO2 on HepG2 cells was determined by MTT assay. Briefly, exponentially growing cells in a 96-well microtiter plate were either exposed to NaAsO2 alone (1, 5, 10, 20, 50, 60, 100, or 110 μM), or NaAsO2 (10 μM) along with DADS (50 μM), for 24 h and incubated with MTT solution for 4 h at 37 °C. To achieve solubilisation of the formazan crystals formed in viable cells 100 μl of DMSO was added to each well, and absorbance was measured at 550 nm (EMax Precision MicroPlate Reader, Molecular Devices, USA). The percentage of cytotoxicity was calculated as:
cytotoxicity = [1 − Atest/Acontrol] × 100 |
2.7. Determination of intracellular ROS production
To measure intracellular ROS production, cells treated with 10 μM NaAsO2 were incubated alone or with 50 μM DADS for 24 h. After the treatment, the cells were trypsinised, resuspended in PBS and incubated with 10 μM CM-H2DCFH-DA. In presence of intracellular ROS, non-fluorescent CM-H2DCFH-DA is converted to highly fluorescent dichlorofluorescein (DCF), leading to a change in fluorescence intensity which was measured after 45 min using a spectrofluorometer (LS-55, Perkin Elmer, USA; excitation: 495 nm, emission: 527 nm).
2.8. Measurement of intracellular reduced glutathione (GSH), CAT, SOD and lipid peroxidation
For the measurement of GSH, CAT, SOD and lipid peroxidation, the cells were cultured in 6 cm dishes and treated with 10 μM NaAsO2 alone, or with 10 μM NaAsO2 along with 50 μM DADS. After 24 h the cells were washed three times with ice cold PBS, scraped off the dishes and harvested in Eppendorf tubes. The cells were lysed by sonication, centrifuged (15
000 × g, 5 min, 4 °C) and the supernatants were used for analysis.
GSH was measured using a Glutathione Assay Kit (Biovision, USA) according to the manufacturer's protocol. The fluorescence intensity due to the reaction of ortho-pthaladehyde with GSH was quantified by a fluorescence plate reader (excitation/emission = 340/420 nm).
CAT activity was assayed following the procedure reported by Aebi.18 Briefly, 250 μl H2O2 (0.066 M) was added to 50 μl of cell lysate and 200 μl PBS, and the absorbance was measured at 240 nm for 60 s. The molar extinction coefficient of 43.6 M−1 cm−1 was used to determine CAT activity.
SOD was assayed according to the method of Misra and Fridovich.19 The assay procedure involves the inhibition of epinephrine auto-oxidation in an alkaline medium (pH 10.2) to adrenochrome, which is markedly inhibited by the presence of SOD. Epinephrine was added to the assay mixture containing cell lysate, and the change in extinction coefficient was followed at 480 nm with a Lambda 25 spectrophotometer (Perkin Elmer, USA). The unit of enzyme activity is defined as the amount of enzyme required for 50% inhibition of the auto-oxidation of epinephrine.
The level of lipid peroxidation was assessed by measuring the malondialdehyde (MDA) level. The quantification was based on measuring the formation of thiobarbituric acid reactive substances. Thiobarbituric acid was added to each tube, vortexed, heated in boiling water (10 min), cooled and centrifuged to precipitate out the protein. The colour developed in the supernatant was measured at 535 nm with a spectrophotometer.
2.9. Comet assay
The extent of DNA damage was quantified by alkaline single cell gel electrophoresis (SCGE) or comet assay, according to Singh et al.20 Briefly, cells were treated with 10 μM NaAsO2 alone or NaAsO2 along with 50 μM DADS for 24 h. The cells were then washed with PBS, suspended in 0.55% (w/v) low melting agarose and layered over 1% normal melting agarose-coated slides. The slides were immersed in the lysing solution (overnight at 4 °C) and then transferred into a horizontal electrophoresis chamber. Electrophoresis was carried out for 30 min (280 mA, 20 V). The slides were washed three times with neutralizing buffer (Tris 0.4 M, pH 7.5), stained with ethidium bromide, visualized under a fluorescence microscope (Leica, Germany) and analyzed by using comet score software.
2.10. Western blotting
Cells with and without DADS were washed with PBS, and the cell monolayers were then lifted by scraping and finally disrupted in cell lysis buffer (50 mM Tris–HCl, 150 mM NaCl, 1% NP-40, 0.5% sodium deoxycholate, 0.1% SDS, pH 7.4). The cells were centrifuged (15
000 × g, 5 min, 4 °C) and the supernatant was analysed on 8%-SDS-PAGE in reducing conditions. The gel was electroblotted onto a PVDF membrane which was incubated with primary antibody for PARP (1
:
1000 in TBS) overnight at 4 °C with constant shaking. The blots were washed three times with TBST and then with TBS, followed by treatment with alkaline phosphatase conjugated anti-mouse immunoglobulin G (1
:
1000 in TBS) at room temperature. The alkaline phosphatase-positive bands were visualized in a developing solution containing BCIP–NBT in 1.5 mM Tris–HCl (pH 8.8) and water in the dark for 10 min.
2.11. HPLC analysis of DADS–As(III) interaction
HepG2 cells grown in a 6 cm tissue culture dish were treated with 10 μM NaAsO2 and 50 μM DADS simultaneously. After 24 h, the cells were trypsinized and collected by centrifugation. The cells were disrupted by sonication and centrifuged (13
000 rpm, 10 min), and the supernatant was extracted with chloroform (500 μl). After evaporation of chloroform, the residue was dissolved in acetonitrile (100 μl) and filtered (0.22 μm, Millipore, USA). HPLC (Shimadzu, Japan) analysis was performed on a reverse phase C18 XBridge column (Waters, USA, 5 μM, 4.6 mm × 250 mm), under isocratic conditions (acetonitrile
:
water = 80
:
20, v/v), at a flow rate of 1.0 ml min−1. HPLC analysis of the organic fraction of the As(III)–DADS (1
:
3) methanolic mixture was also performed under similar conditions. The compounds used as standards for the HPLC column, along with their retention times (RT), are as follows: ribonuclease (RT = 17.468 min), bovine insulin (RT = 21.13 min), cytochrome C (RT = 23.0 min), lysozyme (RT = 24.94 min), bovine serum albumin (RT = 28.127 min) and ovalbumin (RT = 34.212 min).
2.12. Statistical analysis
Results are expressed as the mean and standard deviation. Differences between groups were determined by a two-sided Student's t-test. Values of P < 0.05 were considered statistically significant.
3. Results
3.1. UV-spectral analysis of As(III)–DADS interaction
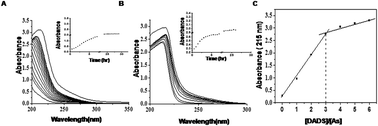
The chemical interactions between NaAsO2 and DADS were followed by UV spectrophotometry in the 200–350 nm region. Fig. 1 shows the spectral data for the titration of NaAsO2 against DADS obtained under conditions of excess DADS (2 mM) over NaAsO2 (0.2 mM) (Fig. 1A, forward) and excess NaAsO2 (2 mM) over DADS (0.2 mM) (Fig. 1B, reverse). In both the cases, a gradual increase of absorbance with the appearance of an absorption peak at 215 nm were observed with time, suggesting a possible formation of As(III)–DADS complex. The appearance of the absorption peak at 215 nm could be attributed to the charge transfer electronic transition resulting from the coordination of DADS to As(III).21 Furthermore the kinetic course of both the forward and the reverse reaction showed a steady increase in absorbance (215 nm) upto 24 h and saturation thereafter suggesting the completion of the reaction (Fig. 1A and B inset).
 |
| Fig. 1 UV spectral analysis of the NaAsO2–DADS interaction. UV spectra of NaAsO2 (0.2 mM) with DADS (2 mM) taken at 30 min intervals (A), and of DADS (0.2 mM) with NaAsO2 (2 mM) taken at 60 min intervals (B) up to 24 h. A regular increase in the absorbance of NaAsO2 (0.2 mM) with DADS (2 mM) at 215 nm (inset A), and of DADS (0.2 mM) with NaAsO2 (2 mM) at 215 nm (inset B) is observed. Spectral data for the titration of DADS with NaAsO2 at ratios of 0 : 1, 1 : 1, 2 : 1, 3 : 1, 4 : 1, 5 : 1 and 6 : 1 (C). The absorbances were measured after 24 h at 215 nm. | |
To determine the exact molar ratio for the chemical interaction between NaAsO2 and DADS, NaAsO2 was titrated against DADS at different molar ratios, and the absorbance in each case was recorded after 24 h at 215 nm. The plot of absorbance at 215 nm against different DADS
:
As(III) ratios shows that for the NaAsO2–DADS system, the absorbance increased steeply as a function of increasing DADS
:
NaAsO2 molar ratio until an end point was observed at the ratio of 3
:
1. The absorbance at higher DADS
:
NaAsO2 molar ratios then showed a plateau region, indicating saturation (Fig. 1C). Thus, the UV spectral data provide strong evidence of chemical interaction between DADS and As(III) in a 3
:
1 molar ratio.
3.2. FT-IR analysis of the DADS–NaAsO2 complex
To interpret the As(III) binding sites in DADS, FT-IR spectra of commercially available DADS (Fig. 2A) and the ether-extracted As(III)–DADS complex (Fig. 2B) were acquired and a comparative analysis was performed. In the FT-IR spectrum of DADS, the distinct peak at 1633 cm−1, corresponding to C
C stretching, shifts to a lower wavenumber of 1512 cm−1 after the reaction with As(III). This could be due to the As(III) coordination of DADS through the C
C bond, leading to weakening of the double bond. Again the peaks at 3082 and 2978 cm−1 in free DADS could be attributed to antisymmetric and symmetric stretching of
CH2, respectively. However, both the stretching frequencies shifted to lower wavenumbers of 3018 and 2918 cm−1 respectively after As(III) coordination. The lowering of both the symmetric and antisymmetric stretching frequencies of the terminal sp2 H of DADS after complexation could also support the interaction of DADS–As(III) through the C
C. Coordination of As(III) to the C
C of DADS resulted in the lowering of the s character (double bond character) of C
C. This could lead to the elongation of the adjacent
CH2 bond, which could be solely responsible for the shifting in stretching frequencies. It is also pertinent to mention that the decrease of the s character of C
C is also responsible for the lowering of the
CH and –CH2 stretching frequencies. In addition to the stretching frequencies, the other modes of vibration, like wagging, twisting, bending and rocking of the C–H bonds of both the sp2 and sp3 carbons of DADS were observed to shift to lower wavenumbers due to As(III) coordination (Table 1). Another noteworthy observation is the lowering of the C–C bond frequency from 722 to 699 cm−1. This could again be due to the decrease in the electronegativity of the adjacent sp2 C of DADS after As(III) coordination. Taken together, all these results clearly indicate the As(III)–DADS complexation through the C
C bond.
 |
| Fig. 2 IR spectra of commercial DADS before (A) and after (B) interaction with NaAsO2 in a 1 : 3 molar ratio. | |
Table 1 FT-IR bands of free DADS and the As(III)–DADS complex
Free DADS (cm−1) |
As(III)–DADS complex (cm−1) |
Assignment of IR bands |
3082 |
3018 |
Antisymmetric stretching CH2 |
3009 |
2958 |
Stretching CH |
2978 |
2918 |
Symmetric stretching CH2 |
2904 |
2848 |
Symmetric stretching –CH2 |
1633 |
1512 |
Stretching C C |
1423 |
— |
Bending CH2 |
1400 |
1261 |
Bending –CH2 |
1215 |
1215 |
Twisting –CH2 |
1074 |
1010 |
Twisting CH2 |
987 |
925 |
Wagging CH2 |
918 |
— |
— |
860 |
756 |
Rocking –CH2 |
721 |
699 |
Stretching C–C |
3.3. Evaluation of the protective action of DADS on arsenic induced cytotoxicity
The formation of the As–DADS complex encouraged us to investigate the effect of DADS on As(III) induced cytotoxicity in vitro. MTT assay was performed to determine the cytotoxic effect of NaAsO2 on HepG2 cells and the potential of DADS for the mitigation of arsenic-induced cytotoxicity. The HepG2 cells showed a dose-dependent decrease in cell viability in the presence of NaAsO2, with an IC50 of 10 μM (data not shown). Interestingly, simultaneous application of 10, 20 or 50 μM of DADS along with 10 μM of NaAsO2 reduced the cytotoxicity of NaAsO2 (taken as 100%) to 46, 37 and 8%, respectively (Fig. 3A). However, higher doses of DADS showed cytotoxic effects.
 |
| Fig. 3 Protective effect of DADS: (A) evaluation of the protective effect of DADS against NaAsO2-induced cytotoxicity in HepG2 cells. The cells were treated with 10 μM NaAsO2 for 24 h, or concomitantly treated with 10, 20, 50, 60 and 100 μM DADS. Cell growth inhibition was measured by MTT assay. Data are shown as the mean ± SD from three replicate measurements. (B) Free radical scavenging activity of different concentrations of DADS by DPPH assay. Methanolic solutions of DADS (10, 20, 40, 50 and 100 μM) were mixed with a methanolic solution of DPPH (0.2 mM), and absorbances were measured at 517 nm after 30 min. Data are shown as the mean ± SD from three replicate measurements. (C). Intracellular ROS was measured in HepG2 cells. The cells were treated with 10 μM NaAsO2 or 10 μM NaAsO2 along with 50 μM DADS for 24 h, or left untreated. Intracellular ROS was measured with a fluorometer using the fluorescent probe CM-H2DCF-DA, which is oxidized by ROS to yield a fluorescent product, which is then measured. Data are shown as the mean ± SD from three replicate measurements. The symbol * indicates a significant difference in values as compared to NaAsO2 treated cells. | |
3.4. Assessment of the radical scavenging potential of DADS by DPPH assay
It is known that the toxic effects of arsenic are mediated primarily by the generation of oxidative stress as a result of ROS production. The modulation of arsenic-induced cytotoxicity by the antioxidant garlic component DADS led us to quantify the free radical scavenging potential of DADS by DPPH assay, which has been widely used to evaluate the free radical scavenging ability of antioxidants. In the DPPH assay, the stable nitrogen-centred free radical DPPH changes from violet to yellow-colored diphenyl-picrylhydrazine. The assay is based on the reduction of DPPH in alcoholic solution in the presence of a hydrogen-donating antioxidant due to the formation of the non-radical form DPPH-H in the reaction. DPPH, as a stable free radical, accepts an electron or a hydrogen radical to become a stable diamagnetic molecule. Compounds that can perform this reaction are considered to be antioxidants, and are therefore radical scavengers.22 It was found that the radical scavenging activity of DADS increased gradually with increasing concentration. The EC50 of the DPPH radical scavenging activity of DADS was 34 μM, and a 77.6% DPPH radical scavenging activity was observed for 50 μM DADS (Fig. 3B).
3.5. Effect of DADS supplementation on NaAsO2-induced ROS generation in HepG2 cells
The radical scavenging activity of DADS as determined by DPPH assay prompted us to look into the potential of DADS to scavenge NaAsO2-induced intracellular ROS. Cells were incubated for 24 h with 10 μM NaAsO2 alone, or with 10 μM NaAsO2 along with 50 μM DADS. The cells were then analyzed for intercellular ROS generation with the fluorescent dye CM-H2DCF-DA using a spectrofluorometer. A 3-fold increase in fluorescence intensity, which could be due to the increase in intracellular ROS, was observed with 10 μM NaAsO2 compared to the untreated control. DADS (50 μM) co-treatment, however, caused a significant reversal (P < 0.01) of NaAsO2-induced ROS production, indicating the potential of DADS to scavenge the intracellular ROS (Fig. 3C).
3.6. Effect of DADS on NaAsO2-induced changes in SOD, CAT and GSH activity
Overproduction of ROS might result from the dysfunction of intercellular scavenging systems. SOD and CAT are the two most vital radical scavenging enzymes, and the body's secondary defence against oxygen metabolites. Treatment with NaAsO2 (10 μM) for 24 h caused a 2- and 6.5-fold reduction in SOD and CAT activities in HepG2 cells respectively, compared to the untreated control (Fig. 4A and B). However, co-administration of 50 μM DADS along with 10 μM NaAsO2 led to the significant recovery (P < 0.05) of the activities of SOD and CAT with respect to the NaAsO2 treated cells.
 |
| Fig. 4 Effect of DADS on NaAsO2 treated HepG2 cells. Activities of (A) SOD (units per mg of protein), (B) CAT (units per mg protein) and (C) GSH (nmol per mg protein), and (D) lipid peroxidation (ng per mg protein) in HepG2 cells with respect to the NaAsO2 treated cells and the untreated control. Data are shown as the mean ± SD from three replicate measurements. The symbol * indicates a significant difference in values compared to the NaAsO2 treated cells. | |
We also evaluated the protective role of DADS on NaAsO2-induced depletion of non-enzymatic antioxidants like GSH in HepG2 cells. Treatment of HepG2 cells with 10 μM NaAsO2 showed a 5-fold depletion of GSH level with respect to the untreated cells. However, co-treatment with 50 μM DADS resulted in a significant recovery (P < 0.01) of the NaAsO2-depleted GSH to near normal levels (Fig. 4C).
3.7. Effect of DADS on NaAsO2-induced changes in tissue lipid peroxidation
We further measured the production of MDA, an indicator of lipid peroxidation, in HepG2 cells following treatment with NaAsO2 alone or co-treatment with DADS. A higher level (4.6-fold) of MDA in the HepG2 cells treated with 10 μM NaAsO2 was observed, indicating elevated lipid peroxidation in these cells with respect to the control. Interestingly, co-treatment with DADS significantly reduced (P < 0.05) the lipid peroxidation to near normal levels (Fig. 4D).
3.8. Effect of DADS on NaAsO2-induced DNA damage
The modulatory role played by DADS against arsenic-induced cytotoxic effects led us to further investigate whether DADS could mitigate arsenic-induced genotoxicity in HepG2 cells. Comet assay (SCGE) was used for the assessment of the genotoxic effect of NaAsO2, and the protective potential of DADS against NaAsO2-induced genotoxicity. Experimental results revealed that in untreated cells, comet-like features, which correspond to DNA damage, are almost absent. However, treatment of the cells with 10 μM NaAsO2 for 24 h induced DNA damage, as is evident from the presence of comet-like features with tail length of 10.3 ± 0.635 μm. However, the tail length decreased significantly (P < 0.01) to 1.23 ± 0.154 μm when the cells were co-treated with DADS (50 μM) (Fig. 5A and B).
 |
| Fig. 5 Evaluation of the protective role of DADS against NaAsO2-induced DNA damage in HepG2 cells. (A) The cells were left untreated (i), or were treated with 10 μM NaAsO2 alone (ii), with 10 μM NaAsO2 along with 50 μM DADS (iii), or with 50 μM DADS (iv) for 24 h. The DNA damage was measured by a Comet assay (SCGE). (B) The extent of DNA damage is expressed in terms of comet tail length. The symbol * indicates a significant difference in values compared to the NaAsO2 treated cells. (C) Expression of the DNA repair enzyme PARP as measured by Western blot following treatment with DADS in NaAsO2-treated HepG2 cells. Lane 1: untreated cells; lane 2: cells treated with 10 μM NaAsO2; lane 3: cells treated with 10 μM NaAsO2 along with 50 μM DADS; lane 4: cells treated with 50 μM DADS alone. The band intensities were normalized to the total protein amounts, and scanned by Image-J software. The symbol * indicates a significant difference in values compared to the NaAsO2-treated cells. | |
The role of DADS in the DNA repair process was further evaluated by studying the cleavage of poly(ADP-ribose) polymerase (PARP). PARP is a nuclear enzyme activated by DNA breakage, and performs a central role in the repair of damaged DNA through poly(ADP) ribosylation at sites of DNA damage. In response to various stress conditions, including oxidative and genotoxic stress,23 PARP (116 kDa) is cleaved into 89 and 24 kDa fragments that contain the active site and the DNA-binding domain of the enzyme, respectively, essentially inactivating the enzyme by destroying its ability to respond to DNA strand breakage, preventing subsequent DNA repair. Western blot analysis with anti-PARP antibody against full length PARP (116 kDa) showed decreased PARP expression, suggesting cleavage of PARP in HepG2 cells treated with 10 μM NaAsO2 for 24 h. Recovery of PARP expression was observed when the HepG2 cells were co-treated with 50 μM DADS (Fig. 5C). This result indicates the efficacy of DADS in the mitigation of NaAsO2-induced cleavage of the DNA repair enzyme PARP.
3.9. Investigation of DADS–As(III) interactions in cell culture
The in vitro complexation of As–DADS and its mitigation of arsenic toxicity in HepG2 cells prompted us to determine the formation and stability of the As–DADS complex in the cell culture environment. For this, HepG2 cells incubated with 10 μM NaAsO2 and 50 μM DADS simultaneously for 24 h were lysed and the organic fraction was extracted with chloroform and analyzed by HPLC. Comparison of the HPLC chromatograms of the NaAsO2 and DADS mixture (1 mM
:
3 mM) with the organic fraction of NaAsO2 (10 μM) and DADS (50 μM) treated cell lysate showed the presence of appropriate spiking (6.7), thus confirming the presence of the DADS–As(III) complex in the sample even after 24 h incubation, with the formation of one major and a few minor metabolites (Fig. 6A and B). The results indicate that DADS–As(III) complex formation is stable and could mitigate NaAsO2-induced toxicity in HepG2 cells.
 |
| Fig. 6 HPLC analysis of DADS–As(III) interactions in cell culture. (A) Chromatogram of the synthesized DADS–As(III) complex. (B) Chromatogram of the organic fraction of the lysate of cells treated with 10 μM NaAsO2 and 50 μM DADS for 24 h. | |
4. Discussion and conclusion
Our results showed that DADS, which is a pharmacologically active ingredient of aqueous garlic extract, interacts chemically and forms a complex with As(III), and can successfully remediate As(III)-induced toxic effects and ROS production in HepG2 cells.
UV spectroscopy was used to study the electronic properties associated with the As(III)–DADS coordination, and absorption intensity was found to be directly proportional to the amount of complex formed. The UV spectral analysis showed that DADS coordination to As(III) resulted in a charge transfer electronic transition in the UV region (200–350 nm) resulting in an absorption peak at 215 nm. The kinetics of the DADS–As(III) interaction, followed for more than 24 h, showed a slow but regular increase in the absorbance of the DADS–As(III) mixture at 215 nm with time, indicating a slow ligand substitution reaction in the As(III)–DADS system, which is similar to As(III) coordination to other chelating ligands like GSH, dimercaptosuccinic acid and dihydrolipoic acid, which also show slow kinetics.21 The UV spectral data also confirmed the formation of an As(III)–DADS complex in a 1
:
3 molar ratio. Furthermore, the FT-IR spectrum showing the shift in the C
C stretching frequency in DADS to a lower wavenumber upon As(III) coordination definitely suggested the C
C bond in DADS as the major site of As(III) coordination. Taken together, these results suggested that the probable structural formula of the As(III)–DADS complex is that shown in Fig. 7. In this context it can be noted that, although the well known arsenic chelator BAL can also chelate arsenic by forming a five membered dimercaprol–arsenic ring, its use in the treatment of arsenic-induced toxicity is associated with many side effects.24 Hence, an arsenic chelator with fewer side effects is very desirable. Furthermore, administration of D-penicillamine, another efficient arsenic chelator, could not effectively modulate arsenic-induced rain drop pigmentation,25 and therapy with dimercaptosuccinic acid did not cause any significant clinical improvement compared to patients treated with placebo.26 Although therapy with dimercaptopropane succinate resulted in a significant improvement in chronic arsenicosis patients, the drug is costly and unsuitable for use for large number of poor arsenicosis patients.27 It is also worth mentioning that some previously reported herbal compounds acted as antioxidants and scavenged the free radicals generated by arsenic, thus modulating the arsenic-induced toxicity.28,29 However, DADS shows remarkable radical scavenging potential and also acts as a potent arsenic chelator, as evidenced by the IR data. Thus it is expected to exert a dual effect on the remediation of arsenic toxicity.
 |
| Fig. 7 Probable structural formula of the As(III)–DADS 1 : 3 complex. | |
The chemical interaction between As(III) and DADS encouraged us to look into the potential of DADS for the modulation of arsenic-induced toxicity. In lower doses (10, 20 or 50 μM), DADS could reduce the NaAsO2-induced cytotoxic effect in HepG2 cells. 50 μM DADS could reduce the cytotoxicity of NaAsO2-treated cells to approximately 93%. However, higher doses were toxic to the HepG2 cells. This might be due to the fact that higher doses of DADS induced significant apoptosis in the HepG2 cells when incubated for 24 h.30
The DPPH radical scavenging assay, commonly used for the assessment of the free radical scavenging ability of a compound in a cell-free system,22 suggested the ability of DADS to scavenge free radicals in a cell-free system. The potential of DADS for scavenging intracellular ROS was also confirmed by fluorimetric assay, using the cell permeable fluorescent probe CM-H2DCF-DA. Hence, it might be possible that in arsenic-induced cytotoxicity, DADS might act as a free radical scavenger, reducing the toxic effects of arsenic by quenching the excessive free radicals released.
The cellular antioxidant system mainly includes antioxidant enzymes like SOD and CAT. SOD and CAT defend cells against the toxic effects of oxygen metabolism. SOD mainly acts by quenching the O2 resulting from the formation of H2O2 and H2O,19 while CAT accelerates the dismutation of H2O2 resulting in the formation of H2O and O2.31 Thus, these enzymes play an important role in the elimination of free radicals and the concomitant modulation of oxidative stress. Our present study suggests that NaAsO2 treatment reduced the activities of both SOD and CAT. Since arsenic produced excess amounts of ROS, the counterbalancing effect of the antioxidant enzymes is lost, resulting in the depletion of the activities of antioxidant enzymes. However, co-treatment with DADS enhanced the activities of the antioxidant enzymes, probably due to its free radical scavenging property.
The second line of antioxidant defense includes the non-enzymatic radical scavenger GSH, which is responsible for scavenging residual free radicals that escape decomposition by the antioxidant enzymes.32 It also promotes the methylation of arsenic.33 The methylation of arsenic is particularly important, as the methylated arsenicals are less toxic than inorganic arsenic and so it protects the cell against the adverse toxic effects of arsenic itself. We observed that the arsenic treatment caused a reduction in the cellular GSH level, which was however restored on co-treatment with DADS.
ROS, when produced in high fluxes, also causes lipid peroxidation, resulting in the production of excess malondialdehyde as evidenced in the NaAsO2-treated cells. However, DADS co-treatment reversed the increase of MDA levels to a significant extent, thereby confirming its antioxidant role.
Arsenic is a well known inducer of oxidative stress. According to Kessel et al., the excess production of ROS beyond the cellular endogenous antioxidant balance may be one of the prime factors of arsenic-induced genotoxicity.34 Moreover, As(III) also inhibits enzymes involved in the DNA repair process, thus leading to the alteration of the DNA repair mechanism.35 The present study showed that As(III) treatment of HepG2 cells for 24 h resulted in more ROS generation compared to the untreated control. This excessive production of ROS might be the prime cause of severe DNA damage, as evident from the increased comet tail length of cells treated with NaAsO2 for 24 h. But the significant observation of the present work is that co-treatment with DADS not only prevented As(III)-induced DNA damage in HepG2 cells, as evidenced by the reduced comet tail length compared to As(III)-treated cells, but also helped in the recovery of damaged DNA by suppressing the cleavage of the DNA repair enzyme PARP. This is in accordance with the findings of other researchers, who suggested that antioxidants like folate, curcumin etc., prevented As(III)-induced PARP cleavage and thus helped in the DNA repair mechanism.28,36
The interaction of NaAsO2 with DADS confirmed by UV spectral analysis, and also the mitigation of NaAsO2-induced toxicity by DADS in HepG2 cells raises two obvious questions: firstly, whether the DADS–NaAsO2 complex formation occurs within cellular environment and plays an active role in the modulatory effect of DADS against NaAsO2-induced toxicity, and secondly, whether the DADS–NaAsO2 complex is stable within the cellular environment. To address these questions, the fate of DADS within the cellular environment was determined by incubating HepG2 cells with DADS (50 μM) and NaAsO2 (10 μM) simultaneously for 24 h. After 24 h the cells were lysed and the organic fraction of the lysate, which might contain the NaAsO2 complex, was subjected to HPLC analysis. A HPLC chromatogram was obtained for the synthesized DADS–NaAsO2 complex. The HPLC chromatogram of the As(III)–DADS (1
:
3) interaction complex showed a major peak at 6.7 along with few other peaks due to minor contributions from As(III)–DADS interactions in other molar ratios. Interestingly, the chromatogram of the organic fraction of the lysate of cells treated with NaAsO2 and DADS, with appropriate spiking (6.7), confirmed the presence of a similar As(III)–DADS (1
:
3) interaction complex along with other cellular metabolites in HepG2 cells after 24 h of incubation with As(III) and DADS. In this context another significant observation was the absence of a peak for free inorganic arsenic in the HPLC chromatogram. As HPLC analysis was carried out with the organic fraction of the cell lysate for the detection of the DADS–NaAsO2 complex, which was found to be soluble in organic solvent, the peak for NaAsO2, which is a water soluble compound, is not expected to be present in the chromatogram. Hence this method was used to measure the complexed arsenic, and not free As(III). In light of the HPLC data it could be concluded that the ameliorating effect of DADS against NaAsO2-induced cytotoxicity, as well as the genotoxicity of NaAsO2, could also be attributed to the formation of an As(III)–DADS complex in the cell culture, which might play a role in shielding biological targets from the metal ion, thereby reducing its toxic effect.
DADS administration along with NaAsO2 alleviated the toxic effect of NaAsO2 on the investigated parameters. In this respect it is worth mentioning that DADS is preferentially metabolized to allicin by cyp2e1 in the human liver.37 Therefore the inhibition of ROS generation in NaAsO2 treated cells by DADS might be partially caused by allicin. Furthermore the inhibitory effect of DADS against mercuric chloride-induced toxicity has also been reported.38 This reflects the potential prophylactic activity of DADS against arsenic toxicity, and makes the natural approach to reduce the heavy metal toxicity even more relevant. In conclusion it is worth stating that our study could open up a new route towards the development of a safe and economically viable compound as an alternative therapeutic drug against NaAsO2-induced toxicity. However, the efficacy of DADS to modulate arsenic toxicity in vivo awaits further investigation.
Abbreviations
BCIP–NBT | 5-Bromo-4-chloro-3-indolylphosphate–nitroblue tetrazolium |
CAT | Catalase |
CM-H2DCF-DA | 5-(and-6)-Chloromethyl-2′,7′-dichlorodihydrofluorescein diacetate acetyl ester |
DADS | Diallyl disulphide |
DPPH | 1-Diphenyl-2-picrylhydrazyl |
DMEM | Dulbecco's Modified Eagle's Medium |
HepG2 | Human hepatoma cells |
GSH | Intracellular glutathione |
MDA | Malondialdehyde |
PARP | Poly-ADP ribose polymerase |
ROS | Reactive oxygen species |
SOD | Superoxide dismutase |
Acknowledgements
The work was supported by the Council of Scientific & Industrial Research (CSIR), Govt. of India. B.D. is grateful to CSIR for a research fellowship.
References
- A. H. Smith, E. O. Lingas and M. Rahman, Bull. W. H. O., 2000, 78, 1093–1103 CAS.
- J. A. Centeno, F. G. Mullick, L. Martinez, N. P. Page, H. Gibb, D. Longfellow, C. Thompson and E. R. Ladich, Environ. Health Perspect., 2002, 110(supp. 5), 883–886 CrossRef CAS.
- O. M. N. Dhubhghaill and P. J. Sadler, Struct. Bonding, 1991, 78(78), 129–190 CrossRef.
- S. X. Liu, M. Athar, I. Lippai, C. Waldren and T. K. Hei, Proc. Natl. Acad. Sci. U. S. A., 2001, 98, 1643–1648 CrossRef CAS.
- M. Ellenhorn, Arsenic: metals and related compounds, in Ellenhorn's Medical Toxicology, Diagnosis and Treatment of Human Poisoning, Williams & Wilkins, Baltimore, 2nd edn, 1997 Search PubMed.
- I. Nordenson and L. Beckman, Hum. Hered., 1991, 41, 71–73 CrossRef CAS PubMed.
- F. J. Romero, F. Bosch-Morell, M. J. Romero, E. J. Jareno, B. Romero, N. Marin and J. Roma, Environ. Health Perspect., 1998, 106(supp. 5), 1229–1234 CrossRef CAS.
- T. S. Wang, T. Y. Hsu, C. H. Chung, A. S. Wang, D. T. Bau and K. Y. Jan, Free Radical Biol. Med., 2001, 31, 321–330 CrossRef CAS.
- N. Scott, K. M. Hatlelid, N. E. MacKenzie and D. E. Carter, Chem. Res. Toxicol., 1993, 6, 102–106 CrossRef CAS.
- R. Chowdhury, A. Dutta, S. R. Chaudhuri, N. Sharma, A. K. Giri and K. Chaudhuri, Food Chem. Toxicol., 2008, 46, 740–751 CrossRef CAS PubMed.
- S. J. Flora, M. Mittal and A. Mehta, Indian J. Med. Res., 2008, 128, 501–523 CAS.
- E. Block, S. Naganathan, D. Putman and S. Zhao, J. Agric. Food Chem., 1992, 40, 2418–2440 CrossRef CAS.
- C. Egen-Schwind, R. Eckard and F. H. Kemper, Planta Med., 1992, 58, 301–305 CrossRef CAS PubMed.
- R. Qi and Z. Wang, Trends Pharmacol. Sci., 2003, 24, 62–63 CrossRef CAS.
- S. M. Kim, K. Kubota and A. Kobayashi, Biosci., Biotechnol., Biochem., 1997, 61, 1482–1485 CrossRef CAS.
- M. Shimada, L. Liu, N. Nussler, S. Jonas, J. M. Langrehr, T. Ogawa, M. Kaminishi, P. Neuhaus and A. K. Nussler, Toxicol. Lett., 2006, 163, 242–249 CrossRef CAS PubMed.
- L. Y. Sheen, C. C. Wu, C. K. Lii and S. J. Tsai, Toxicol. Lett., 2001, 122, 45–52 CrossRef CAS.
- H. Aebi, Methods Enzymol., 1984, 105, 121–126 CAS.
- H. P. Misra and I. Fridovich, J. Biol. Chem., 1972, 247, 3170–3175 CAS.
- N. P. Singh, M. T. McCoy, R. R. Tice and E. L. Schneider, Exp. Cell Res., 1988, 175, 184–191 CrossRef CAS.
- A. M. Spuches, H. G. Kruszyna, A. M. Rich and D. E. Wilcox, Inorg. Chem., 2005, 44, 2964–2972 CrossRef CAS PubMed.
- J. H. Lee, K. H. Park, M. H. Lee, H. T. Kim, W. D. Seo, J. Y. Kim, I. Y. Baek, D. S. Jang and T. J. Ha, Food Chem., 2013, 136, 843–852 CrossRef CAS PubMed.
- N. Kourtis and N. Tavernarakis, EMBO J., 2011, 30, 2520–2531 CrossRef CAS PubMed.
- J. A. Vilensky and K. Redman, Ann. Emerg. Med., 2003, 41, 378–383 CrossRef PubMed.
- T. Piamphongsant, Int. J. Dermatol., 1999, 38, 401–410 CrossRef CAS.
- D. N. Guha Mazumder, U. C. Ghoshal, J. Saha, A. Santra, B. K. De, A. Chatterjee, S. Dutta, C. R. Angle and J. A. Centeno, Clin. Toxicol., 1998, 36, 683–690 CrossRef CAS.
- N. Ghose, K. K. Majumdar, A. K. Ghose, C. K. Saha, A. K. Nandy and D. N. Mazumder, Int. J. Prev. Med., 2014, 5, 89–98 Search PubMed.
- Y. Xu, H. Wang, Y. Wang, Y. Zheng and G. Sun, Toxicol. Lett., 2010, 195, 44–50 CrossRef CAS PubMed.
- S. Mukherjee, M. Roy, S. Dey and R. K. Bhattacharya, J. Clin. Biochem. Nutr., 2007, 41, 32–42 CrossRef CAS PubMed.
- J. Wen, Y. Zhang, X. Chen, L. Shen, G. C. Li and M. Xu, Biochem. Pharmacol., 2004, 68, 323–331 CrossRef CAS PubMed.
- P. Jones and A. Suggett, Biochem. J., 1968, 110, 621–629 CAS.
- L. D. DeLeve and N. Kaplowitz, Pharmacol. Ther., 1991, 52, 287–305 CrossRef CAS.
- J. P. Buchet and R. Lauwerys, Biochem. Pharmacol., 1988, 37, 3149–3153 CrossRef CAS.
- M. Kessel, S. X. Liu, A. Xu, R. Santella and T. K. Hei, Mol. Cell. Biochem., 2002, 234–235, 301–308 CrossRef.
- E. T. Snow, Pharmacol. Ther., 1992, 53, 31–65 CrossRef CAS.
- A. Mukherjee, M. K. Sengupta, M. A. Hossain, S. Ahamed, B. Das, B. Nayak, D. Lodh, M. M. Rahman and D. Chakraborti, J. Health Popul. Nutr., 2006, 24, 142–163 Search PubMed.
- C. Teyssier, L. Guenot, M. Suschetet and M. H. Siess, Drug Metab. Dispos., 1999, 27, 835–841 CAS.
- E. Abdella and M. Gad, Iran. J. Cancer Prev., 2008, 1, 95–109 CAS.
Footnote |
† Electronic supplementary information (ESI) available. See DOI: 10.1039/c4ra00338a |
|
This journal is © The Royal Society of Chemistry 2014 |
Click here to see how this site uses Cookies. View our privacy policy here.