Quantitative investigations of thermal and photoinduced J- and H-aggregation of hydrophobic spirooxazines in binary solvent through UV/vis spectroscopy

A. V. Metelitsa*ab, C. Coudreta, J. C. Micheaua and N. A. Voloshinc
aIMRCP, UMR 5623, Université P. Sabatier, Toulouse 3, F-31062 Toulouse Cedex, France
bInstitute of Physical Organic Chemistry, Stachki Av.194/2, 344090 Rostov on Don, Russia. E-mail: met@ipoc.rsu.ru
cSouthern Scientific Centre of Russian Academy of Science, Chekhova Str., 41, 344006, Rostov on Don, Russia

Received 24th March 2014 , Accepted 29th April 2014

First published on 30th April 2014


Abstract

The aggregation of two hydrophobic spirooxazine dyes has been investigated in water–acetonitrile binary solvent and in presence of sodium dodecylsulfate (SDS). For the thermochromic molecule 1, aggregation is spontaneous and occurs when a large amount of water is added to an acetonitrile solution of the dye. There exists an optimum value of the water–acetonitrile molar ratio giving rise to a sharper H-aggregate visible absorption spectrum. Kinetic analysis of the H-aggregate formation has shown that there is an increase in the sticking probability of the monomers, as the aggregates grow. A subtle interplay between H- and J- aggregation was witnessed by adding small amounts of SDS. This change is so sensitive that this system could be the basis of a new chemosensory technique for SDS assessment. Excess of surfactant induces the collapse of the aggregates and the re-dissolution of the dye under the form of a merocyanine–SDS ion-pair. For the spirooxazine 2, aggregation must be photo-induced. Comparison of the spectral evolutions of the two dyes in the presence of SDS has shown that the opening of the closed spirooxazines paves the way to the merocyanine–SDS ion-pair formation. Reversibility of the aggregation has been suggested to occur when the aggregate size is still small. Finally, reversibility has been checked experimentally by precipitate re-dissolution and spirooxazine recovery. Possible structures and reactivity of the H- and J-aggregates have been deduced.
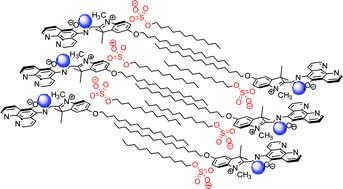

Introduction

The rising interest in the preparation of organic nanocrystals has spurred new research aimed at the understanding of organic molecule aggregation.1 The classic route to prepare such crystals is based on an abrupt change in a solvent composition, switching the solubility of the organic compound of interest from high to poor.2 When polar compounds are used, electrostatic forces compensation leads to two kinds of aggregates: the so-called H-aggregates with a head-to-tail molecular arrangement, and the J-aggregates in which molecules are arranged as bricks in a wall.3 Electronic absorption features are strongly modified upon aggregation as molecular transition moments will be coupled according to the molecular organization. Thus in the ideal case, in the so-called J-aggregates all the main transition moments of the monomers are parallel and the angle between the transition moment and the line joining the molecular centers is zero. This strong coupling between several self-similar monomers gives rise to a coherent absorption at a red-shifted wavelength relatively to the monomer. The corresponding absorption band becomes narrow due to the lack of vibrational coupling to the molecular modes. On the other way round, in H-aggregates the strong coupling between pairs of anti-parallel transition moments results in a global transition moment perpendicular to the line of centers and with a blue-shifted absorption band.4 Thus, a convenient UV/visible monitoring of the aggregating mixture could be able to give structural and kinetic information in a single study.5 Control of the J- or H-aggregation pattern can be achieved through substituent dressing such as adding hydrophobic tails.6 Surfactants or ionic polymers can also play the role of matrix molecules to promote a specific aggregation through the formation of ion-pairs.7 Self-assembled molecular aggregates of dyes formed by non-covalent interactions have interesting aspects such as photoconductivity, planar anisotropy or nonlinear optical properties.8 Aggregates can be successfully used in solar cells,9 ultrafast optical switches and optical systems for information processing.10

Since their discovery in 1961, photochromic spirooxazines11 have been synthesized in large number and the area of their practical applications has been significantly widened. For instance, the prospects to employ spirooxazines molecules as optical switches12 or photochromic chemosensors13 are still under survey. As their spiropyran analogues,14 these compounds undergo a ring-opening reaction, either spontaneously or with a light activation, converting the weakly polar spiro-form (SPO) into the dipolar merocyanine (MC) form (Scheme 1).


image file: c4ra02587c-s1.tif
Scheme 1

The position of the SPO ⇄ MC equilibrium depends strongly on the dielectric properties of the solvent. In a similar way to spiropyrans,15 polar merocyanine MC forms of spirooxazines tend to associate into stack-like aggregates.16 The photochromic and solvatochromic behaviour of spirooxazines bearing O-alkyl long-chain substituents at the 5-position on the indoline part has been investigated in polar and non-polar solvents.17 In spirooxazine 1, the 5-O-alkyl substituent and the phenanthroline part pushes and pulls the electrons from the indoline side towards the phenanthroline moiety stabilizing the zwitterionic character within the highly conjugated photomerocyanine isomer.18 Thus, in a polar solvent such as acetonitrile, the MC form of 1 represents 30% of the dissolved dye. Although the CN group of the spirooxazine 2 is also electron-withdrawing, the MC form is negligible (<3%) and its production requires a photochemical activation.

image file: c4ra02587c-u1.tif

image file: c4ra02587c-u2.tif

In this paper, we investigate the aggregation behaviour of the amphiphilic photochromic spirooxazine dyes 1 and 2 in water–acetonitrile binary mixtures and in presence of sodium dodecylsulfate anionic surfactant (SDS) by means of UV-visible absorption spectroscopy. The present study provides new insight into the relationship between the spirooxazine aggregation state and the composition of the solvent. Kinetic analysis of the H-aggregates formation of spirooxazine 1 has demonstrated that the monomers sticking probability increases as the aggregates grow. A delicate interchange between the H- and J-aggregates has been observed in presence of a small concentration of SDS. This change is still very significant for SDS concentrations less than CMC/1000. Comparison with spirooxazine 2 whose aggregation must be photo-induced even in presence of SDS, has shown that the opening of the spiro-form of 1 is linked to the merocyanine–SDS ion-pair formation and consequently to the aggregation. Reversibility of the aggregation has been suggested to occur when the aggregate size is still small. Possible structures and reactivity of the H- and J-aggregates have been assumed from the semi-quantitative analysis of the recorded spectroscopic data.

Experimental section

Materials methods characterization

Products (molecules and solvents).
Products. Phenanthroline-containing spirooxazine 1 was prepared by coupling 6-hydroxy-5-nitroso-1,10-phenanthroline with substituted 2,3,3-trimethyl-3H-indolium iodides. 6′-CN-substituted spironaphthoxazines 2 was synthesised by reaction of 5-hexadecyloxy-2-methylene-1,3,3-trimethylindoline (Fischer's base) with the amino-naphthol. Detailed syntheses according to a previously described method are given in the paper.19 Acetonitrile (MW = 41.05; d = 0.786) from Acros Organics was of the highest spectroscopic grade (transmission at 193 nm >60%). Water was provided by a Milli-Q system; it was filtered by a 0.22 μm membrane and exhibited a resistivity >18 MΩ cm at 25 °C.

UV/visible spectrophotometry

The absorption spectra and photokinetic data measurements were performed using an Ocean Optics fiber optic diode array spectrophotometer fitted with a thermostated block enabling simultaneous crossed beam operation. The photochemical irradiation was derived from a 200 W high pressure mercury lamp equipped with interference filters allowing transmission of a selected single emission line.

Typical experimental procedure

To yield the aggregates, an aliquot of thermostated pure water was added to a thermostated acetonitrile solution of spirooxazine in a 1 cm × 1 cm cuvette. The cuvette was immediately shaken and placed into the thermostated cell for spectral recording. Gentle stirring was supplied by a magnetic flea. All experiments were carried-out at 25 °C.

Calculations details

Parameter estimations have been carried-out using a well-established curve fitting procedure based on a parameter optimization Powell method.

Results and discussion

Water triggered H-aggregation

The aggregation was induced by adding pure water to an acetonitrile solution of the dye. In a first set of experiments we allowed the mixture to rest for 600 s before recording the absorption spectrum. This delay was sufficient to reach a pseudo-equilibrium situation where the system was stable for several hours or even days before decantation or precipitation. Fig. 1 shows that the aggregation process is very sensitive to the composition of the H2O–CH3CN binary solvent.20 If the water molar ratio was too low (i.e. Xw < 89%) the aggregation did not occur, the recorded spectrum was that of the free merocyanine (spectrum 1). Above this threshold the absorption spectrum shows several new features: as the water content increases (spectrum 2) a broad absorption peaking at around 490 nm replaces the 610 nm free dye. As the amount of water attains Xw ≈ 94% the spectrum get simpler. The sharp band at 520 nm is attributed to the formation of H-aggregates (spectrum 3). This water content seems to be an optimum value around which the spectrum of the H-aggregates is higher and narrower. For higher water contents, the spectra are broadened again and it appears around 625–640 nm a low energy band which is reminiscent to the presence of J- aggregates (spectra 4–6).
image file: c4ra02587c-f1.tif
Fig. 1 Variation of the absorption spectra of 1 ([C] = 2.1 × 10⁻⁵ mol L−1) in H2O–CH3CN binary solvent at various water molar ratio: 88.2% (1), 90.2% (2), 93.9% (3), 95.5% (4), 97.1% (5), 98.6% (6). All spectra were recorded at 293 K, 600 s after mixing.

Using the optimal water–acetonitrile molar ratio, several interesting features of the aggregates have been found. Linear absorbance vs. absorbance diagrams21 i.e. Abs(λi) vs. Abs(λj) (see ESI) have shown that within a more than 10 times concentration range, there are no spectral variations; the same spectral shape is always witnessed. The aggregates appear stable and their structure is controlled by the water content of the binary solvent. Fig. 2 shows that the aggregates obey to the Beer's law. The absorbance is strictly proportional to the concentration with an apparent molar extinction coefficient around 35[thin space (1/6-em)]000 L mol−1 cm−1.


image file: c4ra02587c-f2.tif
Fig. 2 (a) Variation of the absorption spectra of spirooxazine 1 aggregates in a H2O–CH3CN binary solvent (Xw = 93.9%) at various concentrations: 4.1 × 10⁻⁶ (1), 5.4 × 10⁻⁶ (2), 7.0 × 10⁻⁶ (3), 1.1 × 10⁻⁵ (4), 1.7 × 10⁻⁵ (5), 2.1 × 10⁻⁵ (6), 5.9 × 10⁻⁵ mol L−1 (7). Spectra were recorded after 600 s at 293 K. (b) Estimation of the apparent molar extinction coefficient of the aggregates.

Kinetic studies

Kinetic analysis of the aggregation phenomenon22 was undertaken with an appropriate water content to favour H-aggregation. Fig. 3 shows the spectral evolution of the resulting mixture when water was rapidly mixed with an initial solution of spirooxazine 1 in acetonitrile, in order that the final water molar ratio Xw was 94%. After mixing, the merocyanine band at 630 nm decreases while an intense band is growing at 520 nm with the presence of a quasi-isosbestic point at 555 nm. The new band appears more intense, narrower (with a full width at half maximum around 70 nm) and blue shifted (λmax = 510 nm) when compared to the initial free open merocyanine band (FWHM ≈ 112 nm and λmax = 625 nm). Its size is in agreement with the previously determined apparent molar extinction coefficient. After several hours or by lowering the temperature, an opalescent precipitate appeared. Isolation of this precipitate and further re-dissolution in pure acetonitrile gave back the starting spectrum of 1. Such behaviour is reminiscent to the UV-assisted formation of nanoaggregates from photochromic spiropyrans in nonpolar solvents.23
image file: c4ra02587c-f3.tif
Fig. 3 Absorption spectra of a solution of 1 (1.03 × 10⁻⁵ mol L−1) in: (a) pure acetonitrile and (b to g) in a H2O–CH3CN mixture (Xw = 94%) at 293 K; (b) 90 s, (c) 120 s, (d) 150 s, (e) 180 s, (f) 230 s, (g) 290 s and (h) 590 s after water addition.

In order to probe the aggregation process of 1 in H2O–CH3CN binary solvent in detail, a series of Abs(λi) vs. Abs(λj) diagrams have been plotted from Fig. 3 (see ESI). From the examination of the values of their linear regression coefficients, it was confirmed that only one linear independent step was taking place during the aggregation step. Within this time interval, the MC open merocyanine is converted into an aggregated species, the spectrum of which remaining unchanged during the whole process. In other words, a unique monitoring wavelength was sufficient to analyse the kinetics of the H-aggregation.

The evolution of the blue-shifted band has been monitored at 510 nm, it is displayed on Fig. 4a. The typical S-shaped curve with a time-lag is evocative to those registered by Pasternack et al.24 during the formation of organized assemblies of trans-bis(N-methylpyridinium-4-yl)diphenylporphine on the surface of calf thymus DNA, by Shields et al.25 in the aggregative growth of thiolate capped gold nanocrystals or by Finney et al.26 in the aggregation of gold nanoclusters. This time-dependent behaviour features two regimes. It is likely that the early stage is dominated by an autocatalytic-like mechanism. On the contrary, after the crossover, a slowing-down, relaxation-like evolution takes place. Once a pseudo-equilibrium have been reached, the system remained stable for several hours. Such a rather long-term stability rules-out a fast Ostwald-ripening process.27 Fig. 4b is a plot of the normalized rate of aggregation (i.e. in s−1) = (dAbs/dt)/(Absinf − Abs0) versus the conversion (Abs − Abs0)/(Absinf − Abs0), where Abs0 is the absorbance at time t = 0 i.e. just after water addition and Absinf the absorbance at the pseudo-equilibrium. At the beginning of the acceleration zone (a), dAbs/dt = 0, then the rate subsequently rises, passes through a maximum, declines, and returns to zero. Straight line (b) is a strong indication that the final evolution is 1st-order-like with a rate constant (from the slope) around 0.02 s−1. Note also the value of the conversion (0.06) at the turn-on point after the short acceleration.


image file: c4ra02587c-f4.tif
Fig. 4 (A) Evolution of the absorbance monitored at 510 nm during the aggregation process of a 1.03 × 10⁻⁵ mol L−1 solution of 1 in H2O–CH3CN binary solvent (Xw = 94%). Continuous line: fitting by a Skrdla model (see below). (B) Model-free analysis showing the two phases of the aggregation process: a fast acceleration (a) is followed by a slow relaxation (b).

To get a deeper insight into the aggregation kinetic process, a modeling has been carried-out. A promising approach to this kinetic analysis of assembly formation could be the consideration of a series of equations involving stepwise monomer addition.28

M + Ai → Ai+1

However, although simple, this assumption rapidly gives rise to awkward mathematics. Even, numerical integrations are challenging due to a parameter identification problem. Consequently, various simpler aggregation kinetic models based on a unique equation that can be retrieved from a literature analysis have been scrutinized.

Bibliography examination has revealed that the modeling of similar kinetic curves recorded during nano-crystallization of polymers, amorphous Mg–Ni alloys or zeolites has been thoroughly investigated by Finney et al.29 Their paper provides a numerical comparison of the so-called Avrami–Efore'ev30 (AE) equation which is currently used to describe the kinetics of phase transition and crystallization and the Finke–Watzky31 (FW) equation which is based on a simple quadratic autocatalytic process. On the other hand, Skrdla32 has recommended a distinct integrated equation to analyze the catalytic hydrogenation of cyclohexene during a transition-metal nanocluster formation (SK equation). The main feature of these three semi-empirical integrated equations is that they contain only two kinetic parameters. Therefore, we have considered that according to the Ockham's razor principle of parsimony,33 such models seemed truly appealing for our purpose. Both, the Pasternack34 equation for the kinetics of assembly of DNA bound porphyrins and the Monsu-Scolaro35 equation for the fractal aggregation of dyes include four kinetic parameters. Therefore, they have not been considered in our specific case to avoid over-fitting situations. Our calculations have allowed the rejection of the Avrami–Efore'ev and Finke–Watzky equations (see ESI). On the other side, satisfactory fittings have been obtained with the Skrdla “deceleratory” equation (see Fig. 4A) which is written as:

Y = exp{αt[exp(−βt2) − 1]}

It corresponds to a first-order mechanism having a time-dependent rate coefficient. This dispersive kinetic equation is based on a Maxwell–Boltzmann distribution of activation energies. In the present case, it is labelled as “deceleratory” because it relates to a skewed distribution towards the higher energies. The so-called “rate constants” are variable because they match to dissimilar spatial locations inside each growing nanoparticle. The two fitting parameters, α = 0.017 s−1 and β = 8.3 × 10⁻⁴ s−2 have been obtained. From the point of view of their physical significance, α is related to the traditional rate constant linked to a unique activation enthalpy of the aggregation. For instance, the value α = 0.017 s−1 is fully consistent with the apparent relaxation time constant estimated from the part (b) of the Fig. 4B (0.02 s−1). It is likely to be related to a diffusion-limited aggregation mechanism. On the other hand, β is responsible for the sigmoïdal shape of the kinetic curve. It corresponds to a reaction limited aggregation with a time-dependent activation entropy. The observed acceleration can be interpreted by an increase of the number of accessible sticking positions due to the increasing critical nucleus size. All the details of the kinetic curve fitting procedure are gathered in the ESI.

Effect of SDS on the water induced aggregation

A very different behavior was observed when the added water contained sodium dodecylsulfate (SDS). Simultaneously to the formation of the expected H-aggregates at 510 nm, there was an increase of a narrow red-shifted band at 668 nm.

In a similar way as for the previous kinetic study, Fig. 5 has been submitted to an Abs vs. Abs diagram analysis using 6 manually selected wavelengths taking into account the peaks, the shoulders and the valleys exhibited on all the spectra from 360 to 670 nm. The first significant result is the presence of an excellent linear correlation (R > 0.999) between Abs (510) and Abs (668). Such a correlation is a strong indication that the new band which is assumed to be J-aggregates36 grows simultaneously with H-aggregates. Secondly, the evolution of the former open merocyanine band monitored at 512 and 617 nm seems disconnected to the global aggregation behaviour. Contrarily to the continuous decrease observed on Fig. 3, the absorbance does not vary significantly within this band. (see ESI for more details). A possible explanation is the presence of a third intermediate species. In the present case, it is likely that it could be the tight ion pair between the anionic head of the dodecylsulfate and the partially positive indolinic moiety of the O-alkyl phenanthroline merocyanine 1. Like in catanionic structures, the surfactant's alkyl chain is expected to organize itself with the hexadecyloxy moiety of the indolenin (see Fig. 10). In the same way that in pure water, the kinetics of aggregation has been investigated in presence of SDS. However, in this particular case, there is no time-lag between the rapid mixing of the aqueous SDS and the starting-up of the aggregation. The curve has been fitted by the same Skrdla deceleratory equation but with different values for the two fitting parameters: α = 0.014 s−1 and β = 0.2 s−2. Keeping in mind that α correlates with a unique activation enthalpy of aggregation, it is interesting to point-out that it lies within the same order of magnitude than in absence of SDS (α = 0.017 s−1). On the other hand, β is two orders of magnitude higher (0.2 vs. 8.3 × 10⁻⁴). Such a value for a parameter linked to the activation entropy of aggregation is likely to be related to the gain of entropy during the release of the water caging molecules when the alkyl chains of SDS and 1 become more ordered.


image file: c4ra02587c-f5.tif
Fig. 5 Evolution of the absorption spectra of 1 solution ([C] = 1.8 × 10⁻⁵ mol L−1) in a water rich mixture of H2O and CH3CN (Xw = 98.2%) in the presence of surfactant ([SDS] = 10−4 mol L−1) at 293 K. (1) 2 s, (2) 5 s, (3) 10 s; (4) 15 s, (5) 20 s, (6) 25 s and (7) 30 s after mixing.

Another remarkable feature of the SDS induced aggregation is shown of Fig. 6. The final ratio of H- vs. J-aggregates of 1 is highly sensitive to the SDS concentration.


image file: c4ra02587c-f6.tif
Fig. 6 Variation of the absorption spectra of a solution of 1 ([C] = 2.4 × 10⁻⁵ mol L−1) in a water rich binary solvent H2O–CH3CN (Xw = 93.9%) at various SDS concentration: (1) 0, (2) 2.3 × 10⁻⁶, (3) 2.6 × 10⁻⁶, (4) 3.8 × 10⁻⁵, (5) 1.5 × 10⁻³, (6) 1.8 × 10⁻³, (7) 2.3 × 10⁻³, (8) 2.6 × 10⁻³ mol L−1. m: in pure methanol solution. All spectra were recorded 300 s after mixing at 293 K.

In Fig. 6A, a significant change of this ratio is occurring between spectra (1) and (4). There is a turning point when the SDS concentration matches the concentration of 1 suggesting that a 1[thin space (1/6-em)]:[thin space (1/6-em)]1 ion-pair is involved. In Fig. 6B, the typical blue-shifted band of the H-aggregates disappears when the SDS concentration has reached 1.5 × 10⁻³ mol L−1. However, increasing more the SDS concentration leads to a collapse of the J-aggregates and the recovery of a spectrum reminiscent to the free merocyanine open form of 1. But, a careful comparison of spectrum (8) with those of the free merocyanine in methanol solution (m) shows that it is broader (FWMH = 130 vs. 70 nm) although the main peaks or shoulders were lying at the same wavelength (573 and 609 nm). It is likely that the spectrum (8) corresponds to a ion pair 1–SDS dispersed in some pre-micellar SDS aggregates. This result confirms the conclusion of the Abs-diagram analysis of Fig. 6, namely the presence of an intermediate 1–SDS ion-pair during the aggregation process.

Fig. 7 shows the high sensitivity of this system to small SDS concentrations. Therefore, this system could be the basis of a SDS micro-quantitation device. The idea is to estimate the interchange between H- and J-aggregates by plotting the ratio between Abs668 and Abs510 vs. [SDS].


image file: c4ra02587c-f7.tif
Fig. 7 Variation of the ratio Abs668/Abs510 taken after mixing 5 volumes of an aqueous SDS solution into 1 volume of a 2.4 × 10⁻⁵ mol L−1 acetonitrile solution of 1 (Xw = 93.6%). Absorbances have been determined at 293 K 300 s after mixing.

This result is promising since SDS concentrations less than CMC/4000 could be assessed without the need of a previous liquid–liquid extraction as in standard methods.37

Photo-induced versus spontaneous aggregation in presence of SDS

On the contrary to the spirooxazine 1, no colored aggregates were found in water–acetonitrile mixture of the cyano-naphthooxazine 2 even in the presence of SDS. However such a mixture was responsive to a UV-light stimulus. Fig. 8 shows the time evolution of its absorption during UV irradiation.
image file: c4ra02587c-f8.tif
Fig. 8 Evolution of the UV/visible absorption spectra of a 2 solution ([C] = 1.2 × 10⁻⁴ mol L−1) in a H2O–CH3CN binary solvent (Xw = 92.1%) in the presence of SDS ([C] = 10−4 mol L−1) at 293 K under variable 365 nm irradiation times. (0) 0, (1) 100 s, (2) 200 s, (3) 300 s, (4) 460 s, (5) 620 s, (6) 780 s, (7) 940 s, (8) 1100 s.

Careful examination of Fig. 8 shows that the spectral shape is slightly changing even at the beginning of the irradiation (spectra (1–3)), indicating that aggregation has already started. Prolongation of the irradiation (spectra (4–8)) gives rise to the appearance of the H- and J-aggregates at 519 and 673 nm respectively. Similarly to 1, Abs vs. Abs diagrams of Fig. 8 show the simultaneous formation of the H- and J-aggregates and the presence of an intermediate species at 609 nm (see ESI). A comparison between 1 and 2 is particularly interesting. As the aggregates bands are fairly narrow, spectral overlap is not so severe and we can assume that the 609–617 nm absorbance correspond mainly to the merocyanine–SDS ion pair and the 668–673 nm to the J-aggregates. It was instructive to put side by side the evolution of the J-aggregates and the ion-pair intermediate in case of the spontaneous (1) and photo-induced (2) aggregations. Fig. 9A shows that for 1 the absorbance at 617 nm is quasi constant during the fast spontaneous aggregation. The lack of evolution of the 1–SDS ion-pair is the result of the thermochromic equilibrium. The consumed merocyanine is continuously replenished. On the other hand, Fig. 9B shows that for 2 the absorbance at 609 nm parallels the slow photo-induced aggregation. However, after 500 s of UV irradiation, their evolutions diverge; the 609 nm absorbance goes to a steady state while the aggregation continues to grow. This last situation occurs when the photochromic equilibrium has reached a steady-state and behaves similarly to the thermochromic equilibrium: the consumed merocyanine is again continuously replenished by the photochromic equilibrium. At the early stages of irradiation, when the 2–SDS ion-pair and the aggregates parallels there is a fast exchange between the free and aggregated ion-pairs. This assumption is strongly supported by the lack of induction period of the aggregation in presence of SDS where both the ion-pair formation and the hydrophobic interactions contribute to the aggregation. It is possible that this fast exchange was also occurring on 1. When the photo-induced aggregation of 2 has been fitted by the Skrdla deceleratory equation, the two parameters α = 0.007 s−1 and β = 0.2 s−2 have been extracted. If the α parameter is mainly related to a photochemical rate constant, i.e. to the absorbed photon flux, the β values deserve to be compared (β = 3.85 for 1 and 0.2 for 2). This is an indication that the activation entropy of aggregation is lower for 2. Because, a weaker π–π interaction and concomitantly a smaller aggregation constant could be expected for smaller-sized π-systems than for the larger one, replacement of the phenanthroline in 1 by a naphthyl in 2 makes the stacking less favourable.38


image file: c4ra02587c-f9.tif
Fig. 9 Comparison of the evolutions of the ion-pair (609–617 nm) and the J-aggregates (668 nm) absorption bands for 1 (spontaneous aggregation) and 2 (photo-induced aggregation).

After prolonged irradiation of the solution (over 3000 s), opalescence appears in the solution, then precipitation occurs. Separation and re-dissolution of this precipitate in toluene recovers the initial spirooxazine 2 and thus demonstrates the reversibility of the aggregation processes.

Structures and domains of aggregation

The presence of an optimal value of the water molar ratio (about 94%) deserves a short discussion. Mass spectroscopy of binary high water content H2O–CH3CN binary solvent has shown the presence of magic H2O–CH3CN number at 21[thin space (1/6-em)]:[thin space (1/6-em)]1 and 21[thin space (1/6-em)]:[thin space (1/6-em)]2. Amazingly, these clusters corresponding at Xw = 95 and 91% respectively39 i.e. a molar ratio very close to the optimum. Therefore, it is possible that these clusters mold the structure of the aggregates. Hydrophobic long chains are prone to be arranged within an acetonitrile-rich layer surrounded by layers of clustered water close to the polar heads. Taking into account an X-ray structural analysis of a crystallised spiropyran merocyanine hydrate40 it is also expected that few free water molecules are allowed to stand within the polar pocket, i.e. between the methyl on the indolinic and the phenolic oxygen. Their role is to stabilize the whole stacks as the dipolar character is only partial. Considering that their absorption band is blue-shifted, it is expected that the H-aggregates exhibit a noticeable stacking.41 In presence of anionic dodecylsulfate, ion pairs are created with the partially positive indolinic moiety of the merocyanines 1 and 2. Moreover, hydrophobic interactions make possible a parallel organization between the surfactant's alkyl chain and the hexadecyloxy substituent of the indolenin such as in a catanionic structure. Considering that their absorption band is red-shifted, it is expected that the J-aggregates exhibit a marked head-to-tail arrangement.

On Fig. 10, we gather the domains of predominance of the various aggregate as a function of the SDS concentration and we have drawn the schematic structures of the H- and J-aggregates elementary blocks.


image file: c4ra02587c-f10.tif
Fig. 10 Schematic structures of the H-, J-aggregates and dispersed ion-pairs. The blue ball stands for the water molecule within the polar pocket. The domains of predominance are: H-aggregates: [SDS] < 10−7 mol L−1; J-aggregates: 10−6 < [SDS] < 2 × 10⁻³ mol L−1; dispersed ion-pairs: [SDS] > 2.5 × 10⁻³ mol L−1.

Conclusion

For the first time, the solvent and surfactant induced aggregation of two hydrophobic spirooxazines has been investigated by UV/visible spectroscopy. This compound is very sensitive to the water content in H2O–CH3CN binary solvent. Aggregation occurs when a large amount of water is added in an acetonitrile solution of the dye. It exist an optimum value of the water–acetonitrile molar ratio giving rise to the sharper H-aggregate visible absorption spectrum. A balance between H- and J-aggregates has been observed in presence of SDS anionic surfactant. Excess of surfactant induces the collapse of all the aggregates and the re-dissolution of the dye under the form of a merocyanine–SDS ion-pair. The observed high sensitivity of aggregation processes to the presence of SDS could be the basis of a technique for aqueous anionic surfactants assessment.

For the thermochromic spirooxazine 1, the aggregation is spontaneous and does not need to be light-triggered due to the ground-state large amount of open merocyanine. On the contrary, aggregation of 2 must be photo-induced. Careful comparison of the spectral evolution of the two dyes in presence of SDS has shown the feeding of the aggregation by the opening of the closed spirooxazines through the involvement of an ion-paired merocyanine intermediate. H- and J-aggregates grow simultaneously. Reversibility of the aggregation has been suggested at the early time (i.e. when the aggregate size is still small) and has been checked experimentally by precipitate re-dissolution. Structures for the observed aggregates are proposed in agreement with the provided data.

References

  1. (a) J. R. G. Sander, D. K. Bucar, J. Baltrusaitis and L. R. MacGillivray, J. Am. Chem. Soc., 2012, 134, 6900–6903 CrossRef CAS PubMed ; (b) S. Fery-Forgues, Nanoscale, 2013, 5, 8428–8442 RSC .
  2. H. Kasai, H. S. Nalwa, H. Oikawa, S. Okada, H. Matsuda, N. Minami, A. Kakuta, K. Ono, A. Mukoh and H. Nakanishi, Jpn. J. Appl. Phys., 1992, 31, 1132–1134 CrossRef .
  3. (a) E. E. Jelley, Nature, 1936, 138, 1009–1010 CrossRef CAS ; (b) G. Scheibe, L. Ikandler and H. Ecker, Naturwissenschaften, 1937, 25(1937), 75 CrossRef CAS ; (c) A. Eisfeld and J. S. Briggs, Chem. Phys., 2006, 324, 376–384 CrossRef CAS PubMed ; (d) F. Würthner, T. E. Kaiser and C. R. Saha-Möller, Angew. Chem., Int. Ed., 2011, 50, 3376–3410 CrossRef PubMed .
  4. N. C. Maiti, S. Mazumdar and N. Periasamy, J. Phys. Chem. B, 1998, 102, 1528–1538 CrossRef CAS .
  5. J. C. Micheau, G. V. Zakharova and A. K. Chibisov, Phys. Chem. Chem. Phys., 2004, 6, 2420–2425 RSC .
  6. G. J. Ashwell, K. Skjonnemand, G. A. N. Paxton, D. W. Allen, J. P. L. Mifflin and X. Li, J. Mater. Chem., 2001, 11, 1351–1356 RSC .
  7. Y. Hirano, S. Tateno and Y. Ozaki, Langmuir, 2007, 23, 7003–7013 CrossRef CAS PubMed .
  8. (a) K. Ikegami, C. Mingotaud and M. Lan, J. Phys. Chem. B, 1999, 103, 11261–11268 CrossRef CAS ; (b) E. Rousseau, M. M. Koetse, M. Van der Auweraer and F. C. De Schryver, Photochem. Photobiol. Sci., 2002, 1, 395–406 RSC .
  9. Y. Hirano, Y. F. Miura, M. Sugi and T. Ishii, Colloids Surf., A, 2002, 198–200, 37–43 CrossRef CAS .
  10. M. Matsumoto, J. Photochem. Photobiol., A, 2003, 158, 199–203 CrossRef CAS .
  11. V. Lokshin, A. Samat and A. V Metelitsa, Russ. Chem. Rev., 2002, 71, 893–916 CrossRef CAS PubMed .
  12. G. Berkovic, V. Krongauz and V. Weiss, Chem. Rev., 2000, 100, 1741–1753 CrossRef CAS PubMed .
  13. (a) R. A. Kopelman, S. M. Snyder and N. L. Frank, J. Am. Chem. Soc., 2003, 125, 13684–13685 CrossRef CAS PubMed ; (b) R. A. Kopelman, M. M. Paquette and N. L. Frank, Inorg. Chim. Acta, 2008, 361, 3570–3576 CrossRef CAS PubMed ; (c) Z. Tian, R. A. Stairs, M. Wyer, N. Mosey, J. M. Dust, T. M. Kraft and E. Buncel, J. Phys. Chem. A, 2010, 114, 11900–11909 CrossRef CAS PubMed ; (d) S. V. Paramonov, V. Lokshin and O. A. Fedorova, J. Photochem. Photobiol., C, 2011, 12, 209–236 CrossRef CAS PubMed ; (e) H. Nishikiori, T. Takamura, S. Shimamura and T. Fujii, J. Photochem. Photobiol., A, 2011, 222, 236–240 CrossRef CAS PubMed .
  14. R. Klajn, Chem. Soc. Rev., 2014, 43, 148–184 RSC .
  15. (a) Y. Kalisky and D. J. Williams, Chem. Phys. Lett., 1982, 86, 100–104 CrossRef CAS ; (b) T. Seki and K. Ichimura, J. Phys. Chem., 1990, 94, 3769–3775 CrossRef CAS ; (c) A. Miyata, D. Heard, Y. Unuma and Y. Higashigaki, Thin Solid Films, 1992, 210–211, 175–177 CrossRef CAS ; (d) Z. Qiu, H. Yu, J. Li, Y. Wang and Y. Zhang, Chem. Commun., 2009, 3342–3344 RSC ; (e) O. Ivashenko, J. T. van Herpt, B. L. Feringa, P. Rudolf and W. R. Browne, Langmuir, 2013, 29, 4290–4297 CrossRef CAS PubMed ; (f) L. Florea, S. Scarmagnani, F. Benito-Lopez and D. Diamond, Chem. Commun., 2014, 50, 924–926 RSC .
  16. (a) V. I. Minkin, Chem. Rev., 2004, 104, 2751–2776 CrossRef CAS PubMed ; (b) E. B. Gaeva, A. V. Metelitsa, N. A. Voloshin, V. Pimienta and J. C. Micheau, ARKIVOC, 2005, 7, 18–27 CrossRef .
  17. A. V. Metelitsa, J. C. Micheau, N. A. Voloshin, E. N. Voloshina and V. I. Minkin, J. Phys. Chem. A, 2001, 105, 8417–8422 CrossRef CAS .
  18. A. V. Metelitsa, V. Lokshin, J. C. Micheau, A. Samat, R. Guglielmetti and V. I. Minkin, Phys. Chem. Chem. Phys., 2002, 4, 4340–4345 RSC .
  19. N. A. Voloshin, A. V. Metelitsa, J.-C. Micheau, E. N. Voloshina, S. O. Bezuglyi, N. E. Shelepin, V. I. Minkin, V. V. Tkachev, B. B. Safoklov and S. M. Aldoshin, Russ. Chem. Bull., Int. Ed., 2003, 52, 2038–2047 CrossRef CAS .
  20. (a) D. N. Shin, J. W. Wijnen, J. B. F. N. Engberts and A. Wakisaka, J. Phys. Chem. B, 2002, 106, 6014–6020 CrossRef CAS ; (b) E. B. Gaeva, V. Pimienta, A. V. Metelitsa, N. A. Voloshin, V. I. Minkin and J. C. Micheau, J. Phys. Org. Chem., 2005, 18, 315–320 CrossRef CAS .
  21. (a) H. Mauser and G. Gauglitz, Photokinetics, Theoretical Fundamentals and Applications, Elsevier, Amsterdam, 1998 Search PubMed ; (b) J. Polster and H. Dithmar, Phys. Chem. Chem. Phys., 2001, 3, 993–999 RSC .
  22. Y. Li, J. Zhou, Y. Wang, F. Zhang and X. Song, J. Photochem. Photobiol., A, 1998, 113, 65–72 CrossRef CAS .
  23. (a) P. Uznanski, Synth. Met., 2000, 109, 281–285 CrossRef CAS ; (b) P. Uznanski, Langmuir, 2003, 19, 1919–1922 CrossRef CAS .
  24. R. F. Pasternack, C. Fleming, S. Herring, P. J. Collings, J. dePaula, G. DeCastro and E. J. Gibbs, Biophys. J., 2000, 79, 550–560 CrossRef CAS .
  25. S. P. Shields, V. N. Richards and W. E. Buhro, Chem. Mater., 2010, 22, 3212–3225 CrossRef CAS .
  26. E. E. Finney, S. P. Shields, W. E. Buhro and R. G. Finke, Chem. Mater., 2012, 24, 1718–1725 CrossRef CAS .
  27. F. Wang, V. N. Richards, S. P. Shields and W. E. Buhro, Chem. Mater., 2014, 26, 5–21 CrossRef CAS .
  28. R. Michels, Y. Hertle, T. Hellweg and K. Huber, J. Phys. Chem. B, 2013, 117, 15165–15175 CrossRef CAS PubMed .
  29. E. E. Finney and R. G. Finke, Chem. Mater., 2009, 21, 4692–4705 CrossRef CAS .
  30. (a) M. Avrami, J. Chem. Phys., 1939, 7, 1103–1112 CrossRef CAS PubMed ; (b) M. Avrami, J. Chem. Phys., 1940, 8, 212–224 CrossRef CAS PubMed ; (c) M. Avrami, J. Chem. Phys., 1941, 9, 177–184 CrossRef CAS PubMed ; (d) B. V. Erofe'ev, Dokl. Akad. Nauk SSSR, 1946, 52, 511–514 CAS .
  31. M. A. Watzky and R. G. Finke, J. Am. Chem. Soc., 1997, 119, 10382–10400 CrossRef CAS .
  32. (a) P. J. Skrdla and R. T. Robertson, Chem. Mater., 2008, 20, 3–4 CrossRef CAS ; (b) P. J. Skrdla, J. Phys. Chem. A, 2009, 113, 9329–9336 CrossRef CAS PubMed ; (c) P. J. Skrdla, J. Phys. Chem. A, 2011, 115, 6413–6425 CrossRef CAS PubMed ; (d) P. J. Skrdla, J. Phys. Chem. C, 2012, 116, 214–225 CrossRef CAS .
  33. R. Hoffmann, V. I. Minkin and B. K. Carpenter, HYLE, 1997, 3, 3–28 Search PubMed .
  34. R. F. Pasternack, E. J. Gibbs, P. J. Collings, J. C. dePaula, L. C. Turzo and A. Terracina, J. Am. Chem. Soc., 1998, 120, 5873–5878 CrossRef CAS .
  35. F. Mallamace, N. Micali, A. Romeo and L. Monsu-Scolaro, Curr. Opin. Colloid Interface Sci., 2000, 5, 49–55 CrossRef CAS .
  36. (a) E. Ando, J. Miyazaki, K. Morimoto, H. Nakahara and K. Fukuda, Thin Solid Films, 1985, 133, 21–28 CrossRef CAS ; (b) H. Yajima, N. Yoshimoto and T. Ishii, J. Photopolym. Sci. Technol., 1998, 11, 47–54 CrossRef CAS ; (c) H. Tachibana, Y. Yamanaka, H. Sakai, M. Abe and M. Matsumoto, J. Lumin., 2000, 87–89, 800–802 CrossRef CAS ; (d) M. Matsumoto, T. Nakazawa, R. Azumi, H. Tachibana, Y. Yamanaka, H. Sakai and M. Abe, J. Phys. Chem. B, 2002, 106, 11487–11491 CrossRef CAS ; (e) K. Ikegami, J. Chem. Phys., 2004, 121, 2337–2347 CrossRef CAS PubMed .
  37. M. Koga, Y. Yamamichi, Y. Nomoto, M. Irie and T. Yoshinaga, Anal. Sci., 1999, 15, 563–568 CrossRef CAS .
  38. Z. Chen, A. Lohr, C. R. Saha-Möller and F. Würthner, Chem. Soc. Rev., 2009, 38, 564–584 RSC .
  39. A. Wakisaka, H. Abdoul-Carime, Y. Yamamoto and Y. Kiyozumi, J. Chem. Soc., Faraday Trans., 1998, 94, 369–374 RSC .
  40. S. M. Aldoshin, Organic Photochromic and Thermochromic Compounds. V. 2. Physicochemical Studies, Biological Applications, and Thermochromism, ed. J. C. Crano and R. J. Guglielmetti, et al., Kluwer Academic/Plenum Publishers, New York, 1999, p. 307 Search PubMed .
  41. F. Würthner, S. Yao, T. Debaerdemaeker and R. Wortmann, J. Am. Chem. Soc., 2002, 124, 9431–9447 CrossRef PubMed .

Footnote

Electronic supplementary information (ESI) available. See DOI: 10.1039/c4ra02587c

This journal is © The Royal Society of Chemistry 2014
Click here to see how this site uses Cookies. View our privacy policy here.