Defect controlled water splitting characteristics of gold nanoparticle functionalized ZnO nanowire films

Ajay Kushwaha and M. Aslam*
Department of Physics and National Center for Photovoltaic Research and Education (NCPRE), Indian Institute of Technology Bombay, Powai, Mumbai-400076, India. E-mail: m.aslam@iitb.ac.in; Tel: +91-22-2576-7585

Received 27th January 2014 , Accepted 24th April 2014

First published on 28th April 2014


Abstract

Functionalization of ZnO nanowires by size controlled gold nanoparticles is demonstrated through sputtering of a gold layer followed by annealing at different temperature. Rationally designed sputtered Au nanoparticle–ZnO nanowire (AuNP–ZnO) exhibits high photocatalytic activity for water splitting. The tailored structure shows an enhanced photocurrent of 300 μA cm−2 under visible light illumination. Additionally, the efficiency of 0.13% at a low bias of 0.45 V vs. Ag–AgCl indicates an efficient charge separation and collection without a conducting ITO/FTO base. The AuNPs tune the visible light absorption and utilize the SPR of the Au nanoparticle to boost the hot electron injection from Au nanoparticles to the ZnO conduction band. Moreover, AuNPs also assist in the suppression of surface defects of ZnO NWs (or hole traps) significantly and enhance the water splitting performance of the material under visible light.

1. Introduction

High electron mobility and ease of fabrication make ZnO nanowires a suitable material for photoelectrochemical (PEC) water splitting in comparison to other metal oxides such as TiO2 and WO3.1–3 Poor visible light absorption, rapid recombination of photo-generated charge carriers (high concentration of surface traps) and photo-corrosion of ZnO in electrolyte solution are some of the major obstacles towards practical realization of ZnO nanowire films as photoanodes.4–10 Various surface functionalization strategies such as metal/semiconductor NPs decoration, dye sensitization and core–shell structure formation have been explored by different research groups to overcome above mentioned challenges.6,11–16 For example, metal nanoparticle coated oxide photoanodes (TiO2, Fe2O3 and ZnO) have shown reduction in trap states due to surface passivation, and an improvement in visible light absorption thus proving their worth as photoanode.16–20 Functionalization of TiO2 films with gold, silver and platinum nanoparticles have rendered a significant improvement (60 times) in photocatalytic activity.19,21,22 In a similar manner, gold nanoparticle decorated ZnO or Fe2O3 nanoplatelets have also shown higher absorption of visible light leading to an improved photocatalytic behavior.16–18 In most of these studies, metal nanoparticles are considered as the antenna for the light absorption and semiconductor nanostructure platform acts as a reaction center for photocatalytic activity.16 Similarly, it is also proposed that gold acts as an electron trapping center for photo-generated charges and escalates separation rate of electron–hole pairs in photocatalytic activity.20,18 In addition, formation of Schottky junction between silver nanoparticles and ZnO microrod is believed to be a cause of an effective separation of photo-generated charges.23 In a similar manner, AuNPs coating also forms a Schottky barrier at ZnO–Au interface and prevents a reverse transfer of holes from the electrolyte leading to a reduction in recombination of photo-generated charge carriers.24 Furthermore, the size of the metal nanoparticles is also a decisive parameter to control the range and intensity of visible light absorption and hence optimizes the intensity of localized electric field at the metal–semiconductor interface.25,26 In a nutshell, transfer of excitation energy of metal nanoparticles to semiconductor creates electro–hole pairs at photo anode surface and therefore directly contributes to PEC performance.

Despite having excellent features like a very good electron/hole conductor, easily tunable band-gap and availability at nanoscale in numerous shapes, ZnO based photo anodes suffer from the instability due to photo-degradation and corrosion at higher/alkaline pH conditions.27–29 Moreover, the presence of intrinsic defects at ZnO surface and Zn(OH)2 layer (especially in case of solution grown nanowires) is responsible for electron trapping and hence poor photo conversion efficiency.30–32 While, in comparison to bare ZnO, surface functionalization not only offers a minimized contact of ZnO layer with electrolyte solution (enhanced stability) but also provides an effective separation of holes from the ZnO surface. In addition to these two advantages, surface functionalized nanowire films33–36 (e.g. hybrid nanowire films, ZnO/Ag nanostructured films, Au/Ag embedded ZnO films, metallic SWCNT–ZnO composite or Au–ZnO flower-rod heterostructure, etc.) show an improved electrical conductivity. Thus, realization of ‘ITO/FTO free photoanode’ can be aimed in which hybrid film has two roles one as photo active layer for catalytic activity and second as an efficient transport medium for photo-generated charge carriers.37 In yet another scheme, Al-doped and hydrogen annealed ZnO nanowires have also been proposed as TCO (transparent conducting oxide) free efficient water splitting photoanodes.38 Though, ITO/FTO free ZnO nanowire based photoanodes are reported, but studies are very limited and not well explored for water splitting performance.39–41

This report presents a facile process to get size controlled gold nanoparticle (in range of 5 nm to 30 nm) functionalized photoactive nanowire electrodes (purple to green color films) by annealing gold sputtered ZnO nanowire films. An enhanced band edge emission and fully suppressed defect emission is observed due to excitonic–plasmonic coupling between ZnO NW and AuNPs. Gold nanoparticle has multiple roles such as (i) it acts as light designer in ZnO nanowire photoanodes and increases visible light absorption due to localized surface plasmons. (ii) Interaction of localized electric field of AuNP with ZnO surface generates electron–hole pairs near the nanowire surface which can be separated effectively due to the surface barrier. The photo excited electrons (plasmons) of AuNPs stay at higher energy state and are easily transferred to the ZnO conduction band (AuNPs: as electron donor). (iii) Surface capping by thin AuNPs layer reduces surface traps/defects and minimizes the holes trapping in ZnO valence band (efficient charge separation). Near conformal covering (with AuNPs of average 6 nm size) of ZnO nanowire photoanode shows around two orders of increase in electrical conductivity and 30 times enhanced water splitting efficiency as compared to pristine defect ridden ZnO photoanode.

2. Experimental and characterization techniques

ZnO nanowires were grown on amorphous glass substrates using low temperature hydrothermal growth.45 Glass slides were cleaned using soap solution followed by ultrasonication in DI water, acetone and isopropyl alcohol. Cleaned substrates were then functionalized using colloidal solution of zinc sol via dip coating followed by annealing at 400 °C in air atmosphere for 1 hour. ZnO seeded substrate were kept into sealed glass bottle which contains 50 mM aqueous solution of zinc nitrate hexahydrate [Sigma-Aldrich, 99% purity] and hexamine (HMT) [Sigma-Aldrich, 99% purity], 1[thin space (1/6-em)]:[thin space (1/6-em)]1 mole ratio. Growth reaction was carried out in the laboratory oven at fixed temperature (90 °C) for 12 hour.42 Finally, ZnO nanowire grown substrates were naturally cooled to room temperature and cleaned using DI water and ethanol. A 15 nm thick gold layer was sputtered over hydrothermally grown ZnO nanowire films using NORDIKO metal sputtering system. A programmable split type tube furnace was used to anneal the ZnO[thin space (1/6-em)]:[thin space (1/6-em)]Au nanowire films at 200, 400 and 600 °C under argon atmosphere. The annealing at different temperatures revealed different size gold nanoparticles (5 nm to 30 nm) on ZnO nanowire surface.

Morphological characterizations of gold coated ZnO nanowire were carried out by JEOL JSM-7600F FEG-Scanning Electron Microscopy (HRSEM) operated at 15 kV. Xpert PANAlytic X-ray diffractometer (XRD) was utilized for the crystallographic investigations. Lattice fringes and SAED pattern were recorded using HRTEM (JEOL JEM 2100F), field emission gun transmission electron microscope at an accelerating voltage of 200 kV. Elemental mapping of core–shell nanowire was carried out using STEM mode of HRTEM. Optical transmittance was taken using Lambda 950 (Perkin Elmer) in range 300–800 nm at room temperature with integrating sphere assembly. PL measurement was performed using He–Cd laser with 325 nm excitation wavelength.

Three-electrode based photoelectrochemical measurements were performed using Autolab potentiostat/galvanostat. Gold nanoparticles functionalized ZnO nanowire films were used as working electrode (photoanode), Pt wire as counter and Ag–AgCl as reference electrode in 0.5 M Na2SO4 electrolyte solution. The photoanodes were illuminated by Xenon lamp (100 mW cm−2) at 1 cm2 area for photoelectrical measurements. Visible light sensitivity of Au–ZnO NWs photoanode was measured at 500 mV fixed bias with respect to Ag–AgCl reference electrode. Linear sweep voltammetry measurements were performed to estimate water splitting performance of gold nanoparticles decorated ZnO nanowire films. Time dependent photocurrent (amperometry) measurements under visible light excitation were carried out for one hour to test the stability of AuNPs coated ZnO NWs photoanodes. All the photoanodes were prepared on non-conducting (ITO/FTO free) glass substrates. Four different electrodes named as ZnO_ASG (as-grown ZnO nanowire), Au_15 nm (15 nm gold sputtered ZnO nanowire), Au_200 °C (gold sputtered ZnO nanowire annealed at 200 °C), Au_400 °C (gold sputtered ZnO nanowire annealed at 400 °C) and Au_600 °C (gold sputtered ZnO nanowire annealed at 600 °C) were tested for PEC water splitting. AuNPs functionalization of ZnO NWs via sputtering is a clean process and does not apply reducing or stabilizing agents, thus, there is no contamination issues from hydrocarbons which is typically a big concern during soft chemical processing.43 In addition, the gold nanoparticles are directly attached to the ZnO nanowire surface without any intermediate surface ligands/binders which makes it more favorable for photo-catalytic activity.

3. Results and discussion

3.1 Morphological and structural properties

Large area tilt view SEM images of as-sputtered and post annealed Au–ZnO NW films are shown as Fig. 1a–d. As-sputtered gold conformally covers the entire surface of the NWs (Fig. 1a), while the annealing at 200 °C results in aggregation of small sized Au nanoparticles which are distributed all along the length of the NW (Fig. 1b). The annealing at 400 °C results in aggregation of irregular shape and larger size gold nanoparticles (Fig. 1c) and renders a partially covered ZnO NW surface. The 600 °C annealing further increases the size of gold nanoparticles and results into a larger uncovered ZnO nanowire surface (Fig. 1d). Top view SEM images of AuNP coated single nanowire (Fig. 1e–h) show that sputtered gold does not aggregate till 200 °C and the top hexagonal facet of nanowire remains fully flat or conformally covered with very small sized nanoparticles. After annealing at 400 °C, gold agglomerates into arbitrary shaped big-size nanoparticles (Fig. 1g) while hexagonal disks are formed for 600 °C (Fig. 1h). Since amount of sputtered gold is equal in all the samples, hence density of nanoparticles decreases as the Au nanoparticle size increase at higher annealing temperature. The samples annealed at 600 °C shows the lowest density of NPs due to larger aggregation and results into larger exposed/open surface area of ZnO NWs.
image file: c4ra00782d-f1.tif
Fig. 1 Scanning electron microscopic images of gold nanoparticle functionalized ZnO nanowires. (a) As sputtered gold layer (15 nm) over ZnO nanowire film, (b) Au–ZnO nanowire film annealed at 200 °C, (c) 400 °C and (d) 600 °C, respectively. SEM image of single Au–ZnO nanowire (e) as sputtered gold layer, annealed at (f) 200 °C, (g) 400 °C, and (h) 600 °C, respectively.

Fig. 2 shows HRTEM images of single ZnO nanowire coated with gold nanoparticles. The as-sputtered gold fully covers the ZnO nanowire surface (Fig. 2a) and annealing of these films at 200 °C results in 5–10 nm size gold nanoparticles (Fig. 2b). An increase in annealing temperature to 400 °C results an increase of gold nanoparticles size (10–20 nm) as shown in Fig. 2c and further increase in annealing temperature to 600 °C shows the largest size particles (Fig. 2d) with size distribution of 10–30 nm. The density of nanoparticles appears to be lowered due to agglomeration (Fig. 2d) at higher temperature. SAED pattern of as-sputtered gold ZnO nanowire (inset Fig. 2a) has both circles and periodic points, which indicated the hybrid Au–ZnO structure formation. Similar SAED pattern is also observed for Au–ZnO samples annealed at 200 °C, however, periodic points are more distinguished and clear for 400 and 600 °C annealed samples, due to larger sized well-separated AuNPs.


image file: c4ra00782d-f2.tif
Fig. 2 High resolution TEM images of (a) as-sputtered gold layer over ZnO nanowire, (b) Au–ZnO nanowire annealed at 200 °C, (c) 400 °C and (d) 600 °C, respectively. Inset of all the images show selected area electron diffraction pattern of respective samples.

XRD spectra of as-grown ZnO nanowires and gold coated nanowires (Fig. 3a) show that all nanowire films are highly oriented towards (002) direction and have wurtzite crystal structure (JCPDS no. 36-1451). Gold coating results in appearance of an additional peak in XRD spectrum (along with standard ZnO peaks) at 38.1° 2θ value which corresponds to Au (111) peak.44 The intensity of the gold peak is lowest due to thin and uniform as-sputtered layer which remains similar for 200 °C annealed Au–ZnO nanowires. The aggregation and formation of large Au islands (400 and 600 °C) at the top as well as side facets of the ZnO surface results an increase in the intensity of the gold peak (Fig. 3b).


image file: c4ra00782d-f3.tif
Fig. 3 (a) XRD spectra of as-grown and gold coated ZnO nanowire films annealed at different temperatures as labelled in the figure. (b) Short range XRD scan of different size gold nanoparticles decorated nanowire films as indicated.

3.2 Optical properties of Au functionalized ZnO nanowire films

The varied size of gold nanoparticles shows size dependent plasmonic properties, which is directly visible as varied colors of the Au–ZnO nanowire films (Fig. 4).46,47 The pristine NW film without gold NPs (as-grown nanowires) shows cream-white color, while as-sputtered (Au_15 nm) Au–ZnO NWs film is green-golden in color. The 200 °C annealed Au–ZnO film is golden yellow in color, while 400 °C and 600 °C annealed samples are light red and dark red in color, respectively. This change in color after annealing (due to size dependent plasmonic properties of Au nanoparticles) reflected as variation in visible light absorption properties with an increase in size of Au particles on ZnO NW surface.47 Transmittance spectra of Au–ZnO NWs film is recorded and found that 200 °C annealed NWs shows minimum transmittance (Fig. 5), while 600 °C annealed Au–ZnO NWs films show highest transmittance as well as strong surface plasmon around 580 nm. In comparison to bigger size AuNPs, approximately 10% decrease in transmittance is observed for small size and dense AuNP functionalized nanowire films (as-sputtered and 200 °C). A dense covering of nanoparticles causes an effective excitonic–plasmonic coupling or an excellent photon trapping effect which leads to an enhanced broad range absorption (500–700 nm) as has been reported for Au–TiO2, Au–Fe2O3 functionalized nanorods.16,18,48,49 Thus, gold functionalization increases visible light absorption which is beneficial and a primary requirement for more efficient photoanode to water splitting application.16,18,26,50
image file: c4ra00782d-f4.tif
Fig. 4 Digital photograph of pristine ZnO, gold as-sputtered ZnO NWs film and Au–ZnO NWs films annealed at different temperature (200, 400 and 600 °C) associated with single nanowire SEM images. Size dependent plasmonic effect of gold nanoparticles renders different color of Au–ZnO nanowire films.

image file: c4ra00782d-f5.tif
Fig. 5 Transmittance spectra of different size gold nanoparticles functionalized ZnO nanowire films.

3.3 Correlation of emission and electrical characteristics

The room temperature PL measurements of Au–ZnO nanowire films are given in Fig. 6. The as-grown ZnO nanowires films show intense defect emission. The intensity of defect band emission reduces after annealing and is fully suppressed when annealed at 200 °C. However, higher annealing temperature (400 & 600 °C) shows an increase in defect emission intensity with a red shift in the peak position. The ambiguous nature of the defect band is further analyzed by de-convoluting defect band into three Gaussian peaks51 related to green (P1), yellow (P2) and red color (P3) emissions (Fig. 6b–f). The cause of green emission in ZnO is highly controversial, however, presence of singly charged oxygen vacancies and other surface species has been considered a cause in solution grown ZnO nanowires.51 While yellow and red emissions correspond to doubly charge oxygen vacancies and excess of oxygen or lattice strain, respectively. Green emission is the highest in as-grown nanowires which is almost fully suppressed after AuNPs coating followed by annealing at 200 °C (Fig. 6b and c). To study the relative change in defect emission for different size AuNPs coated ZnO nanowire films, the change in intensity ratio of defect emission with respect to band edge emission is calculated. Fig. 7a represents a comparative change in intensity of green emission (IP1) and red emission (IP3) with respect to band edge emission (IUV) of all the samples. Relative intensity of green emission (IP1/IUV = 0.8) is highest for as-grown nanowire. Gold NPs coating reduces intensity ratio of green emission (IP1/IUV = 0.18, for as-sputtered gold) and 200 °C annealed samples show minimum green emission (IP1/IUV = 0.05). The intensity of red emission is initially slowly decreases for as-sputtered and 200 °C annealed samples. While annealing at 400 °C and 600 °C results increase in the intensity of red emission. An increase in red emission can be corresponds to the lattice strain which occurs due to the diffusion of gold at higher temperature. A lattice strain changes the crystal symmetry of ZnO and cause lattice distortion leading to creation of new defects states at near-band edge.52 A thermally driven defect formation has been reported at gold–ZnO interface, which has shown a new emission at 2 eV (red emission) after annealing of Au–ZnO films at 650 °C.53 Excess oxygen or oxygen interstitial formation is also responsible for an increase in red emission which appears at higher temperature annealing.54,55 The transfer of photoexcited electrons (due to surface plasmon resonance) from AuNPs to the conduction band of ZnO is responsible for the enhancement in the band edge emission after AuNPs functionalization.54,56,57 The strong coupling between surface plasmon and exciton is considered as the cause for increase in the density of states and enrich the intensity of spontaneous emission in the ZnO nanorods.58 An enhancement in near-band edge emission has been seen due to surface plasmon resonance when ZnO nanobelts is coated with gold nanoparticles.59 On the other-hand, the transfer of electrons from defect levels of ZnO to the Fermi level of gold NPs leads to suppression in defect emission.15 Furthermore, since surface adsorbed oxygen and other surface states are covered with the gold nanoparticles, hence, a well-controlled and nearly fully suppressed defect emission of ZnO nanowires is observed. To investigate the role of defects in electrical transport properties of ZnO[thin space (1/6-em)]:[thin space (1/6-em)]Au NWs films, current–voltage characteristics is measured under dark condition (Fig. 7b). An increased electrical conductance by an order is observed for as-sputtered gold sample. As compared to as-grown ZnO nanowire, approximately two orders of enhancement in electrical conductance is observed for 200 °C annealed samples. Reduction of surface defects and improved interconnects between NWs through gold nanoparticles is the main cause for enhanced electrical conduction. As-sputtered Au–ZnO films have a depletion layer (adsorbed oxygen) between AuNP and NWs surfaces, which gets removed after annealing at 200 °C and results in further enhanced electrical conduction.55,58,60–63 Annealing at 400 °C and 600 °C also shows an improved electrical conductivity though they have higher concentration of red emission related defects. Thus, it can be considered that presence of green emission related defects such as surface adsorbed oxygen and singly charged oxygen vacancies are mainly responsible for poor electrical conductivity in these nanowire films.64 Gold nanoparticles functionalization reduces surface traps and enhances electrical conductivity in ZnO nanowires films. This indicates an effective charge separation and collection than the pristine ZnO nanowire based anodes.
image file: c4ra00782d-f6.tif
Fig. 6 (a) Room temperature PL measurements of gold nanoparticles decorated ZnO nanowire films. Three Gaussian peaks fitting of defect band emission (b–f) for as-grown nanowires and size dependent gold nanoparticles decorated nanowire films annealed at different temperatures as labeled (the sharp peak around 764 nm is the second harmonic peak of the band edge emission).

image file: c4ra00782d-f7.tif
Fig. 7 (a) Variation of relative intensity of red and green emissions with respect to annealing temperature of samples. (b) Current–voltage plot of as-grown and annealed AuNP decorated ZnO nanowire films.

3.4 Photoelectrochemical water splitting characteristics of ITO/FTO free Au–ZnO NWs anode

The time dependent photocurrent measurements (It plot) of Au–ZnO NWs anode are performed under visible light ON/OFF conditions at a fixed external bias (0.5 V/Ag–AgCl). As-grown ZnO nanowires show a sharp change (an order) in current under visible light illumination (18 μA) photocurrent, while 200 °C annealed Au–ZnO NWs show highest value of photocurrent (115 μA) among all the photoanodes (Fig. 8a). Under visible light illumination, the surface plasmon resonance of AuNPs excites electrons and supplies to ZnO nanowires continuously. For 200 °C annealed samples, the density of AuNPs is higher and small in size; hence, intense surface plasmon resonance (SPR) occurs and causes a continuous supply of large number of electrons to nanowire system that leads to highest photocurrent with unsaturated value. Au–ZnO NWs annealed at higher temperature have large size and less populated gold nanoparticles that lead to less intense surface plasmon. Therefore, less number of photo-excited electron transfers from gold nanoparticles to ZnO nanowire and photocurrent gets saturated faster with lower value.
image file: c4ra00782d-f8.tif
Fig. 8 (a) Time dependent photoresponse of AuNP functionalized ZnO nanowires, (b) linear voltammetric scans of as-grown ZnO NWs and size dependent gold nanoparticle coated ZnO nanowire photoanodes. (c) Solar to hydrogen conversion efficiency of Au–ZnO NWs photoanode and (d) stability test of photoanode for one hour measurement time.

The linear sweep voltammograms shows highest photocurrent density (300 μA cm−2) for Au–ZnO nanowire anodes annealed at 200 °C (Fig. 8b). Relatively lesser value of photocurrent densities, 140 μA cm−2 and 85 μA cm−2 are measured for 400 °C and 600 °C annealed Au–ZnO nanowire films at 1 V bias with respect to Ag–AgCl reference electrode. Presence of annealing induced defects and lower plasmon–exciton interaction [lower density of large size (20–30 nm) gold nanoparticles] are the possible causes for lower photocurrent density in high temperature annealed (400 and 600 °C) NW. The plasmon–exciton coupling strongly depends upon the metal nanoparticles size and formation of resonant state under light irradiation results in an enhancement of local electric field at Au–ZnO interface.65 This leads to an increase in the light absorption and rapidly creates electron–hole pairs at the surface which directly contributes to photocurrent.66 The size, structure and density of gold nanoparticles effectively control the light absorption and electron–hole pair generation. Since, coating of large size AuNPs leads to higher open surface of ZnO and lower density of AuNPs which renders poor plasmon–exciton interaction and result in lower photocurrent density. The 200 °C annealed sample reveals an intense plasmon–exciton interaction due to small size and large density (fully capped ZnO surface) of AuNPs with respect to as-sputter gold sample. However, formation of larger size gold nanoparticles leads to lower density in case of high temperature annealed samples (400 and 600 °C) which is responsible for reduction in plasmon–exciton interaction.

Various hybrid structures such as hierarchical Au–ZnO flower-rod heterostructures,67 patterned AuNPs/ZnO nanowires18 and plasmonic Ag/ZnO embedded nanostructures68 have been proposed as photoanodes which show 120, 350, and 800 μA cm−2 photocurrent, respectively. However, above mentioned photo anodes were designed on FTO (conducting glass) substrates, while photoanodes presented in our work are fabricated on non-conducting glass substrates. The value of photocurrent found in this work is almost in the same range as reported in the literature though we used ITO/FTO free glass substrate which makes our photoanodes significantly different and important for water splitting activity.38

The efficiency of solar driven hydrogen generation is calculated using following formula69

image file: c4ra00782d-t1.tif
where Jp is the photocurrent density (mA cm−2), V (volt) is applied voltage and Llight (mW cm−2) is the power of incident light. The efficiency of as-grown ZnO nanowire film is found to be 0.012% at 0.6 V (vs. Ag/AgCl) which increases to 0.13% for AuNP functionalized ZnO (200 °C annealed) electrode (Fig. 8c). Thus, ZnO nanowire films functionalized with small size gold nanoparticles show nearly 30 times increase in photoelectrochemical water splitting efficiency in comparison to pristine ZnO NWs. The stability of Au–ZnO photoanode against photo corrosion and degradation is also tested through long term photocurrent measurements. Fig. 8d indicates that 200 °C and 400 °C annealed NWs show minimum variation/fluctuation in photocurrent for one hour continuous measurement. As-grown nanowires and 600 °C annealed NWs samples show relatively lesser stability in photocurrent due to direct contact of large area of ZnO surface with the electrolyte.

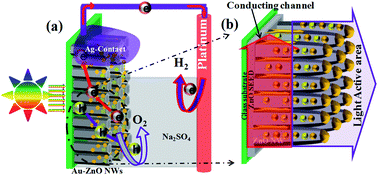
Fig. 9 presents a schematic diagram of water splitting process in Au–ZnO nanowire anode. Herein, Au–ZnO nanowire film itself acts as a conducting substrate for the electron transport and a bottom dense layer comprising ZnO NWs and gold interconnects between nanowires takes part in electrical conduction. The open surface of gold functionalized ZnO NWs behaves as light active center for photocatalytic activity in which gold nanoparticles take part as light sensitizer. Under visible light irradiation, formation of plasmons at gold nanoparticles surface produces intense localized electric field at the Au–ZnO interface.20 The interaction of localized electric field of AuNP with ZnO surface generates electron–hole pairs near the nanowire surface.35 These photoexcited electrons of AuNPs stay in higher energetic state and thus could be easily transferred to the ZnO conduction band causing an enhanced photocurrent.70 Interestingly, formation of a Schottky barrier (the higher work function of gold than the electron affinity of ZnO) at Au–ZnO interface prevents transfer of photo-generated electrons towards electrolyte.23 In addition to this, surface defects/traps of ZnO NWs are passivated by AuNPs which reduces the holes trapping and ultimately improves the photo-charge separation and thus, the overall performance of photoelectrochemical cell is improved. Thus, AuNPs act as light absorber as well as electron donor in functionalized ZnO nanowire anode leading to an enhanced stable photocurrent and can serve as a new nanostructured photoanode for fabrication of low cost and facile energy conversion device.


image file: c4ra00782d-f9.tif
Fig. 9 Schematic diagram (a) photoelectrochemical water splitting process in Au–ZnO NWs anodes and (b) zoom in portion of anode: conducting channel for electrons transport and light active area for photocatalytic activity.

4. Conclusions

Sputtering of gold layer over ZnO nanowire film followed by annealing gives size controlled AuNP functionalized ZnO nanowire films. Densely packed ZnO nanowire films with small size AuNPs shows enhanced band edge emission and fully suppressed defect emission leading to two orders of enhancement in electrical conductivity. The 30 times enhanced photocurrent and 0.13% water splitting efficiency are observed in gold nanoparticle surface functionalized ZnO nanowire films. The improved efficiency and enhanced stability could be attributed to improvements in photoanode by ‘multifunctional’ gold nanoparticles. First, the interaction of localized electric field (due to SPR) of AuNPs with ZnO surface increases the visible light absorption and creates larger number of electron–hole pairs near the nanowire surface. Second, passivation of surface defects/traps of ZnO reduces holes trapping which leads to improved water splitting characteristics of ITO/FTO free anodes.

Acknowledgements

We acknowledge IRCC, IIT Bombay (seed grant) and National Centre for Photovoltaic Research and Education (NCPRE), IIT Bombay (funded through Ministry of New and Renewable Energy, Government of India) for the financial support. Authors are also grateful to Professor Dinesh Kabra, Department of Physics, IIT Bombay for helpful discussions on optical properties.

References

  1. X. Yang, A. Wolcott, G. Wang, A. Sobo, R. C. Fitzmorris, F. Qian, J. Z. Zhang and Y. Li, Nano Lett., 2009, 9, 2331 CrossRef CAS PubMed.
  2. A. Wolcott, W. Smith, T. R. Kuykendall, Y. Zhao and J. Z. Zhang, Adv. Funct. Mater., 2009, 19, 1849 CrossRef CAS.
  3. Y. Wang, Q. Wang, X. Zhan, F. Wang and M. Safdar, Nanoscale, 2013, 5, 8326 RSC.
  4. Z. Li, W. Luo, M. Zhang, J. Feng and Z. Zou, Energy Environ. Sci., 2013, 6, 347 CAS.
  5. Y. Myung, D. M. Jang, T. K. Sung, Y. J. Sohn, G. B. Jung, Y. J. Cho, H. S. Kim and J. Park, ACS Nano, 2010, 4, 3789 CrossRef CAS PubMed.
  6. Y. Tak, H. Kim, D. Lee and K. Yong, Chem. Commun., 2008, 4585 RSC.
  7. S. Jung and K. Yong, Chem. Commun., 2011, 47, 2643 RSC.
  8. Y. Liu, Z. H. Kang, Z. H. Chen, I. Shafiq, J. A. Zapien and I. Bello, Cryst. Growth Des., 2009, 9, 3222 CAS.
  9. G. Kwak, M. Seol, Y. Tak and K. Yong, J. Phys. Chem. C, 2009, 113, 1208 Search PubMed.
  10. Y. Zhang, Z. Wu, J. Zheng, X. Lin, H. Zhan, S. Li, J. Kang, J. Bleuse and H. Mariette, Sol. Energy Mater. Sol. Cells, 2012, 102, 15 CrossRef CAS PubMed.
  11. H. Li, C. Cheng, X. Li, J. Liu, C. Guan and Y. Y. Tay, J. Phys. Chem. C, 2012, 116, 3802 CAS.
  12. C. Y. Chen, C. Lin, M. J. Chen, G. R. Lin and J. H. He, Nanotechnology, 2009, 20, 185605 CrossRef CAS PubMed.
  13. A. Kushwaha and M. Aslam, Electrochim. Acta, 2014, 130, 222 CrossRef CAS PubMed.
  14. C. H. Kim, Y. C. Park, J. Lee, W. S. Shin, S. J. Moon, J. Park and J. Kim, Mater. Lett., 2011, 65, 1548 CrossRef CAS PubMed.
  15. A. Bera and D. Basak, Nanotechnology, 2011, 22, 265501 CrossRef PubMed.
  16. E. Thimsen, F. Le Formal, M. Grätzel and S. C. Warren, Nano Lett., 2011, 11, 35 CrossRef CAS PubMed.
  17. G. Rahman and O.-S. Joo, Mater. Chem. Phys., 2013, 140, 316 CrossRef CAS PubMed.
  18. P. Thiyagarajan, H. J. Ahn, J. S. Lee, J. C. Yoon and J. H. Jang, Small, 2013, 9, 2341 CrossRef CAS PubMed.
  19. F. Wu, X. Hu, J. Fan, E. Liu, T. Sun, L. Kang, W. Hou, C. Zhu and H. Liu, Plasmonics, 2012, 8, 501 CrossRef.
  20. D. B. Ingram and S. Linic, J. Am. Chem. Soc., 2011, 133, 5202 CrossRef CAS PubMed.
  21. Y. C. Pu, G. Wang, K. D. Chang, Y. Ling, Y. K. Lin, B. C. Fitzmorris, C. M. Liu, X. Lu, Y. Tong, J. Z. Zhang, Y. J. Hsu and Y. Li, Nano Lett., 2013, 13, 3817 CrossRef CAS PubMed.
  22. W. J. An, W. N. Wang, B. Ramalingam, S. Mukherjee, B. Daubayev, S. Gangopadhyay and P. Biswas, Langmuir, 2012, 28, 7528 CrossRef CAS PubMed.
  23. T. Bora, H. H. Kyaw, S. Sarkar, S. K. Pal and J. Dutta, Beilstein J. Nanotechnol., 2011, 2, 681 CrossRef CAS PubMed.
  24. Y. Zhang, J. Xu, P. Xu, Y. Zhu, X. Chen and W. Yu, Nanotechnology, 2010, 21, 285501 CrossRef PubMed.
  25. S. Link and M. El-Sayed, J. Phys. Chem. B, 1999, 103, 4212 CrossRef CAS.
  26. W. L. Ong, S. Natarajan, B. Kloostra and G. W. Ho, Nanoscale, 2013, 5, 5568 RSC.
  27. J. Zhou, N. S. Xu and Z. L. Wang, Adv. Mater., 2006, 18, 2432 CrossRef CAS.
  28. J. Domenech, J. Phys. Chem. C, 1986, 397, 1123 CrossRef.
  29. M. Liu, C. Y. Nam, C. T. Black, J. Kamcev and L. Zhang, J. Phys. Chem. C, 2013, 117, 13396 CAS.
  30. D. C. Iza, D. Muñoz-Rojas, Q. Jia, B. Swartzentruber and J. L. Macmanus-Driscoll, Nanoscale Res. Lett., 2012, 7, 655 CrossRef PubMed.
  31. A. Layek, B. Manna and A. Chowdhury, Chem. Phys. Lett., 2012, 539–540, 133 CrossRef CAS PubMed.
  32. X. Bai, L. Wang, R. Zong, Y. Lv, Y. Sun and Y. Zhu, Langmuir, 2013, 29, 3097 CrossRef CAS PubMed.
  33. H. Ishiguro, in Optics Info Base, 2012,  DOI:10/1364/fio.2012.fth1a.6.
  34. Y. R. Park, N. Liu and C. J. Lee, Curr. Appl. Phys., 2013, 13, 2026 CrossRef PubMed.
  35. S. Linic, P. Christopher and D. B. Ingram, Nat. Mater., 2011, 10, 911 CrossRef CAS PubMed.
  36. S. Mehra, M. G. Christoforo, P. Peumans and A. Salleo, Nanoscale, 2013, 5, 4400 RSC.
  37. A. Kushwaha and M. Aslam, J. Phys. D: Appl. Phys., 2013, 46, 485104 CrossRef.
  38. C. H. Hsu and D. H. Chen, Nanoscale Res. Lett., 2012, 7, 593 CrossRef PubMed.
  39. S. G. Ihn, K. S. Shin, M. J. Jin, X. Bulliard, S. Yun, Y. Suk Choi, Y. Kim, J. H. Park, M. Sim, M. Kim, K. Cho, T. Sang Kim, D. Choi, J. Y. Choi, W. Choi and S. W. Kim, Sol. Energy Mater. Sol. Cells, 2011, 95, 1610 CrossRef CAS PubMed.
  40. D. H. Kim, J. H. Heo, D. J. Kwak and Y. M. Sung, J. Electr. Eng. Technol., 2010, 5, 1460 Search PubMed.
  41. C. H. Hsu and D. H. Chen, Int. J. Hydrogen Energy, 2011, 36, 15538 CrossRef CAS PubMed.
  42. A. Kushwaha and M. Aslam, Int. J. Nanosci., 2011, 10, 635 CrossRef CAS.
  43. E. Vanecht, K. Binnemans, J. W. Seo, L. Stappers and J. Fransaer, Phys. Chem. Chem. Phys., 2011, 13, 13565 RSC.
  44. I. Dutta, C. B. Munns and G. Dutta, Thin Solid Films, 1997, 304, 229 CrossRef CAS.
  45. K. Ai, Y. Liu and L. Lu, J. Am. Chem. Soc., 2009, 131, 9496 CrossRef CAS PubMed.
  46. S. K. Ghosh and T. Pal, Chem. Rev., 2007, 107, 4797 CrossRef CAS PubMed.
  47. I. V. Kityk, K. J. Plucinski, J. Ebothé, A. Umar and M. Oyama, J. Appl. Phys., 2005, 98, 084304 CrossRef PubMed.
  48. K. Kim, P. Thiyagarajan, H. J. Ahn, S. I. Kim and J. H. Jang, Nanoscale, 2013, 5, 6254 RSC.
  49. T. El-Brolossy, T. Abdallah, M. B. Mohamed, S. Abdallah, K. Easawi, S. Negm and H. Talaat, Eur. Phys. J.: Spec. Top., 2008, 153, 361 CrossRef.
  50. D. M. Schaadt, B. Feng and E. T. Yu, Appl. Phys. Lett., 2005, 86, 063106 CrossRef PubMed.
  51. A. Kushwaha and M. Aslam, J. Appl. Phys., 2012, 112, 054316 CrossRef PubMed.
  52. Y. Zhao, M. Zhou, Z. Li, Z. Lv, X. Liang, J. Min, L. Wang and W. Shi, J. Lumin., 2011, 131, 1900 CrossRef CAS PubMed.
  53. H. Matsui and H. Tabata, Appl. Phys. Lett., 2012, 101, 231901 CrossRef PubMed.
  54. H. Xue, N. Pan, M. Li, Y. Wu, X. Wang and J. G. Hou, Nanotechnology, 2010, 21, 215701 CrossRef PubMed.
  55. K. E. Knutsen, A. Galeckas, A. Zubiaga, F. Tuomisto, G. C. Farlow, B. G. Svensson and A. Y. Kuznetsov, Phys. Rev. B, 2012, 86, 121203 CrossRef.
  56. H. Chalabi and M. L. Brongersma, Nat. Nanotechnol., 2013, 8, 229 CrossRef CAS PubMed.
  57. H. M. Chen, C. K. Chen, C. Chen, L. Cheng, P. C. Wu, B. H. Cheng, Y. Z. Ho, M. L. Tseng, Y. Y. Hsu, T. Chan, J. Lee, R. Liu and D. P. Tsai, ACS Nano, 2012, 6, 7362 CrossRef CAS PubMed.
  58. J. M. Lin, H. Y. Lin, C. L. Cheng and Y. F. Chen, Nanotechnology, 2006, 17, 4391 CrossRef.
  59. B. J. Niu, L. L. Wu, W. Tang, X. T. Zhang and Q. G. Meng, CrystEngComm, 2011, 13, 3678 RSC.
  60. M. Liu, R. Chen, G. Adamo, K. F. MacDonald, E. J. Sie, T. C. Sum, N. I. Zheludev, H. Sun and H. J. Fan, Nanophotonics, 2013, 2, 153 CrossRef CAS PubMed.
  61. J. D. Hwang, Y. L. Lin and C. Y. Kung, Nanotechnology, 2013, 24, 115709 CrossRef CAS PubMed.
  62. M. W. Chen, C. Y. Chen, D. H. Lien, Y. Ding and J. H. He, Opt. Express, 2010, 18, 14836 CrossRef CAS PubMed.
  63. R. K. Joshi, Q. Hu, F. Alvi, N. Joshi and A. Kumar, J. Phys. Chem. C, 2009, 113, 16199 CAS.
  64. A. Kushwaha and M. Aslam, AIP Adv., 2013, 3, 042110 CrossRef PubMed.
  65. D. B. Ingram and S. Linic, J. Am. Chem. Soc., 2011, 133, 5202 CrossRef CAS PubMed.
  66. C. Liu, X. Lu, Y. Tong, J. Z. Zhang, Y. Hsu and Y. Li, Nano Lett., 2013, 13, 3817 CrossRef PubMed.
  67. Z. Han, L. Wei, Z. Zhang, X. Zhang, H. Pan and J. Chen, Plasmonics, 2013, 8, 1193 CrossRef CAS.
  68. H. M. Chen, C. K. Chen, M. L. Tseng, P. C. Wu, C. M. Chang, L. C. Cheng, H. W. Huang, T. S. Chan, D. W. Huang, R. S. Liu and D. P. Tsai, Small, 2013, 9, 2926 CrossRef CAS PubMed.
  69. X. Yang, A. Wolcott, G. Wang, A. Sobo, R. C. Fitzmorris, F. Qian, J. Z. Zhang and Y. Li, Nano Lett., 2009, 9, 2331 CrossRef CAS PubMed.
  70. S. Dhara and P. K. Giri, J. Appl. Phys., 2011, 110, 124317 CrossRef PubMed.

This journal is © The Royal Society of Chemistry 2014
Click here to see how this site uses Cookies. View our privacy policy here.