 Open Access Article
Multifunctional dual Na3V2(PO4)2F3 cathode for both lithium-ion and sodium-ion batteries
Weixin
Song
a,
Xiaobo
Ji
*a,
Zhengping
Wu
a,
Yirong
Zhu
a,
Fangqian
Li
a,
Yinpeng
Yao
a and
Craig E.
Banks
*b
aKey Laboratory of Resources Chemistry of Nonferrous Metals, Ministry of Education, College of Chemistry and Chemical Engineering, Central South University, Changsha, China. E-mail: xji@csu.edu.cn; Fax: +86 731 88879616
bFaculty of Science and Engineering, School of Science and the Environment, Division of Chemistry and Environmental Science, Manchester Metropolitan University, Chester Street, Manchester M1 5GD, Lancs, UK. E-mail: c.banks@mmu.ac.uk; Fax: +44 (0)1612476831
First published on 19th February 2014
Abstract
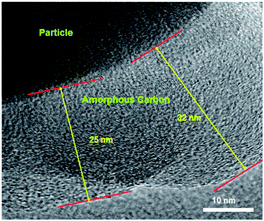
Na3V2(PO4)2F3 with a NASICON-type structure is shown to be synthesised with the particle surface found to be coated with amorphous carbon with its thickness in the range of 25–32 nm. The crystallographic planes (hkl) are labelled according to Density Functional Theory (DFT) calculations towards the as-prepared Na3V2(PO4)2F3. The performances of Na3V2(PO4)2F3 have been investigated in lithium- and sodium-ion batteries, exhibiting a specific capacity of 147 mA h g−1 with an average discharge plateau around 4 V vs. Li+/Li, and 111.5 mA h g−1 with three discharge plateaus in sodium-ion batteries. A predominant Li ion insertion mechanism is verified by comparing the redox potentials from CV and charge/discharge curves. It is found that the main migration from/into the crystallographic sites of Na3V2(PO4)2F3 of Li ions is favoured to obtain satisfactory properties by a two-step process, while the Na ions are found to require three steps. The stable and three-dimensional open framework of Na3V2(PO4)2F3 is considered to be vital for the excellent C-rate and cycling performances, as well as the fast ion diffusion with a magnitude of 10−11 cm2 s−1, which could demonstrate that Na3V2(PO4)2F3 is a multifunctional dual cathode for both lithium and sodium ion batteries and capable to be a promising candidate in the construction of high-energy batteries.
1. Introduction
Lithium-ion batteries (LIBs) have been of considerable interest worldwide due to their comparably high stored energy densities with their advantages contributing to their successful commercialization in a variety of portable electronic devices.1,2 However, the low abundance of lithium in the earth's crust (0.0065%) resulting in the high cost of LIBs as well as the safety, energy density, rate capability and service life issues still remain as key challenges afflicting the development of LIBs for the potential markets of electric vehicles (EVs) and hybrid electric vehicles (HEVs).3–7 However, one technological bottleneck for the commercial development of advanced LIBs is the lack of high-performance cathode materials.8 Layered lithium-rich materials with high specific capacity (ca. 250mA h g−1) and low cost have attracted attention due to their encouraging features, while the intrinsically poor rate capability and emerging safety hazards have made them controversial materials for use in LIBs.9 Framework materials based on the phosphate polyanions are being investigated as favourable replacements for lithium metal oxides due to the high energy storage capacity combined with electrochemical stability,10 such as olivine LiFePO4.11 This structural polyanion is constructed by a rigid [PO4]3− network which helps to stabilise the crystal structure of the material. The oxygen atoms are fixed in the [PO4]3− structure to limit the likelihood of oxygen liberation which leads to good thermal stability.12 In addition, the incorporation of [PO4]3−groups can also rise the charge/discharge potentials of the materials by an inductive effect.13 This, and associated materials possess high redox potentials and good lithium transport and are capable to contribute to remarkable electrochemical and thermal stability in comparison with lithium metal oxides. Nonetheless, some shortcomings including the one-dimensional lithium-ion transport or two-phase redox reaction that together limit the mobility of the phase boundary are critical for phosphate polyanion cathodes within the application in high-energy systems.10 Meanwhile, the lithium supply for lithium compounds can be put into question as a result of the un-easy availability of readily-accessible lithium in the environment.14Reasonably, tremendous attention has been focused on sodium-ion batteries constructed with a sodium-containing cathode, such as NaTi2(PO4)3,15 Na3M2(PO4)3 (M = Ti, Fe, V)3,16–18 and Na3V2(PO4)3 (ref. 17–20) et al. Among these, NASICON (Na superior conductor)-structured compounds have been brought into wide investigation attributed to the feature of a highly covalent three-dimensional framework that generates large interstitial spaces for sodium ions to diffuse.21,22 Furthermore, the discharge plateau should be declined in a sodium-ion battery due to the redox potentials versus Na+/Na, when the standard electrode potentials of Li+/Li (−3.04 V vs. SHE) and Na+/Na (−2.71 V vs. SHE) have been taken into consideration,20 which is not consistent with the requirement for high-energy batteries. However, the participation of fluorine in a transient metal-based structure seems to be able to enhance their working potentials owing to a larger ionicity of the M–F (M = transient metal) bond than that of the M–O one.23 Thus, Na3V2(PO4)2F3 has been explored as a promising cathode material to be utilized into a sodium-ion battery with an average voltage of 3.95 V and a specific capacity of 110 mA h g−1.24 Since the need for a high voltage of a Na3V2(PO4)2F3 cathode battery, a hybrid-ion system has been employed with a configuration composed of traditional lithium-based non-aqueous electrolyte and metallic lithium (or graphite) anode.20,25 If the sodium containing material could work well as a cathode in lithium-ion battery systems which might be called a hybrid-ion system, it will be greatly significant for the developing of secondary batteries, particularly in terms of the cost when used for large-scale energy storage. Moreover, the intrinsically well-defined NASICON channel structure of Na3V2(PO4)2F3 that facilitates excellent ionic conductivity1 could result in useful performances in terms of specific capacity, rate capability and cycle life.
Herein, Na3V2(PO4)2F3 was synthesized by an improved carbothermal reduction (CTR) methodology which is found to be carbon coated on the Na3V2(PO4)2F3 particle surface and is utilized as a cathode in both lithium and sodium-ion batteries to explore the corresponding electrochemical properties from which Na3V2(PO4)2F3 could be pointed out to be promising and multifunctional for high-energy battery fabrication.
2. Experimental section
2.1 Synthesis and characterization of Na3V2(PO4)3
Na3V2(PO4)2F3/C composite powders were prepared using analytical grade reagents by a CTR method. Stoichiometric amounts of Na2CO3, NH4H2PO4, NaF and V2O5 were adequately dissolved into 50 mL distilled water and dried under 50 °C by forced-air drying. Following this, acetylene black powders were mixed in the abovementioned precursor and ground to a uniformly particle distribution. The used acetylene black involved the mass as reducer and conductive agent (5 wt% to the total mass of reagents). Afterwards, the ground powders were preheated at 350 °C in flow argon for 4 h, and reground when it cooled to room temperature. Then, the obtained powders were re-fired at 650 °C in argon atmosphere for 8 h to generate Na3V2(PO4)2F3/C composite materials.The crystallographic structure of the as prepared material was studied by X-ray powder diffraction (XRD) using a Bruker D8 diffractometer with monochromatic Cu Kα radiation (λ = 1.5406 Å), and the diffraction data was recorded in the 2θ range of 10–60° with a scan rate of 8° min−1. The infrared (IR) spectra was obtained using an FT-IR Spectrometer (Jasco, FT/IR-4100, Japan) under transmission mode based on the KBr pellet method in the range of 500–2000 cm−1. The particle morphology of the composite was investigated by a FEI Quanta 200 scanning electron microscopy (SEM) and JEOL 2010F transmission electron microscopy (TEM). The thermogravimetric analysis (TG) of the samples was carried on a Diamond TG thermo-analyzer.
2.2 Electrochemical measurements
The cathode electrode was fabricated with the active material, acetylene black, and binder (polyvinylidene fluoride, PVDF) in a weight ratio of 8![[thin space (1/6-em)]](https://www.rsc.org/images/entities/char_2009.gif) :
:![[thin space (1/6-em)]](https://www.rsc.org/images/entities/char_2009.gif) 1
1![[thin space (1/6-em)]](https://www.rsc.org/images/entities/char_2009.gif) :
:![[thin space (1/6-em)]](https://www.rsc.org/images/entities/char_2009.gif) 1 by using NMP as solvent and an aluminium foil as current collector (∼4.5 mg cm−2), followed by drying in vacuum at 110 °C for 24 h. The R2016 coin cell was assembled in an argon-filled glove box using metallic lithium and sodium as the anode for lithium-ion and sodium-ion batteries, respectively, with a Celgard 2500 membrane as separator. The electrolyte for constructing lithium-ion battery was 1 M LiPF6 dissolved in a mixture of ethylene carbonate (EC), dimethyl carbonate (DMC), diethyl carbonate (DEC) (v/v/v, 1/1/1) and for sodium-ion battery, was 1 M NaClO4 in EC. Cyclic voltammetry (CV) and galvanostatic charge/discharge cycling tests were carried out in a setting voltage range by using an electrochemical workstation (CHI660C) and a CT2001A LAND battery tester, respectively. Electrochemical impedance spectroscopy (EIS) was studied using a Modulab (Solartron Analytical) with the amplitude of 5 mV in the frequency range from 1 MHz to 10 mHz. All electrochemical tests were carried out at room temperature.
1 by using NMP as solvent and an aluminium foil as current collector (∼4.5 mg cm−2), followed by drying in vacuum at 110 °C for 24 h. The R2016 coin cell was assembled in an argon-filled glove box using metallic lithium and sodium as the anode for lithium-ion and sodium-ion batteries, respectively, with a Celgard 2500 membrane as separator. The electrolyte for constructing lithium-ion battery was 1 M LiPF6 dissolved in a mixture of ethylene carbonate (EC), dimethyl carbonate (DMC), diethyl carbonate (DEC) (v/v/v, 1/1/1) and for sodium-ion battery, was 1 M NaClO4 in EC. Cyclic voltammetry (CV) and galvanostatic charge/discharge cycling tests were carried out in a setting voltage range by using an electrochemical workstation (CHI660C) and a CT2001A LAND battery tester, respectively. Electrochemical impedance spectroscopy (EIS) was studied using a Modulab (Solartron Analytical) with the amplitude of 5 mV in the frequency range from 1 MHz to 10 mHz. All electrochemical tests were carried out at room temperature.
2.3 Computation
All calculations on Na3V2(PO4)2F3 were performed with the spin-polarized Generalized Gradient Approximation (GGA) using the Perdew–Burke–Ernzerhof (PBE) exchange-correlation parameterization to Density Functional Theory (DFT) using CASTEP program. A plane-wave basis with a kinetic energy cutoff of 330 eV was used, and size of standard grid was 1.5. BFGS optimization method was used and the geometry optimization parameters of total energy convergence, max ionic force, max ionic displacement and max stress component tolerance were 0.2 × 10⁻⁴ eV per atom, 0.5 × 10⁻¹ eV Å−1, 0.2 × 10⁻² Å and 0.1 GPa respectively. The electronic convergence thresholds parameters of total energy were 0.2 × 10⁻⁵ eV and 0.5638 × 10⁻⁶ eV.3. Results and discussion
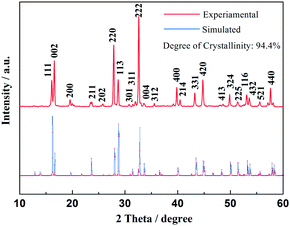
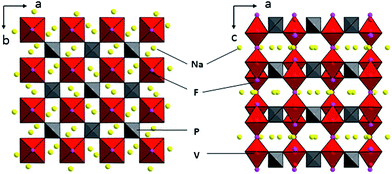
Fig. 1 shows the XRD patterns of the as-prepared material, as well as the Rietveld refinement of the patterns. The refined lattice parameters are a = b = 9.05 Å, c = 10.679 Å, V = 874.64 Å3 according to the observed XRD pattern, with a degree of crystallinity of 94.4%. All diffraction peaks could be indexed well to tetragonal Na3V2(PO4)2F3 structure with the space group of P42/mnm, which agree well with previously reported values.26,27 The observed crystallographic planes (hkl) of this crystal Na3V2(PO4)2F3 were denoted when the results of DFT calculation on Na3V2(PO4)2F3 model have been taken into consideration. Moreover, the feature peaks of Na3V2(PO4)2F3 are greatly enhanced when compared with our previous work,28 demonstrating an effective solvation result for precursor preparation in the CTR synthesis. In addition, there are no observed traces of carbon in the XRD patterns, implying that the residual carbon produced by the mechanism of CTR method in the composite is in an amorphous state which is consistent with published conclusions.28,29Shown in Fig. 2 are the graphical representations of the fluorophosphates structure viewed along c and b axis. The crystal structure of Na3V2(PO4)2F3 could be best described as a three-dimensional (3D) NASICON framework. This structure is composed of [V2O8F3] bi-octahedral and [PO4] tetrahedral units of which [V2O8F3] bi-octahedra is bridged with two [VO4F2] octahedra united by one fluorine atom, whereas the oxygen atoms are all interconnected through the [PO4] units. Consequently, the sodium ions could be statistically distributed in the resultant network of the NASICON structure. As suggested by Shakoor et al.,24 two sodium sites (Na1) are fully occupied while the other two (Na2) are half occupied by Na ions in Na3V2(PO4)2F3. Meanwhile, this extended 3D NASICON-type structure is expected to be capable of facile fast ion diffusion.28,30
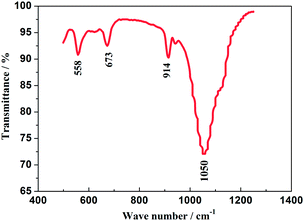
The FT-IR spectrum of the as-prepared Na3V2(PO4)2F3 material is displayed in Fig. 3, recorded from 500 to 1300 cm−1 from which the obviously appeared peaks could illuminate its fine crystallization.31 The bands corresponding to the asymmetric deformation of the PO43− anion are located in 540–580 cm−1 and the symmetric stretching vibrations, ν(PO43−) appear in 630–690 cm−1. The band in 914 cm−1 is suggested to be attributed to the vibration from V3+–O2− bonds in isolated VO6 octahedra, while the broad band in 1050 cm−1 is assigned to the absorbed peak resulted from the asymmetric stretching of PO43− anion.32 In addition, the bands at 760 and 950 cm−1 which are characteristic of the occurrence of V5+ in VO6 octahedra have not been observed, thus indicating the V5+ in V2O5 reagent has been reduced to V3+ undergoing a reduced reaction. Reasonably, the NASICON-type Na3V2(PO4)2F3 is highly likely to have been fabricated when the combined results of XRD and FT-IR are considered.
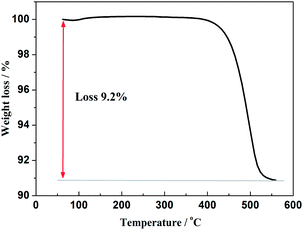
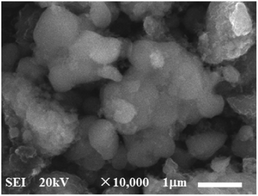
Furthermore, in order to estimate the carbon content in the as-prepared Na3V2(PO4)2F3/C composite, the TG test in air atmosphere was carried out and found to present a value of 9.2% (Fig. 4). The morphology of the as-prepared Na3V2(PO4)2F3 was studied by SEM as shown in Fig. 5, from which the irregularly shaped particles are distributed in the range of 0.5–1 μm due to the mechanochemical activation before sintering and some of the particles are agglomerated to form larger secondary particles. From the TEM image depicted in Fig. 6, the coated carbon on the surface of particles is in an amorphous state with the thickness estimated to be in the range of 25–32 nm. The coated carbon could be great significance to improve the electronic conductivity of the particles which is beneficial for the electrochemical properties of Na3V2(PO4)2F3 electrode material and prevent the growth of Na3V2(PO4)2F3 particles.
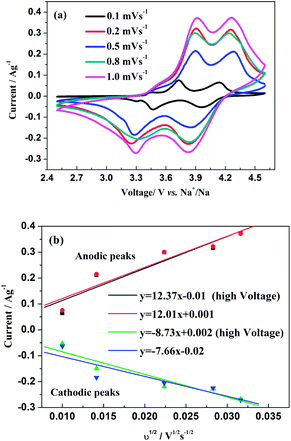
The insertion/extraction mechanism of ions in hybrid-ion batteries are interesting and have been described recently for Na3V2(PO4)3.20 Herein, another interesting experiment focusing on hybrid-ion batteries was investigated using the Na3V2(PO4)2F3 as a cathode. Fig. 7 shows the first 50th CV cycles of Na3V2(PO4)2F3 hybrid-ion battery at a scan rate of 0.5 mV s−1 over the voltage range from 2.5 to 4.6 V vs. Li+/Li. These two couples of redox peaks are likely to be responsible for the insertion/extraction of two alkali ions to realise the transformation from Na3V2(PO4)2F3 to NaV2(PO4)2F3 associated with V3+/V4+ reaction, resulting from the ion migration from two Na(2) sites with 0.5 occupation and one Na(1) site with 1 occupation for this NASICON-type structure, which is consistent with the reported literature.20,24 The anodic peaks located at 3.98 and 4.36 V vs. Li+/Li can be attributed to the ion extraction and the cathodic peaks at 3.58 and 4.15 V vs. Li+/Li could contribute to the ion insertion, of which the anodic peaks of the first cycle could contribute to the extraction of two sodium ions and the corresponding cathodic peaks would be ascribed to the insertion of hybrid ions. This is because a vast excess of lithium ions with smaller volume and mass are easy transported while the irreversibility for sodium ions mainly from the formed solid electrolyte interface (SEI) films seems not suitable for the migration of sodium ions. Moreover, the peak shapes of the CV curves demonstrate an enhanced reactive activation as a result of the participation of more lithium ions. Inductively Coupled Plasma (ICP) analysis has been utilised to investigate the electrochemical insertion mechanism of Na3V2(PO4)2F3, which indicated a Li/V molar ratio of 0.97 in the experimental Na3V2(PO4)2F3 cathode at the 10th galvanostatic cycle with a corresponding configuration of Li1.94Na1.06V2(PO4)2F3. This is evidence to support that the migrated ions have been predominantly Li+ ions by replacing Na+ ions during cycling.29 In addition, the CV curves of these anterior 50 cycles seemed almost coincident during cycling, which could indicate that the replacement does not cause significant change to the material structure and thus bring a good reversibility and stability. Furthermore, the Na3V2(PO4)2F3 cathode utilised in a sodium-ion battery also exhibited two obvious anodic peaks located at 3.9 and 4.28 V vs. Na+/Na with corresponding cathodic peaks at 3.28 and 3.85 V vs. Na+/Na from the first CV curve as shown in Fig. 8. It is reasonable for the potential decrease of redox peaks in a sodium-ion battery because the standard electrode potential of Li+/Li (−3.04 V vs. SHE) is 0.33 V lower than that of Na+/Na (−2.71 V vs. SHE). Additionally, the potential differences of the lithium-ion and sodium-ion batteries are 0.08, 0.08, 0.3 and 0.3 V by comparison the locations between the relevant anodic and cathodic peaks. This result, to some extent, could illuminate that the extracted ions in the first anodic reaction for Na3V2(PO4)2F3 lithium-ion battery would be predominantly Na+ ions mixed with a few Li+ ions and the inserted ions in the first cathodic reaction would be mainly Li+ ions. Otherwise, under the same scan rate of 0.5 mV s−1, the anodic peaks locations of Na3V2(PO4)2F3 in lithium-ion batteries should be the same to those in sodium-ion batteries corresponding the only Na+ ions extraction, and the cathodic peaks locations of Na3V2(PO4)2F3 in lithium-ion batteries would be 0.33 V higher than that in sodium-ion batteries resulted from the total Li+ ions insertion. Furthermore, there seems to be a diminutively anodic peak located at 3.5 V vs. Na+/Na, which could be explained by the two-step extraction of the first Na ions from Na(2) sites with different ions configuration in this NASICO-type structure during charging process. In addition, the difference of peak currents between two adjacent peaks is observed larger for hybrid-ion batteries than that for sodium-ion batteries, from which the higher peak current indicating higher reactive activity, could be attributed to the electrochemical behaviours of mixed Li ions for hybrid-ion system.
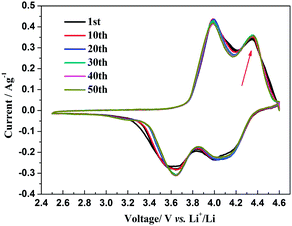 | ||
| Fig. 7 The first 50th CV curve of Na3V2(PO4)2F3 recorded at 0.5 mV s−1 over the voltage range of 2.5–4.6 V vs. Li+/Li. | ||
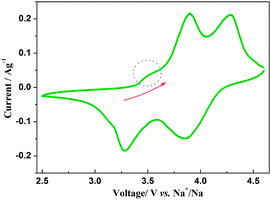 | ||
| Fig. 8 The first CV curve of Na3V2(PO4)2F3 recorded at 0.5 mV s−1 over a voltage range of 2.5–4.6 V vs. Na+/Na. | ||
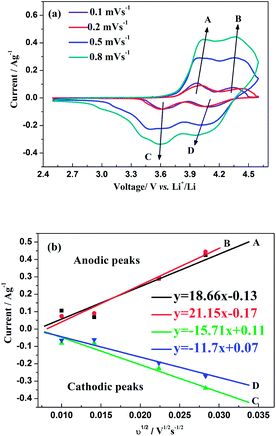
The CV curves of this hybrid-ion battery in a voltage range of 2.5–4.6 V vs. Li+/Li at scan rates of 0.1, 0.2, 0.5 and 0.8 mV s−1 are shown in Fig. 9a, respectively. Clearly, with the increase of scan rate, the height and area of the redox peaks increase because the peak area divided by the scan rate yield the capacity of the electrode that should be constant.33 In addition, the anodic peaks seem to shift to higher potentials and the corresponding cathodic peaks to lower values, where the variation could demonstrate a more and more manifest irreversibility for Na3V2(PO4)2F3 at relatively larger scan rates. The reason for this is the uncompleted ion extraction/insertion from/into the electrode producing an un-sufficient redox reaction during the time interval of a high-rate scan, which could cause the irreversible behaviours.33 Especially for the hybrid-ion extraction/insertion system, the irreversible behaviours should be considered normal due to the existence of the larger and heavier Na+ ions which would be hysteretic in the electrochemical reaction compared with Li+ ions. In principle, only two alkali ions could extract/insert the crystallographic sites of Na3V2(PO4)2F3 no matter the ions are Na+ or Li+, and the electrochemically formed phase LixNa3−xV2(PO4)2F3 (x ≤ 2) would present a constant concentration of the alkali ions. Furthermore, the good liner relationships between the square root of the scan rate v1/2 and peak current ip as depicted in Fig. 9b illustrating a diffusion-controlled process for the whole electrode reaction and a typical equilibrium behaviour of an intercalated type electrode. Thus, the ion diffusion in the electrode should be treated as the rate-limiting step if the charge transfer at the interface is fast enough, while it is an important work to explore the diffused capability of these ions in this NASICON-type electrode. As suggested by previous works,20,33–36 Randles–Sevcik equation (eqn (1)) was used to calculate the diffusion constant D which describes the relationship between the peak current ip and the square root of the scan rate v1/2:
| ip/m = 0.4463(F3/RT)1/2n3/2AD1/2Cv1/2 | (1) |
As shown in Fig. 11a, the hybrid-ion batteries presented the initial specific capacities of 147, 132, 123, 115, 101 and 87.5 mA h g−1 at different current densities of 0.09, 0.1, 0.2, 0.5, 1 and 2 C (note that 1 C refers to the extraction of two ions per formula unit in 1 hour), respectively. There are two obvious discharge-voltage plateaus around 3.8 and 4.25 V vs. Li/Li+ for the first cycle profiles at 0.09 C, which should be responsible for the two ions extraction/insertion associated with V3+/V4+ redox reaction. Additionally, these two plateaus could be used to confirm that the extraction/insertion of two alkali ions from two Na(2) sites and one Na(1) site is a two-step process accompanied by structural reorganization. Otherwise, one plateau would be produced to realize the electrochemical behaviour of two ions with one couple redox reaction of V3+/V4+ in a relatively high voltage region such as 3–4.6 V vs. Li/Li+. This produced average discharge plateau of ca. 4 V vs. Li/Li+ with a high specific capacity of 140 mA h g−1 demonstrate that Na3V2(PO4)2F3 could be promising for the use as cathode in fabrication of a high-energy battery. The exhibited capacity in this work has exceeded the theoretical value of 128 mA h g−1 for Na3V2(PO4)2F3 provided that two ions could be reversibly extracted/inserted. Our previous conclusion could explain this result which demonstrated that the applied voltage range would play vital role in the migrated ion number and the redox reaction of the transitional metal in Na3V2(PO4)2F3 thus determine the performed capacity. However, the polarization of Na3V2(PO4)2F3 hybrid-ion batteries enhanced rapidly when the employed current increased which could be lowered by constant voltage charging method, and the slope shape in charging/discharging linked with a solid solution behaviour should be attributed to the uncompleted extraction/insertion of ions at a large current density, such as 2 C. Fig. 11b shows the C-rate and cycling performances of Na3V2(PO4)2F3. During the C-rate cycling, the average capacities of 130, 121, 112, 100 and 84 mA h g−1 could be obtained when the hybrid-ion batteries were tested at 0.1, 0.2, 0.5, 1 and 2 C, respectively. Moreover, this hybrid-ion battery could still exhibit a discharge capacity ca. 84 mA h g−1 with corresponding coulombic efficiency of 99% at 2 C after 190 galvanostatic charge/discharge cycles. The satisfied performances of stable capacity and high coulombic efficiency should be ascribed to the specialized NASICON structure of Na3V2(PO4)2F3 which provides three-dimensional channels for ion transport. In addition, Fig. 12a shows that Na3V2(PO4)2F3 could present an initial capacity of 111.5 mA h g−1 with a coulombic efficiency of 93% at 0.091 C in a sodium-ion battery. There are two obvious discharge plateaus around 4 and 3.5 V vs. Na+/Na with a third plateau at 3.3 V vs. Na+/Na, which are responsible for the insertion of two Na ions into two Na(2) sites and one Na(1) sites. Because the ions at Na(2) sites of Na3V2(PO4)2F3 have a high chemical potential,24 the insertion into Na(2) sits prefers to occur at a later stage in the discharge process. When Na ions insert into the Na sites step by step, the whole configuration would likely undergo related reorganization to a stable state, and thus, the three different inserted voltage plateaus should result from the structure reorganization and V3+/V4+ redox transformation. Interestingly, two discharge-voltage plateaus for lithium-ion batteries are presented around 3.8 and 4.25 V vs. Li/Li+ which are 0.3 and 0.25 V higher than the two main plateaus in sodium-ion batteries, respectively. It also could be used to explain that the inserted ions in the lithium-ion system are hybrid ions with main Li ions due to the voltage differences. Meanwhile, the predominant insertion of Li ions would prefer to be divided into two steps with corresponding two plateaus, mainly due to the easy-going characteristics of Li ions. The corresponding cycling performances tested under a current density of 0.91 C have presented a specific capacity of 87 mA h g−1 and a coulombic efficiency of 92% for the 102th cycle as displayed in Fig. 12b, which are comparably acceptable towards to the performances of sodium-ion batteries. However, it is reasonable to believe that Na3V2(PO4)2F3 is multifunctional and capable to exhibit well properties no matter in lithium-ion or sodium-ion batteries, and seems suitable for the fabrication of high-energy batteries by employing it in lithium-ion batteries.
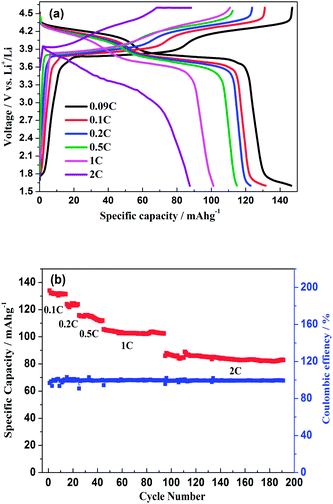 | ||
| Fig. 11 (a) Initial charge/discharge profiles of Na3V2(PO4)2F3 hybrid-ion batteries at different current densities. (b) The C-rate and cycling performances of Na3V2(PO4)2F3 hybrid-ion battery. | ||
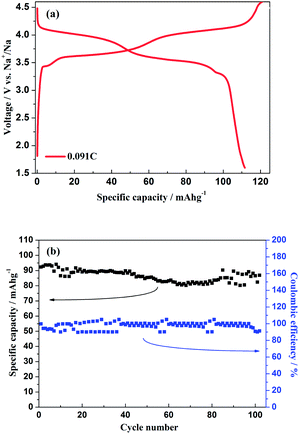 | ||
| Fig. 12 (a) Initial charge/discharge profiles of Na3V2(PO4)2F3 hybrid-ion battery at 0.091 C. (b) The cycling performances of Na3V2(PO4)2F3 hybrid-ion battery at 0.91 C. | ||
EIS was further used to explore the electrochemical kinetics of Na3V2(PO4)2F3 when the hybrid-ion battery cycled after 5 and 100 cycles at 0.1 C and charged to a same voltage of 3.2 V. The corresponding Nyquist plots are given in Fig. 13a, from which the small intercept at the Zre axis is attributed to the internal resistance of the battery. The semi-circle in the high frequency region is due to the resistance of SEI film, while the other one in the middle frequency region is resulted from the charge transfer resistance. The sloping line in the low frequency region should correspond to the diffusion of alkali ions in the electrode bulk, namely Warburg impedance. Fig. 13b displays the fitted equivalent circuit and all the impedance parameters with relative errors estimate (%) of the fitting equivalent circuit are listed in Table 1 by using ZSimWin software. Here, R1 represents the internal resistance involving the resistance of the electrolyte and electrode and R2 corresponds to the resistance of SEI film while C1 signifies the resultant capacitance from SEI film. R3 is the charge transfer resistance in the intermediate-frequency region and CPE1 is related to the surface property of the electrode. R4 denotes the Warburg resistance and C2 demonstrate the double layer capacitance caused by ion transfer in the electrode material. It is could be seen from the table that all the resistances for Na3V2(PO4)2F3 hybrid-ion batteries have increased when galvanostatic charge/discharge cycles from the 5th to 100th. However, the SEI resistance seemed not to enhance much compared with others which could illustrate that the SEI film basically formed during the first several cycles would change very little in the following cycles.29 In contrast, the charge transfer resistance is strongly influenced by cycling increased from 171.8 Ω for the 5th cycle to 847.9 Ω for the 100th cycle. This factor might be mainly responsible for the capacity fading in cycling and high C-rate performances.29 In addition, the slopes of the Nyquist plots at low frequency changed obviously to be nearly 45° from the 5th to the 100th cycle, indicating an enhanced solid-state diffusion of ions in the active materials. This is likely because the three-dimensional channels of the NASICON framework has been activated to open smoothly during cycling accompanied by relatively appropriate structural reorganization.24 Furthermore, the characteristically sloping line of the 100th cycle could further confirm the electrochemistry process of Na3V2(PO4)2F3 to be diffusion-controlled rather than surface-controlled.
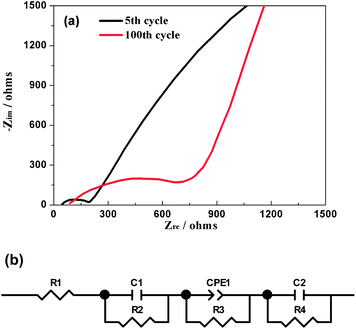 | ||
| Fig. 13 (a) Nyquist plots of the hybrid-ion battery charged to 3.2 V vs. Li+/Li for the 5th and 100th cycle. (b) The equivalent circuit model. | ||
| R 1 (Ω cm−2) | C 1 (F cm−2) | R 2 (Ω cm−2) | CPE1 (S s1/2 cm−2) | R 3 (Ω cm−2) | C 2 (F cm−2) | R 4 (Ω cm−2) | |
|---|---|---|---|---|---|---|---|
| Result5 | 41.25 | 3.91 × 10⁻³ | 172.5 | 5.49 × 10⁻⁵ | 171.8 | 5.36 × 10⁻³ | 404.8 |
| Error5 | 2.436 | 6.624 | 6.594 | 12.77 | 1.871 | 2.127 | 4.703 |
| Result100 | 77.87 | 7.13 × 10⁻⁴ | 196.2 | 3.7 × 10⁻⁵ | 847.9 | 4.94 × 10⁻⁴ | 773.0 |
| Error100 | 2.02 | 4.214 | 8.321 | 6.579 | 1.618 | 1.775 | 6.14 |
4. Conclusions
NASICON-type Na3V2(PO4)2F3 was prepared by an improved carbothermal reduction method with irregularly shaped particles distributed in the range of 0.5–1 μm. The produced particles were shown to be coated with carbon on the surface with the thickness between 25 and 32 nm, and the total residual carbon content was nearly 9.2% which were considered beneficial for the improvement of the particles conductivity. The crystallographic planes (hkl) of this crystal Na3V2(PO4)2F3 were firstly suggested to be labelled based on DFT calculations with a good crystallinity of 94.4%. A specific capacity of 147 mA h g−1 with an average discharge plateau around 4 V vs. Li+/Li, as well as an excellent C-rate and cycling performances have been presented for Na3V2(PO4)2F3 lithium-ion batteries and 111.5 mA h g−1 with three discharge plateaus at 4, 3.5 and 3.3 V vs. Na+/Na for sodium-ion batteries. By comparing the redox potentials from CV and charge/discharge curves, it is found that the inserted ions would be predominantly Li ions from the first cycle and more favoured to migrate from/into the crystallographic sites of Na3V2(PO4)2F3 to obtain satisfactory properties by a two-step process. This multifunctional Na3V2(PO4)2F3 with three-dimensional open framework has a fast ion diffusion with a magnitude of 10−11 cm2 s−1, which could be responsible for the excellent electrochemical properties, and is capable to be used as a promising cathode in construction of high-energy batteries.Acknowledgements
Financial supports from the NNSF of China (no. 51134007, 21003161, 21250110060), Program for the New Century Excellent Talents in University (no. NCET-11-0513), Funds for Distinguished Young Scientists of Hunan Province, China (no. 13JJ1004), Fundamental Research Funds for Central South University (no. 2013zzts159, no. 2012zzts059) and Innovation and Entrepreneurship Training Program of China for University Students are greatly appreciated.Notes and references
- M. Armand and J. M. Tarascon, Nature, 2008, 451, 652–657 CrossRef CAS PubMed.
- B. Dunn, H. Kamath and J.-M. Tarascon, Science, 2011, 334, 928–935 CrossRef CAS PubMed.
- K. Saravanan, C. W. Mason, A. Rudola, K. H. Wong and P. Balaya, Adv. Energy Mater., 2013, 3, 444–450 CrossRef CAS.
- J. B. Goodenough and Y. Kim, Chem. Mater., 2009, 22, 587–603 CrossRef.
- V. Aravindan, J. Gnanaraj, Y.-S. Lee and S. Madhavi, J. Mater. Chem. A, 2013, 1, 3518 CAS.
- M. M. Thackeray, C. Wolverton and E. D. Isaacs, Energy Environ. Sci., 2012, 5, 7854–7863 CAS.
- M. S. Whittingham, Proc. IEEE, 2012, 100, 1518–1534 CrossRef CAS.
- N.-S. Choi, Z. Chen, S. A. Freunberger, X. Ji, Y.-K. Sun, K. Amine, G. Yushin, L. F. Nazar, J. Cho and P. G. Bruce, Angew. Chem., Int. Ed., 2012, 51, 9994–10024 CrossRef CAS PubMed.
- F. Wu, N. Li, Y. Su, H. Shou, L. Bao, W. Yang, L. Zhang, R. An and S. Chen, Adv. Mater., 2013, 25, 3722–3726 CrossRef CAS PubMed.
- B. L. Ellis, W. R. M. Makahnouk, Y. Makimura, K. Toghill and L. F. Nazar, Nat. Mater., 2007, 6, 749–753 CrossRef CAS PubMed.
- A. K. Padhi, K. S. Nanjundaswamy and J. B. Goodenough, J. Electrochem. Soc., 1997, 144, 1188–1194 CrossRef CAS PubMed.
- T. Jiang, Y. J. Wei, W. C. Pan, Z. Li, X. Ming, G. Chen and C. Z. Wang, J. Alloys Compd., 2009, 488, L26–L29 CrossRef CAS PubMed.
- C. Masquelier, A. K. Padhi, K. S. Nanjundaswamy and J. B. Goodenough, J. Solid State Chem., 1998, 135, 228–234 CrossRef CAS.
- S.-W. Kim, D.-H. Seo, X. Ma, G. Ceder and K. Kang, Adv. Energy Mater., 2012, 2, 710–721 CrossRef CAS.
- S. I. Park, I. Gocheva, S. Okada and J.-i. Yamaki, J. Electrochem. Soc., 2011, 158, A1067–A1070 CrossRef CAS PubMed.
- H. Kabbour, D. Coillot, M. Colmont, C. Masquelier and O. Mentre, J. Am. Chem. Soc., 2011, 133, 11900–11903 CrossRef CAS PubMed.
- Z. Jian, W. Han, X. Lu, H. Yang, Y.-S. Hu, J. Zhou, Z. Zhou, J. Li, W. Chen, D. Chen and L. Chen, Adv. Energy Mater., 2013, 3, 156–160 CrossRef CAS.
- J. Kang, S. Baek, V. Mathew, J. Gim, J. Song, H. Park, E. Chae, A. K. Rai and J. Kim, J. Mater. Chem., 2012, 22, 20857–20860 RSC.
- K. Du, H. Guo, G. Hu, Z. Peng and Y. Cao, J. Power Sources, 2013, 223, 284–288 CrossRef CAS PubMed.
- W. Song, X. Ji, C. Pan, Y. Zhu, Q. Chen and C. E. Banks, Phys. Chem. Chem. Phys., 2013, 15, 14357–14363 RSC.
- J. Gopalakrishnan and K. K. Rangan, Chem. Mater., 1992, 4, 745–747 CrossRef CAS.
- B. L. Cushing and J. B. Goodenough, J. Solid State Chem., 2001, 162, 176–181 CrossRef CAS.
- N. Recham, J. N. Chotard, J. C. Jumas, L. Laffont, M. Armand and J. M. Tarascon, Chem. Mater., 2010, 22, 1142–1148 CrossRef CAS.
- R. A. Shakoor, D.-H. Seo, H. Kim, Y.-U. Park, J. Kim, S.-W. Kim, H. Gwon, S. Lee and K. Kang, J. Mater. Chem., 2012, 22, 20535–20541 RSC.
- J. Barker, R. K. B. Gover, P. Burns and A. J. Bryan, Electrochem. Solid-State Lett., 2006, 9, A190–A192 CrossRef CAS PubMed.
- R. K. B. Gover, A. Bryan, P. Burns and J. Barker, Solid State Ionics, 2006, 177, 1495–1500 CrossRef CAS PubMed.
- J. M. Le Meins, M. P. Crosnier-Lopez, A. Hemon-Ribaud and G. Courbion, J. Solid State Chem., 1999, 148, 260–277 CrossRef CAS.
- W. Song and S. Liu, Solid State Sci., 2013, 15, 1–6 CrossRef CAS PubMed.
- T. Jiang, G. Chen, A. Li, C. Z. Wang and Y. J. Wei, J. Alloys Compd., 2009, 478, 604–607 CrossRef CAS PubMed.
- C. Masquelier and L. Croguennec, Chem. Rev., 2013, 113, 6552–6591 CrossRef CAS PubMed.
- S. Y. Lim, H. Kim, R. A. Shakoor, Y. Jung and J. W. Choi, J. Electrochem. Soc., 2012, 159, A1393–A1397 CrossRef CAS PubMed.
- Z.-m. Liu, X.-y. Wang, Y. Wang, A.-p. Tang, S.-y. Yang and L.-f. He, Trans. Nonferrous Met. Soc. China, 2008, 18, 346–350 CrossRef.
- X. H. Rui, N. Ding, J. Liu, C. Li and C. H. Chen, Electrochim. Acta, 2010, 55, 2384–2390 CrossRef CAS PubMed.
- W. Song, X. Ji, Z. Wu, Y. Yang, Z. Zhou, F. Li, Q. Chen and C. E. Banks, J. Power Sources, 2014 DOI:10.1016/j.jpowsour.2014.01.025.
- W. Song, X. Ji, Y. Yao, H. Zhu, Q. Chen, Q. Sun and C. E. Banks, Phys. Chem. Chem. Phys., 2014 10.1039/c3cp54604g.
- W. Song, X. Ji, Z. Wu, Y. Zhu, Y. Y. Yao, K. H. Huangfu, Q. Chen and C. E. Banks, J. Mater. Chem. A, 2013 10.1039/c3ta14472k.
| This journal is © The Royal Society of Chemistry 2014 |

