 Open Access Article
 This Open Access Article is licensed under a
 Creative Commons Attribution 3.0 Unported Licence
Selective poisoning of Li–air batteries for increased discharge capacity
Jón Steinar G. Mýrdalab and
Tejs Vegge*a
aDepartment of Energy Conversion and Storage, Technical University of Denmark, Frederiksborgvej 399 Building 238, DK-4000 Roskilde, Denmark. E-mail: teve@dtu.dk
bCenter for Atomic-scale Materials Design, Technical University of Denmark, DK-2800 Lyngby, Denmark
First published on 19th March 2014
Abstract
The main discharge product at the cathode of non-aqueous Li–air batteries is insulating Li2O2 and its poor electronic conduction is a main limiting factor in the battery performance. Here, we apply density functional theory calculations (DFT) to investigate the potential of circumventing this passivation by controlling the morphological growth directions of Li2O2 using directed poisoning of specific nucleation sites and steps. We show SO2 to bind preferentially on steps and kinks on the (1−100) facet and to effectively lower the discharge potential by 0.4 V, yielding a more facile discharge on the (0001) surface facet. Addition of a few percent SO2 in the O2 stream may be used to control and limit growth of Li2O2 in specific directions and increase the electronic conduction through formation of interfaces between Li2O2 and Li2(SO2)-type inclusions, which may ultimately lead to an increased accessible battery capacity at the expense of a limited increase in the overpotentials.
The demand for high-density energy storage solutions for electric appliances has increased the research on metal–air batteries dramatically in recent years.1 Despite the large success of the Li-ion battery from its early days in the 1990's, there is a significant push for more energy dense batteries. Even though there is still room for improving the Li-ion battery technology, there are fundamental limitations on how high energy densities can be reached in the frame of the Li-ion technology.2 Today, one of the main limitations on the applicability of electronic products, such as laptop computers, smartphones and power tools is the time you can work without a recharge. This limitation becomes an even larger factor for electric vehicles (EV), where the competition is from highly energy dense fossil or synthetic fuels.
Of all the metal–air batteries, Li–air is the one with the highest theoretical energy density. It is estimated that if a commercially viable, secondary Li–air battery can be developed, it could have up to an order of magnitude higher energy density than modern Li-ion batteries.2 A Li–O2 battery with aprotic solvent was first shown to be rechargeable in 1996 by Abraham et al., where Li2O2 was formed at the cathode during discharge.3 The massive interest in Li–air batteries as future, high energy density batteries has resulted in a plethora of publications and significant new insight, into the fundamental mechanisms and challenges, of aprotic Li–O2 batteries has been gained in the last few years.4
A number of challenges do, however, remain to be overcome before the Li–air technology will be a practical application. A significant limitation for high capacity and power density Li–O2 batteries is the insulating nature of the Li2O2 deposits. With a band gap of 4.9 eV, as obtained from G0W0 calculations,5 Li2O2 will ultimately limit the electronic conduction from the electrode to the active site.6–8 It has been documented that the electronic conduction through Li2O2 becomes limiting for the electrochemical discharge already after a ∼5 nm film is deposited (depending on the current density).7 Furthermore, it has been suggested that the high impedance of the Li–O2 cells is the main contributor to overpotential during discharge at reasonable current denisties,9 meaning that the poor conductivity of Li2O2 not only limits the capacity of the battery but also its efficiency.
An essential aspect of resolving the conduction limitation is to understand the mechanisms governing growth and depletion of Li2O2 on Li2O2. Computational work by Hummelshøj et al.5 showed that steps on reconstructed (1−100) surface could act as nucleation sites for low overpotential discharge. Subsequent work by e.g. Radin et al.,10,11 Lau et al.12 and Mo et al.13 has shown that a number of other facets have similar surface energies and will likely be exposed, including (0001), (1−100) and (11−20). Recent work by Hummelshøj et al.14 has shown that the surface termination will depend on potential and can be different under charge and discharge conditions, but kinks and steps on (1−100) and (0001) surfaces will control the growth of Li2O2 at lower current densities.
Computational and experimental work has shown that although coherent electron transport through Li2O2 is limited,6,7 hybrid functional (HSE06) and PBE + U calculations show that polaronic transport may still be significant, both in the bulk as hole,15 electron16 or surface polarons.11 Luntz et al. showed that polaronic transport can significantly increase the discharge capacity at low current densities and high temperature.17 Work by Garcia-Lastra et al.8 has demonstrated preferential conduction in the directions perpendicular to the [0001] direction, e.g. the [1−100] and [11−20] directions. This may explain the formation of toroidal Li2O2 particles consisting of stacked Li2O2 platelets with a highly uniform size and shape as observed by Mitchell et al. using HRTEM.18 These platelets reach a thickness of about 5 nm in the [0001] direction and a up to 200 nm in radius in the [1−100] directions.18 A detailed control of the directions of growth and the Li2O2 morphology is therefore expected to affect and even postpone the onset of sudden death resulting from lack of electronic conduction.
Large organic molecules such as sodium dodecyl sulfate (SDS) have been used to control the morphology of oxide particles during electrochemical growth.19 Selective blocking of nucleation sites could, thus, enable preferential growth in directions where the electronic conduction is facile and/or formation of e.g. nanopillars or particles,20 where surface conduction might be sufficient or it could simply delay the complete coverage of the electrode, in order to sustain the electrochemical discharge. It is well documented in the catalysis literature21,22 that sulfur preferentially adsorbs to kink and step sites and here we combine these aspects to proactively control the Li2O2 growth morphology by addition of sulfur rich species during battery discharge. Much research has gone into the development of both primary and secondary Li–SO2 batteries with high specific energy,23 as well as recent results on ionic liquid electrolytes have shown great promise.24 Li–O2 and Li–SO2 batteries have nearly identical open cell voltages favoring simultaneous discharge and the presence of SO2 can also help prevent lithium dendrites formation at the lithium anode.23 In combination with the anticipated beneficial effects on morphological control and improved electronic conduction outlined above, these aspects make it interesting to investigate the effect of SO2 addition to the Li–O2 chemistry.
In this letter, we present a computational investigation of the binding of S and SO2 on kink and step sites of (1−100) and oxygen rich (0001) Li2O2 surfaces and determine the implications for the electrochemical discharge and growth of Li2O2. The goal of this study is to investigate if selective poisoning can be used to control the growth direction of the Li2O2 deposit and postpone the formation of passivating layers that prevent charge transfer to reactive sites.4b We use the computational lithium electrode approach5 to determine the free energy of the reaction intermediates and to identify the preferred reaction mechanisms and the corresponding charge/discharge potentials, where the reaction is no longer exergonic. With the lithium electrode we define U = 0 V when bulk Li and (Li+ + e−) are at equilibrium, so that at an applied bias the change in free energy during a reaction is shifted by −neU, where n is the number of electrons that are reacted at the cathode.
All calculations presented here were performed using density functional theory (DFT)25,26 as it is implemented in the GPAW code,27,28 using the atomic simulation environment (ASE).29 GPAW is based on real space grids and uses the projector-augmented wave method (PAW) to describe non-valence electrons.30,31 The RPBE functional is used to approximate the electrons exchange and correlation.32 For the (1−100) surface calculations we used super cells consisting of 56–64 atoms slab with an approximately 18 Å vacuum layer between periodic images along the z-axis. The super cell is sampled with (4,4,1) k-point mesh and the distance between grid points is 0.15 Å. For the (0001) surface calculations, the super cells consisted of 121–124 atoms and was sampled with a (2,2,1) k-point mesh and 0.15 Å grid spacing. For the atomic structural energy minimization the calculation is continued until all forces are below 0.03 eV Å−1. Transition barriers were calculated using the nudged elastic band and climbing image methods.33–35
To study the reaction of S and SO2 on (1−100) (Fig. 1) and (0001) (Fig. 2) surfaces and the effect their presence has on the Li2O2 growth, we first calculate the reaction mechanisms for two formula units of Li2O2 at a step on a (1−100) surface, following the approach previously used by Hummelshøj et al.5,14 This leaves the surface unchanged and prevents energy differences from changing the concentration of surface defects between the initial to the final state from influencing the free energy of the overall reaction paths.
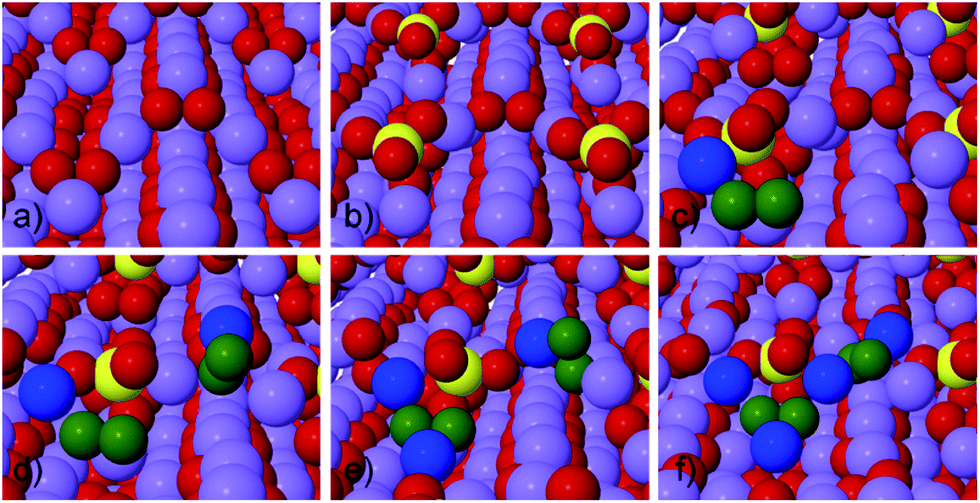 | ||
| Fig. 1 Structure of stepped Li2O2 (1−100) surface before and after adsorption of SO2, as well as possible reaction steps during discharge. (a) Clean stepped Li2O2 (1−100) surface. (b) SO2 adsorbs to the valley site of the step forming SO4 like surface species. (c) LiO2 binds to surface. (d) 2nd LiO2 binds to surface. (e) Li binds to surface. (f) Second Li binds to surface, finishing discharge of 2 f.u., the growth of the step effectively moves the SO2 from the step to the less favorable terrace site. Atoms are shown as: Li purple, O red and S yellow. Li and O deposited at the step are shown blue and green, respectively. | ||
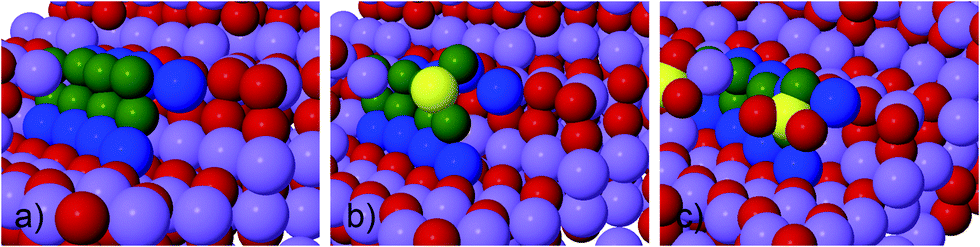 | ||
| Fig. 2 Surface structure of a step and a kink at Li2O2 (0001) surface, before and after adsorption with S and SO2 has taken place. (a) Clean kink, (b) S adsorbs at the kink site and forms SO2 like surface species, (c) SO2 adsorbs at the kink site and form SO4 like surface species. Atoms are shown as: Li purple, O red and S yellow. Li and O making up one calculation super cell at the step are shown blue and green, respectively. | ||
We considered 4 step reaction mechanisms on (1−100),5,14 where all reaction steps are electrochemical and involve either Li+ or LiO2+. The calculations yield a heat of formation for Li2O2 of ΔH = −6.09 eV and free energy of formation of ΔG = −5.46 eV, which is slightly lower than the experimental values ΔHExp = −6.56 eV and ΔGExp = −5.91 eV.36 This gives us an equilibrium potential U0 = −ΔG/2e = 2.73 V compared the experimental value U0,Exp = 2.96 V. The difference between experimental and calculated values does not affect the conclusions here about the relative changes in the overpotentials.
For the considered reaction mechanisms we obtain a free energy difference for each of the four reaction steps, ΔGi, see Fig. 3. At zero potential all the reaction steps are downhill in free energy, but with an applied potential the free energy difference changes for each step as ΔGi,U = ΔGi − eU. For discharge the reaction will start to become limited when the lowest free energy step along the reaction path becomes uphill at the applied potential, Udis = min[−ΔGi/e] = 2.66 V. In the same way it is the largest free energy step that is last to become downhill for the reversed reaction, at an applied potential of Uch = max[−ΔGi/e] = 2.81 V, opening up for charging. The overpotentials for discharge and charge are then given by ηdis = U0 − Udischarge = 0.07 V and ηch = Uch − U0 = 0.08 V, respectively.
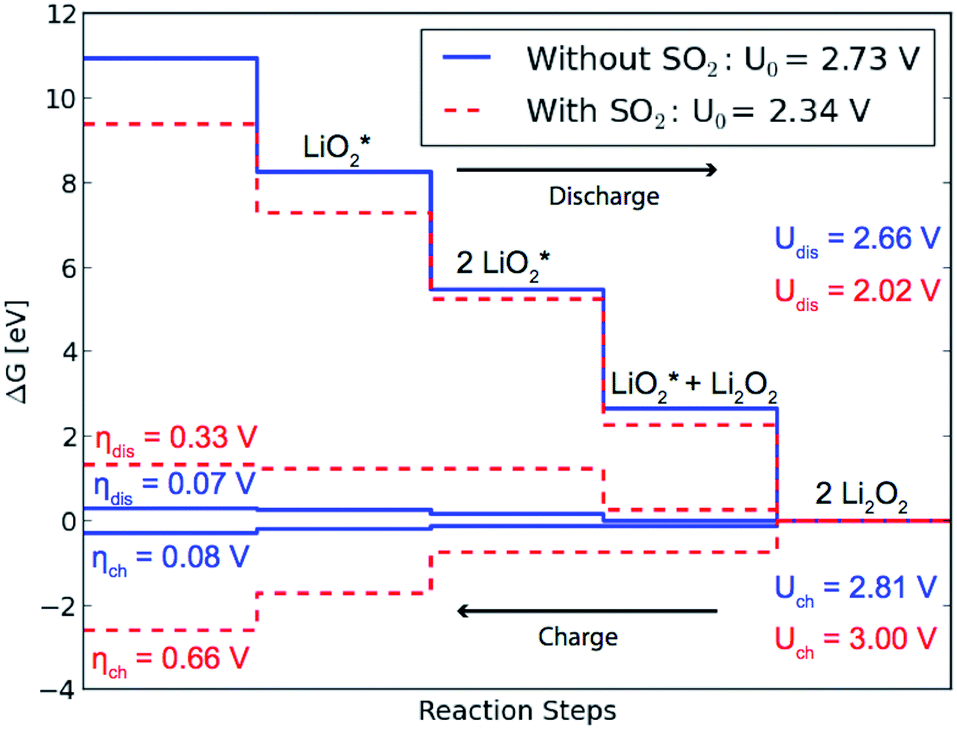 | ||
| Fig. 3 Calculated free energy diagrams for discharge from stepped (1−100) surface with and without adsorbed SO2. The diagram shows how the adsorbed SO2 lowers the equilibrium potential and thereby the effective discharge potential making the discharge less favorable in the presence of SO2. | ||
As can be seen in Table 1, atomic sulfur is found to bind preferentially at the step/kink sites on the (0001) surface (see Fig. 2b) by nearly 0.8 eV compared to the step valley site on (1−100). Trace amounts of S in the electrolyte would therefore poison the step sites on the (0001) facets. In light of the oxidizing conditions at the air electrode, it is, however, expected that SOx, e.g. SO2, species will be formed readily.
| Species | Surface | Site | Eadsorption [eV] |
|---|---|---|---|
| S | (1−100) | Step ridge | −1.33 |
| Step valley | −1.72 | ||
| Terrace valley | −0.61 | ||
| S | (0001) | Step | −2.50 |
| SO2 | (1−100) | Step ridge | −3.47 |
| Step valley | −3.73 | ||
| Terrace valley | −2.18 | ||
| SO2 | (0001) | Step | −3.29 |
| 2nd SO2 | (1−100) | Step ridge | −3.05 |
SO2 is soluble in relevant ether-based electrolytes like DME37 and SO2 is seen to bind preferentially by ∼0.5 eV at the step sites on (1−100) compared to (0001). A reduction of ∼0.4 eV in the binding energy is seen for SO2 at higher concentrations, indicating that at low concentration they will spread over the step edges rather than cluster in high concentration islands (see Table 1).
The presence of SO2 at the step valley site (see Fig. 1b) is found to reduce the binding energy of the initial LiO*2 species (c) compared to the pure discharge. The preferred next step is the addition of the second LiO*2 species (d), followed by two Li+ additions (e) and (f). By completing the growth of Li2O2 at the step, SO2 is effectively displaced from the step to the less stable terrace site, resulting in a loss in the equilibrium potential of 0.39 eV compared to growth on a clean step, as can be seen in Fig. 3. The overpotential for discharge is also seen to increase from 0.07 eV to 0.33 eV resulting from a shift in the potential limiting step (see Fig. 1). This results in an effective lowering of the discharge potential by 0.54 eV, i.e. from Udis = 2.66 V to Udis-SO2 = 2.02 V. The overpotential for charge is seen to increase from 0.08 V to 0.66 V and the potential for charge is found to exceed that of the pure system for the calculated mechanism.
We have calculated the transition barrier for SO2 diffusion between the terrace and the step valley sites on the (1−100) surface. The calculations shows a transition barrier of 3.2 eV going from the terrace to the step, indicating that diffusion of SO2 between different sites is unlikely, once it has been adsorbed. For adsorption of SO2 onto the terrace site a small transition barrier of 0.3 eV was seen. It should be noted that the absolute activation and absorption energies will depend on solvation energies in the electrolyte and will require more complex calculations beyond the scope of this letter.
The SO2 poisoning would thus force the reaction to other pathways with slightly higher overpotential. It is also possible that the charging process may proceed through another mechanism, e.g. as proposed by Peng et al.,38 which has not been considered here.
The concentration of step sites on surfaces differ between materials and the conditions under which they are grown,21 e.g. the current density for Li2O2, but only a few percent of a monolayer of SO2, i.e. 1–2% SO2 in the gas feed/electrolyte, should be needed to dramatically reduce the activity of a given facet and change the growth direction. The inclusions of Li2(SO2)-type species in the Li2O2 matrix may ultimately also improve the electronic conduction through the formation of interfacial defects.
Conclusions
The results indicate that selective poisoning with low concentrations (1–2%) of SO2 in the O2 feed or electrolyte will preferentially bind to step edges on the (1−100) facets and limit the initial growth on these facets. The substantial decrease in the discharge potential, lead by the lowering of the equilibrium potential, results in a shift of the Li2O2 growth from the kink sites on (1−100) surface to kink sites on the (0001) surface14 (see Fig. 2). This process may limit rapid growth of passivating 2D platelet/islands, introduce conducting interface regions and postpone the onset of sudden death resulting from loss of electronic conduction. Experimental activities are currently ongoing to quantify which level of increase in accessible discharge capacity can be achieved.Acknowledgements
The authors acknowledge support from the ReLiable project (project nr. 11-116792) funded by the Danish Council for Strategic Research - Programme Commission on Sustainable Energy and Environment.Notes and references
- N. Garcia-Araez and P. Novák, J. Solid State Electrochem., 2013, 17, 1793–1807 CrossRef CAS.
- T. Ogasawara, A. Débart, M. Holzapfel, P. Novák and P. G. Bruce, J. Am. Chem. Soc., 2006, 128, 1390–1393 CrossRef CAS PubMed.
- K. M. Abraham and Z. Jiang, J. Electrochem. Soc., 1996, 143, 1–5 CrossRef CAS.
- (a) Y.-C. Lu, B. M. Gallant, D. G. Kwabi, J. R. Harding, R. R. Mitchell, M. S. Whittingham and Y. Shao-Horn, Energy Environ. Sci., 2013, 6, 750 RSC; (b) Y. S. Mekonnen, K. B. Knudsen, J. S. G. Mýrdal, R. Younesi, J. Højberg, J. Hjelm, P. Norby and T. Vegge, J. Chem. Phys., 2014, 140, 111201 CrossRef PubMed.
- J. S. Hummelshøj, J. Blomqvist, S. Datta, T. Vegge, J. Rossmeisl, K. S. Thygesen, A. C. Luntz, K. W. Jacobsen and J. K. Nørskov, J. Chem. Phys., 2010, 132, 071101 CrossRef PubMed.
- J. Chen, J. S. Hummelshøj, K. S. Thygesen, J. S. G. Myrdal, J. K. Nørskov and T. Vegge, Catal. Today, 2011, 165, 2–9 CrossRef CAS.
- V. Viswanathan, K. S. Thygesen, J. S. Hummelshøj, J. K. Nørskov, G. Girishkumar, B. D. McCloskey and A. C. Luntz, J. Chem. Phys., 2011, 135, 214704 CrossRef CAS PubMed.
- J. M. Garcia-Lastra, J. S. G. Myrdal, R. Christensen, K. S. Thygesen and T. Vegge, J. Phys. Chem. C, 2013, 117, 5568–5577 CAS.
- V. Viswanathan, J. K. Nørskov, A. Speidel, R. Scheffler, S. Gowda and A. C. Luntz, J. Phys. Chem. Lett., 2013, 4, 556–560 CrossRef CAS PubMed.
- M. D. Radin, J. F. Rodriguez, F. Tian and D. J. Siegel, J. Am. Chem. Soc., 2012, 134, 1093–1103 CrossRef CAS PubMed.
- M. D. Radin, F. Tian and D. J. Siegel, J. Mater. Sci., 2012, 47, 7564–7570 CrossRef CAS.
- K. C. Lau, L. a. Curtiss and J. Greeley, J. Phys. Chem. C, 2011, 115, 23625–23633 CAS.
- Y. Mo, S. Ong and G. Ceder, Phys. Rev. B, 2011, 84, 205446 CrossRef.
- J. S. Hummelshøj, A. C. Luntz and J. K. Nørskov, J. Chem. Phys., 2013, 138, 034703 CrossRef PubMed.
- S. Ong, Y. Mo and G. Ceder, Phys. Rev. B, 2012, 85, 081105 CrossRef.
- J. Kang, Y. S. Jung, S.-H. Wei and A. Dillon, Phys. Rev. B, 2012, 85, 035210 CrossRef.
- A. C. Luntz, V. Viswanathan, J. Voss, J. B. Varley, J. K. Nørskov, R. Scheffler and A. Speidel, J. Phys. Chem. Lett., 2013, 4, 3494–3499 CrossRef CAS.
- R. R. Mitchell, B. M. Gallant, Y. Shao-horn and C. V. Thompson, J. Phys. Chem. Lett., 2013, 4, 1060–1064 CrossRef CAS PubMed.
- M. J. Siegfried and K.-S. Choi, Adv. Mater., 2004, 16, 1743–1746 CrossRef CAS.
- R. R. Mitchell, B. M. Gallant, C. V. Thompson and Y. Shao-Horn, Energy Environ. Sci., 2011, 4, 2952 CAS.
- S. B. Vendelbo, M. Johansson, J. H. Nielsen and I. Chorkendorff, Phys. Chem. Chem. Phys., 2011, 13, 4486–4493 RSC.
- Y. Matsuzaki and I. Yasuda, Solid State Ionics, 2000, 132, 261–269 CrossRef CAS.
- G. T. K. Fey, J. Power Sources, 1991, 35, 153–162 CrossRef CAS.
- H. Xing, C. Liao, Q. Yang, G. M. Veith, B. Guo, X.-G. Sun, Q. Ren, Y.-S. Hu and S. Dai, Angew. Chem., Int. Ed., 2014, 53, 2099–2103 CrossRef CAS PubMed.
- P. Hohenberg and W. Kohn, Phys. Rev., 1964, 136, 864 CrossRef.
- W. Kohn and L. J. Sham, Phys. Rev., 1965, 140, 1133 CrossRef.
- J. J. Mortensen, L. B. Hansen and K. W. Jacobsen, Phys. Rev. B, 2005, 71, 035109 CrossRef.
- J. Enkovaara, C. Rostgaard, J. J. Mortensen, J. Chen, M. Dulak, L. Ferrighi, J. Gavnholt, C. Glinsvad, V. Haikola, H. A. Hansen, H. H. Kristoffersen, M. Kuisma, A. H. Larsen, L. Lehtovaara, M. Ljungberg, O. Lopez-Acevedo, P. G. Moses, J. Ojanen, T. Olsen, V. Petzold, N. A. Romero, J. Stausholm-Moller, M. Strange, G. A. Tritsaris, M. Vanin, M. Walter, B. Hammer, H. Hakkinen, G. K. H. Madsen, R. M. Nieminen, J. K. Nørskov, M. Puska, T. T. Rantala, J. Schiøtz, K. S. Thygesen and K. W. Jacobsen, J. Phys.: Condens. Matter, 2010, 22, 253202 CrossRef CAS PubMed.
- S. R. Bahn and K. W. Jacobsen, Comput. Sci. Eng., 2002, 4, 56–66 CrossRef CAS.
- P. E. Blöchl, Phys. Rev., 1994, 50, 17953 Search PubMed.
- P. E. Blöchl, C. J. Först and J. Schimpl, Bull. Mater. Sci., 2003, 26, 33–41 CrossRef.
- B. Hammer, L. B. Hansen and J. K. Nørskov, Phys. Rev. B, 1999, 59, 7413–7421 CrossRef.
- H. Jonsson, G. Mills and K. W. Jacobsen, Classical and Quantum Dynamics in Condensed Phase Systems, ed. B. J. Berne, G. Cicott and D. F. Coker, World Scientific, 1998 Search PubMed.
- G. Henkelman and H. Jónsson, J. Chem. Phys., 2000, 113, 9978 CrossRef CAS.
- G. Henkelman, B. Uberuaga and H. Jónsson, J. Chem. Phys., 2000, 113, 9901 CrossRef CAS.
- M. W. Chase, J. Phys. Chem. Ref. Data, Monogr., 1998, 1–1951 Search PubMed.
- D. C. Luehrs and K. a. Godbole, J. Solution Chem., 1994, 23, 1147–1160 CrossRef CAS.
- Z. Peng, S. a. Freunberger, L. J. Hardwick, Y. Chen, V. Giordani, F. Bardé, P. Novák, D. Graham, J.-M. Tarascon and P. G. Bruce, Angew. Chem., Int. Ed., 2011, 50, 6351–6355 CrossRef CAS PubMed.
| This journal is © The Royal Society of Chemistry 2014 |