 Open Access Article
 This Open Access Article is licensed under a
 Creative Commons Attribution 3.0 Unported Licence
Thermal-runaway experiments on consumer Li-ion batteries with metal-oxide and olivin-type cathodes
Andrey W. Golubkov*a,
David Fuchsa,
Julian Wagnerb,
Helmar Wiltschec,
Christoph Stangld,
Gisela Faulerd,
Gernot Voitice,
Alexander Thalera and
Viktor Hackere
aVIRTUAL VEHICLE Research Center, Inffeldgasse 21a, 8010 Graz, Austria. E-mail: andrej.golubkov@alumni.tugraz.at; Fax: +43-316-873-9002; Tel: +43-316-873-9639
bGraz Centre for Electron Microscopy, Steyrergasse 17, 8010 Graz, Austria
cInstitute of Analytical Chemistry and Food Chemistry, Graz University of Technology, Stremayrgasse 9/III, 8010 Graz, Austria
dVarta Micro Innovation GmbH, Stremayrgasse 9, 8010 Graz, Austria
eInstitute of Chemical Engineering and Environmental Technology, Graz University of Technology, Inffeldgasse 25/C/II, 8010 Graz, Austria
First published on 27th November 2013
Abstract
Li-ion batteries play an ever-increasing role in our daily life. Therefore, it is important to understand the potential risks involved with these devices. In this work we demonstrate the thermal runaway characteristics of three types of commercially available Li-ion batteries with the format 18650. The Li-ion batteries were deliberately driven into thermal runaway by overheating under controlled conditions. Cell temperatures up to 850 °C and a gas release of up to 0.27 mol were measured. The main gas components were quantified with gas-chromatography. The safety of Li-ion batteries is determined by their composition, size, energy content, design and quality. This work investigated the influence of different cathode-material chemistry on the safety of commercial graphite-based 18650 cells. The active cathode materials of the three tested cell types were (a) LiFePO4, (b) Li(Ni0.45Mn0.45Co0.10)O2 and (c) a blend of LiCoO2 and Li(Ni0.50Mn0.25Co0.25)O2.
1 Introduction
Li-ion batteries have been commercially available since 1991.1 As of 2013, Li-ion batteries are in wide use for portable electronics, such as cell phones and notebook computers. They are also gaining traction as a power source in electrified vehicles. Li-ion batteries have a high specific energy and favourable ageing characteristics compared to NiMH and lead acid batteries. However, there are concerns regarding the safety of Li-ion batteries. Abuse conditions such as overcharge, over-discharge and internal short-circuits can lead to battery temperatures far beyond the manufacturer ratings. At a critical temperature, a chain of exothermic reactions can be triggered. The reactions lead to a further temperature increase, which in turn accelerates the reaction kinetics. This catastrophic self-accelerated degradation of the Li-ion battery is called thermal runaway.2During thermal runaway, temperatures as high as 900 °C can be reached,3 and the battery can release a significant amount of burnable and (if inhaled in high concentrations) toxic gas.4 To quantify possible hazards of exothermic Li-ion battery over-temperature reactions, tests with complete batteries should be performed. Such experiments were undertaken with commercial Li-ion batteries produced for consumer electronics3–11 and with Li-ion batteries fabricated in the laboratory.12–16
This work investigated the thermal stability of three types of commercially available Li-ion batteries for consumer electronics. Particular attention was given to (1) the dynamics of the thermal responses of the cells, (2) the maximum temperatures reached, (3) the amount of gases produced and (4) to the production rates of the gases. To further assess the hazard potential of the released gases, samples were taken and analysed with a gas chromatography system.
2 Experimental
2.1 Brief description of the test rig
To carry out unrestricted thermal-runaway experiments, a custom-designed test stand was built (Fig. 1). The main component of the test rig is a heatable reactor with electric feedthroughs for the temperature measurement and the inner sample heating. The reactor has gas feedthroughs that connect it to an inert gas flask, to a gas sampling station and to a cold trap with an attached vacuum pump. The pressure inside the reactor is recorded by a pressure transmitter. The whole structure is hosted inside a fume hood to prevent any escaping of gases and electrolyte vapours.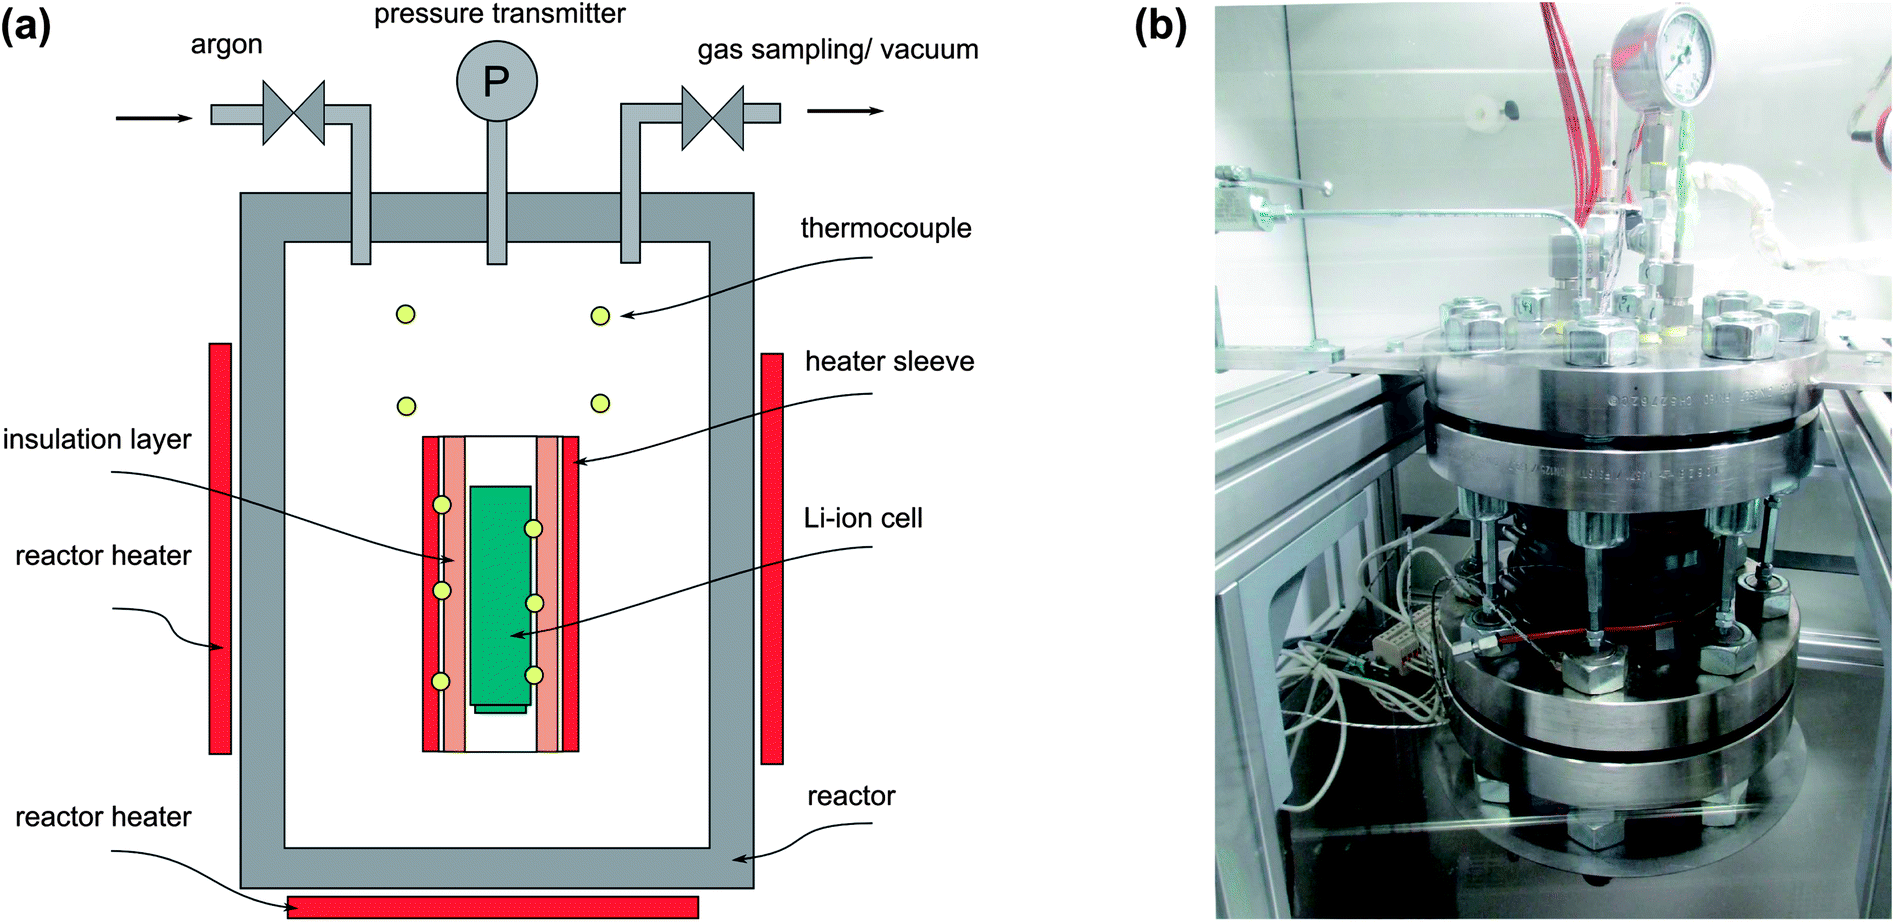 | ||
| Fig. 1 (a) The reactor and its principal elements. (b) The reactor is the main component of the test stand. | ||
A removable sample holder is placed inside the reactor. The sample holder consists of a metal structure, which houses a heating sleeve and the thermocouples. A Li-ion battery with the dimensions 18650 (cylindrical geometry with d = 18 mm and l = 65 mm) can be fitted into the centre of the heating sleeve. The inside wall of the heating sleeve is thermally insulated. The role of the thermal insulation layer is to provide the thermal connection between the heating sleeve and the sample. Due to the low thermal conductivity of the insulation layer, a thermal runaway reaction can proceed in adiabatic-like conditions. Ten thermocouples measure the temperature at different positions inside the reactor: three thermocouples are directly attached to the sample housing, three thermocouples are attached to the heating sleeve and four thermocouples measure the gas temperature inside the reactor.
2.2 Testing method
Initially, the sample battery is CC/CV charged to the respective cut-off voltage. Then, the plastic envelope is removed from the cell and the cell mass and cell voltage are recorded. Three thermocouples are welded to the cell housing, and the whole package is inserted into the heating sleeve of the sample holder. The sample holder is placed inside the reactor. The reactor is evacuated and flushed with argon gas twice. The heaters are set to constant power, and the pressure and temperature signals are recorded. In order to trace fast temperature and pressure changes, each signal is recorded with a high sampling rate of 5000 samples per second.When a critical temperature is reached, the cell goes into rapid thermal runaway: it produces gas and heat. During the thermal runaway, the temperature of the cell increases by several hundred degree Celsius in a few seconds. After the thermal-runaway event, the cell cools down slowly. Gas samples are taken and analysed with the gas chromatograph. In the next step, the vacuum pump is switched on, and the cooling trap is filled with liquid nitrogen. The gas is carefully released through the cooling trap and the vacuum-pump into the fume hood. The reactor and the gas tubes between the reactor and the cooling trap are heated above 130 °C to avoid gas condensation.
By following this procedure, most liquid residue in the reactor is passed from the reactor to the cooling trap. The liquid residue can be easily removed from the cooling trap before the next experiment run.
2.3 Gas analysis
The compositions of the sampled gases were analysed using a gas chromatograph (GC, Agilent Technologies 3000 Micro GC, two columns, Mol Sieve and PLOTU). A thermal conductivity detector (TCD) was used to detect permanent gases. The GC was calibrated for H2, O2, N2, CO, CO2, CH4, C2H2, C2H4 and C2H6. Ar and He were used as carrier gases.Note, that the current test set-up cannot detect HF, which can be a major source of toxicity of gas released by Li-ion batteries during thermal runaway.4
2.4 Cell-components identification
In order to identify the components of each cell species, several cells were disassembled: the cells were discharged to 2.0 V, and the cell casings were then carefully removed without causing short circuits. The exposed jelly rolls were subject to several tests.For electrolyte identification, the jelly rolls were immersed in flasks with CH2Cl2 solution immediately after casing removal. The solutions were then analysed using a gas-chromatography-mass spectrometry system (GC-MS: Agilent 7890 & MS 5975MSD) with the ChemStation software and the NIST spectrum library. To analyse the solid materials of the cells, the extracted jelly rolls were separated into the anode, cathode and separator layers. After drying in a chemical fume hood, anode and cathode-foil samples were taken for identification of the electrochemically active materials. Microwave-assisted sample digestion followed by inductively coupled plasma optical emission spectrometry (ICP-OES, Ciros Vision EOP, Spectro, Germany) was used to obtain the gross atomic compositions of the cathode active masses. A scanning-electron microscope with energy-dispersive X-ray spectroscopy (SEM/EDX: Zeiss Ultra55 & EDAX Pegasus EDX) was used to confirm the ICP-OES results for the compositions of the cathodes and to validate the anode materials.
For the mass-split calculation, the following procedure was followed for each cell type: positive and negative electrode samples were extracted from the jelly roll. The samples were rinsed with diethyl carbonate (DEC) and then dried again, in order to remove the remaining electrolyte residues from the active materials. The samples were weighed, and the geometries of the electrode foils were recorded, so that the mass split could be calculated. The amount of electrolyte was estimated as the mass difference between the initial cell mass and the calculated dry mass for each cell. The thickness of the active material layers on the electrode substrates was extracted from SEM images. The thicknesses of the aluminium and copper substrates were calculated from the measured area density. The thickness of the separator foils was measured with a micrometer.
2.5 Li-ion cells
18650 consumer cells with three types of chemistry were purchased for the experiments. The cells were produced by three well-known companies. For simplicity, the samples will be referred to as LFP, NMC and LCO/NMC cells, in order to reflect their respective cathode material. Despite the simple naming scheme, please note that the cells do not differ in the types of their cathode material alone. Naturally, they also have different layer geometries (Table 2) and different ratios of their component masses (Fig. 2), and there are differences in the composition of the active masses as well (Table 1).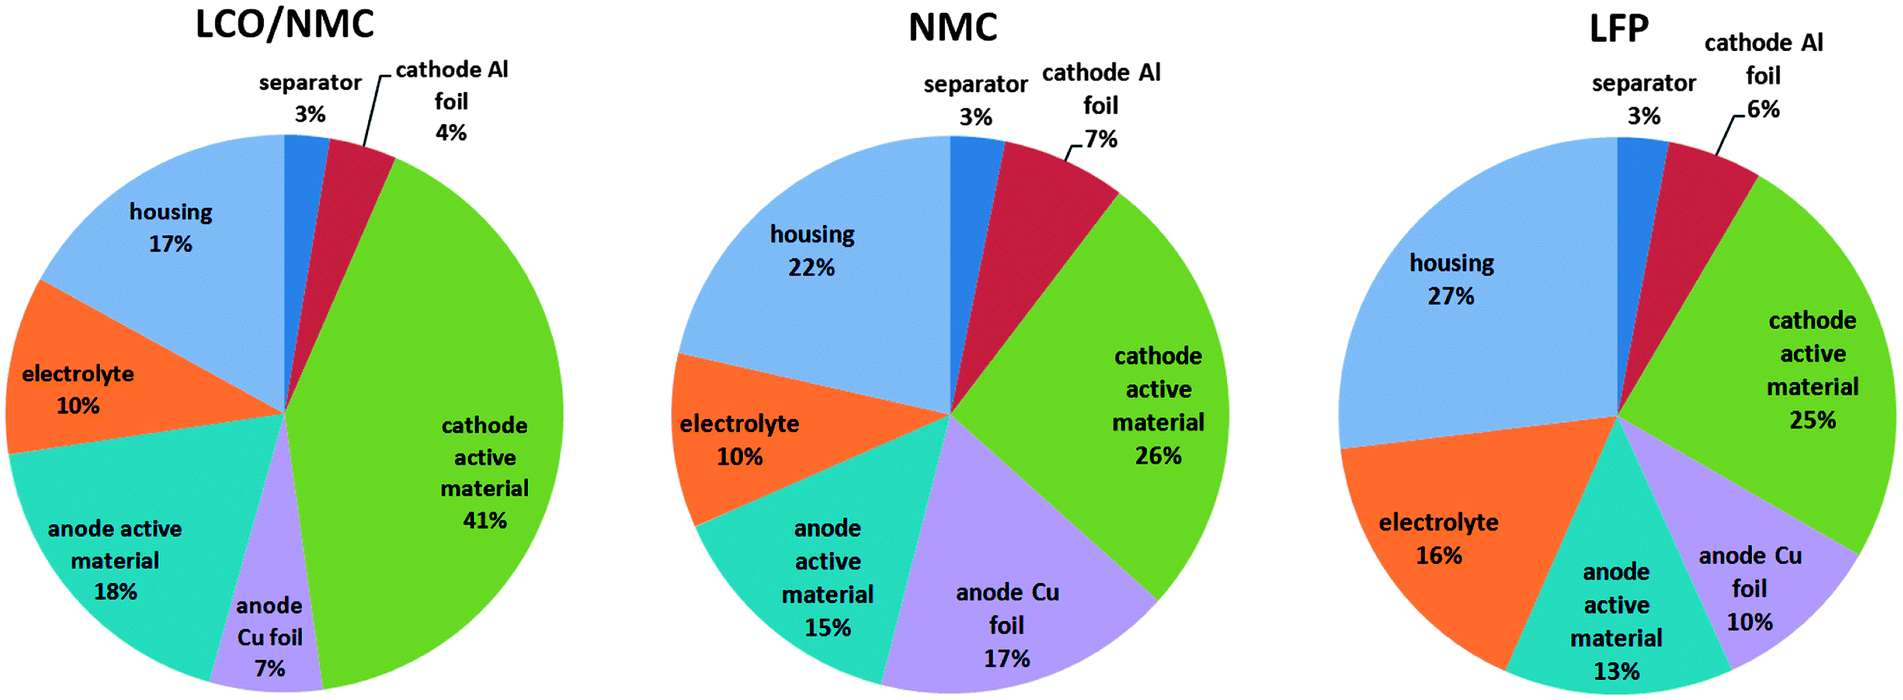 | ||
| Fig. 2 Mass split (m%) of the main components of the three cell species. | ||
| LCO/NMC | NMC | LFP | ||
|---|---|---|---|---|
| Cell mass | g | 44.3 | 43.0 | 38.8 |
| Capacity | A h | 2.6 | 1.5 | 1.1 |
| Minimum voltage | V | 3.0 | 3.0 | 2.5 |
| Maximum voltage | V | 4.2 | 4.1 | 3.5 |
| Electrolyte solvents | DMC![[thin space (1/6-em)]](https://www.rsc.org/images/entities/char_2009.gif) :EMC:EC (6:2:1) :EMC:EC (6:2:1) |
DMC:EMC:EC:PC (7:1:1:1) |
DMC:EMC:EC:PC (4:2:3:1) |
|
| Cathode material | LiCoO2:Li(Ni0.50Mn0.25Co0.25)O2 (2:1) |
Li(Ni0.45Mn0.45Co0.10)O2 | LiFePO4 | |
| Anode material | Graphite | Graphite | Graphite | |
| LCO/NMC | NMC | LFP | ||||||||||
|---|---|---|---|---|---|---|---|---|---|---|---|---|
| m (g) | A (cm2) | d (μm) | V (cm3) | m (g) | A (cm2) | d (μm) | V (cm3) | m (g) | A (cm2) | d (μm) | V (cm3) | |
| Separator | 1.2 | 942 | 19 | 1.8 | 1.4 | 944 | 23 | 2.2 | 1.2 | 940 | 20 | 1.9 |
| Cathode Al foil | 1.7 | 403 | 16 | 0.6 | 3.1 | 389 | 30 | 1.1 | 2.1 | 396 | 19 | 0.7 |
| Cathode active material | 18.3 | 715 | 91 | 6.5 | 11.3 | 654 | 67 | 4.4 | 9.7 | 793 | 70 | 5.5 |
| Anode Cu foil | 2.9 | 402 | 8 | 0.3 | 7.5 | 418 | 20 | 0.8 | 3.9 | 396 | 17 | 0.7 |
| Anode active material | 8.1 | 739 | 81 | 6.0 | 6.2 | 695 | 60 | 4.2 | 5.2 | 793 | 50 | 4.0 |
| Electrolyte | 4.6 | 4.4 | 6.4 | |||||||||
| Housing | 7.5 | 9.2 | 10.5 | |||||||||
| Sum | 44.3 | 15.2 | 43.1 | 12.7 | 39.0 | 12.8 | ||||||
• The LCO/NMC cell had a blended cathode with two types of electrochemically active particles LiCoO2 and Li(Ni0.50Mn0.25Co0.25)O2. A clean cut through the sample was done with a focused ion beam (FIB). Subsequently, EDX measurements of the bulk materials of individual cathode particles were performed. The ratio of LCO and NMC layered oxide particles was estimated by comparing the SEM-EDX and ICP-OES results. The resulting ratio of LCO and NMC was LCO:NMC = (66:34) with 5% uncertainty. The cells with LCO/NMC blended cathodes are a compromise to achieve high rate capability of LCO material and to maintain acceptable safety and high capacity of the NMC material.17 The average voltage of this cell was ∼3.8 V.
• The NMC cell had a Li(Ni0.45Mn0.45Co0.10)O2 layered oxide cathode. The properties of the NMC mixed oxide cathodes depended on the ratios of nickel, manganese and cobalt material. In general, NMC cells have an average voltage of ∼3.8 V and high specific capacity.18
• The LFP cell had a LiFePO4 cathode with olivine structure. This cathode type is known for featuring good safety characteristics. Commercial LiFePO4 cathode material for high power Li-ion batteries consists of carbon-coated LiFePO4 nano-scale particles. The cathode material is readily available and non-hazardous. Commercially available LFP cells have a lower operating voltage (∼3.3 V) than cells with LCO and NMC cathodes.18
The active anode materials consisted only of carbonaceous material for all cells, as verified by SEM/EDX. The exact types of graphite materials could not be identified.
2.6 Electrical characterisation
An electrical characterisation of the cells was done with a BaSyTec CTS cell test system. In the first step, the cells were discharged to their respective minimum voltage. In the second step, the cells were charged using a pulse-pause protocol, until the voltage of the cells stayed above their respective maximum voltage during a pause. The current pulses were set to 100 mA and 30 s. The duration of the pauses was set to 50 s. The open-circuit voltage (OCV) at the end of each pause and the charge capacity were recorded (Fig. 3). For the NMC cell, the cell manufacturer did not provide the voltage ratings. For safety reasons, 4.1 V was selected as the maximum voltage.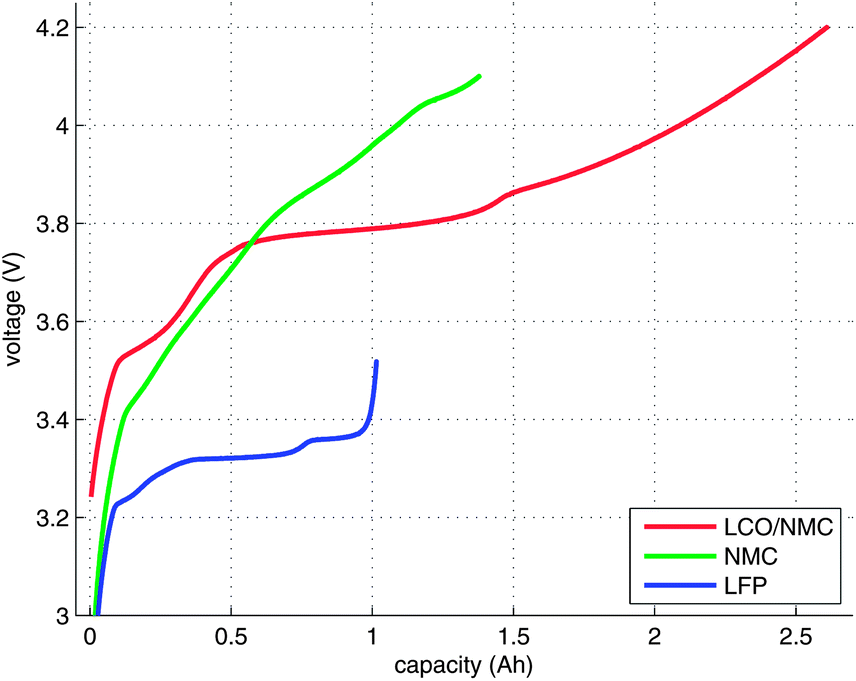 | ||
| Fig. 3 OCV profiles of the three cell species. | ||
3 Results and discussion
3.1 Typical course of a thermal runaway experiment
In order to illustrate the events during the heat-up process and the thermal runaway itself, one experiment with a NMC cell is described here in detail:The NMC sample cell was prepared as described above. At the start of the test, the cell heater sleeve was set to constant heating power. The sample was slowly heated, starting at 25 °C, with a heat-rate of ∼2 °C min−1. After reaching 220 °C, the cell went into rapid thermal runaway. The cell temperature rose from 220 °C to 687 °C in a few seconds. When the exothermic reaction ended, the cell cooled down slowly (Fig. 4a).
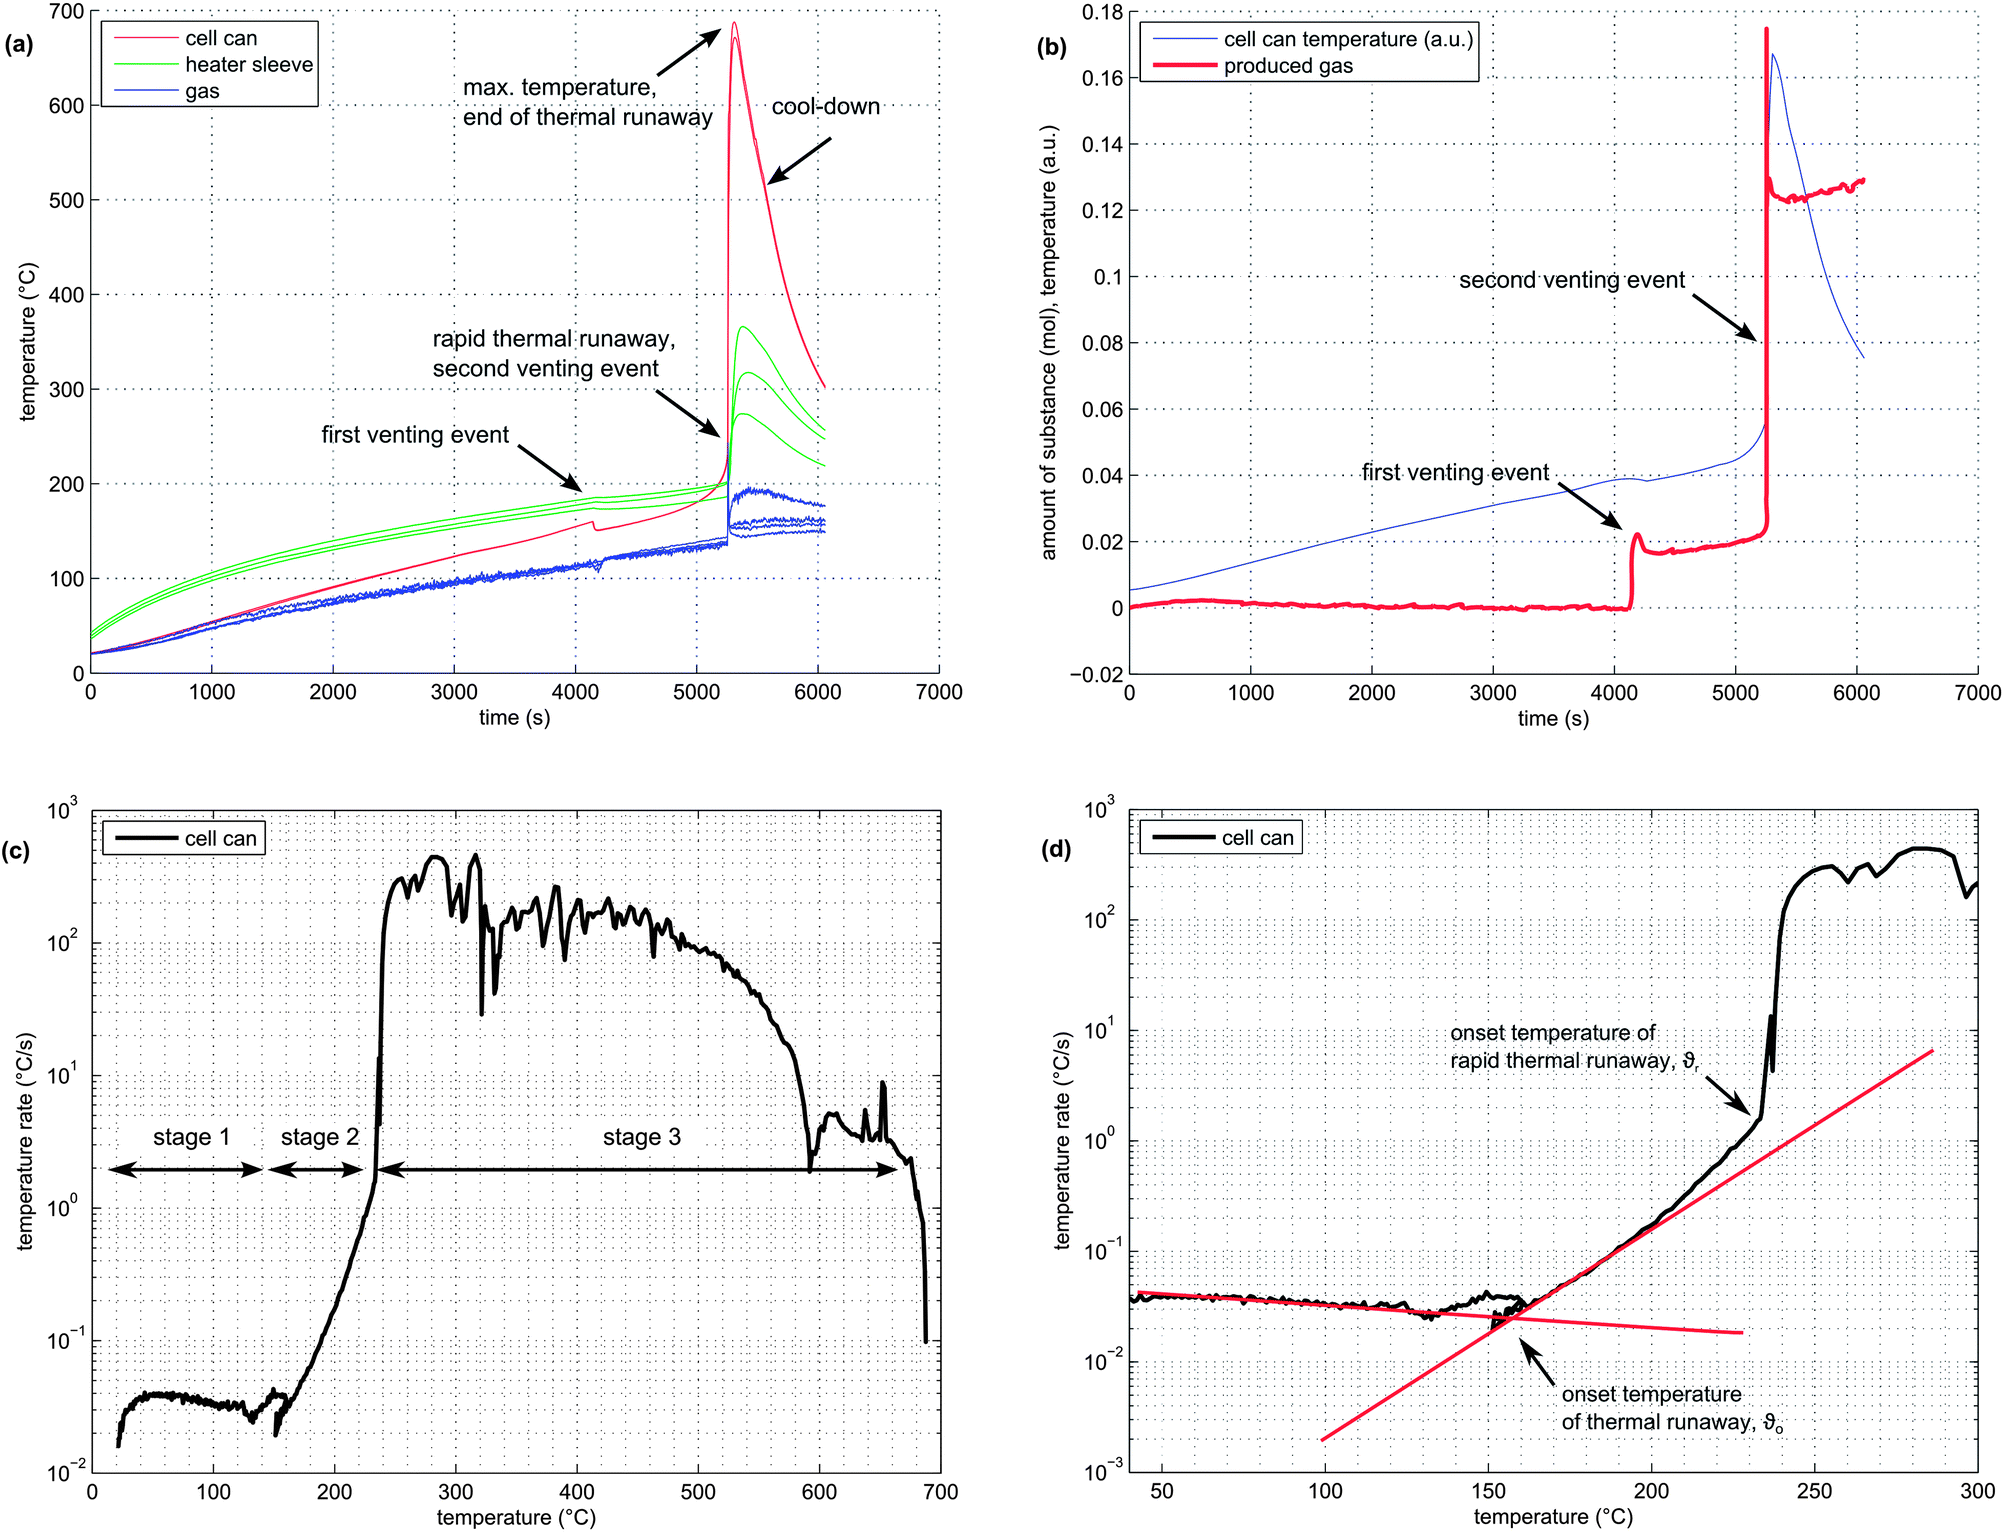 | ||
| Fig. 4 (a) Temperature versus time plot of all temperature sensors in the pressure vessel. The whole duration of the experiment is shown. (b) Amount of produced gas versus time plot. Cell temperature is shown in arbitrary units. (c) Temperature rate of the cell versus cell temperature. Overview of a whole experiment duration. (d) Temperature rate of the cell versus cell temperature. The straight lines are fitted to the heat-up stage and to the quasi-exponential stage. The intersection of the two lines marks the onset point θo of the thermal runaway reaction. A sharp increase in the temperature rate marks the onset of the rapid thermal runaway θr. | ||
The amount of gas produced inside the pressure vessel was calculated by applying the ideal gas law:
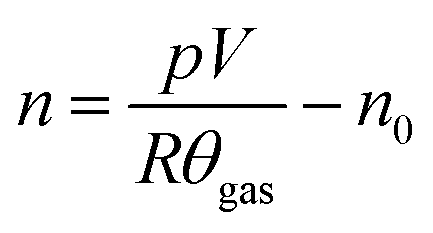 | (1) |
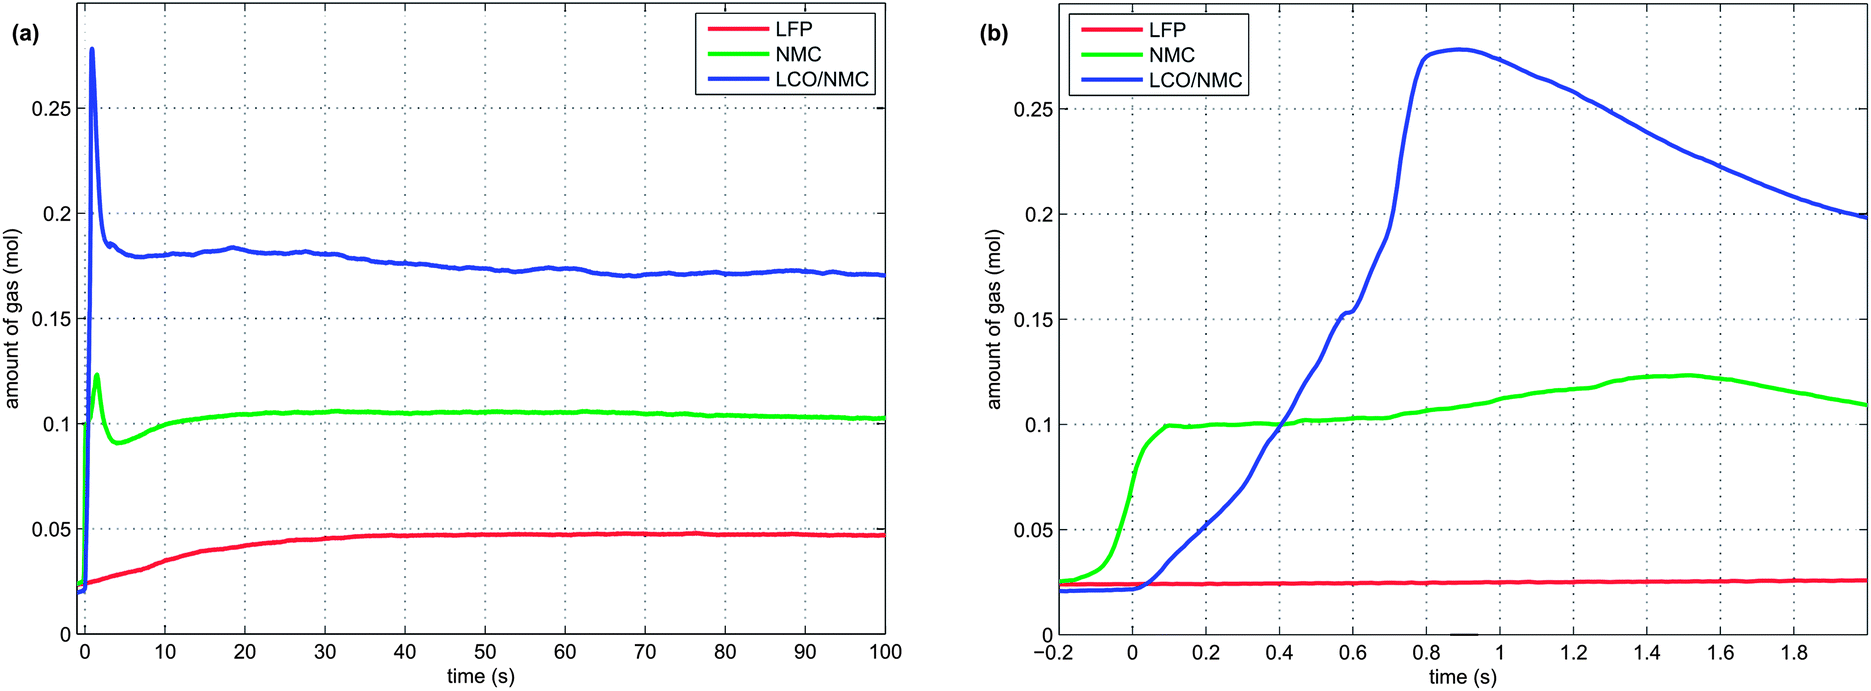
At 160 °C, the safety vent device of the battery housing opened, and 0.02 mol of gas were released by the cell. The cell cooled down by 10 °C during the release process because of the Joule–Thomson effect. The vent opening was then probably clogged until, at 230 °C, concurrent with the rapid thermal runaway, the cell vented for a second time. The second venting was the major venting: an additional 0.15 mol of vent gas were produced (Fig. 4b).
Note that the amount of gas in the reactor decreased shortly after venting. This effect can be explained by the condensation of gas at the reactor walls. Since the reactor walls had a lower temperature (∼150 °C) than the cell in full thermal runaway (up to 687 °C), the walls could act as a gas sink.
In order to visualise subtle changes in thermal behaviour of the cell during the experiment, rate diagrams are utilized. Contrary to a common temperature versus time diagram (θ vs. t), the temperature rate is plotted versus temperature (dθ/dt vs. θ) in a rate diagram. This type of diagram is often used to visualise accelerating rate calorimetry (ARC) results as well. Three distinct experiment stages can be seen in the rate diagram for the NMC cell (Fig. 4c):
(1) Heat-up stage (θ < θo): In the temperature range from room temperature to θo at ∼170 °C, the cell generated no heat. The heater sleeve was the only heat source in this phase. The negative peak at 130 °C is associated with endothermic separator melting. (It is analogous to a negative endothermic peek in a differential scanning calorimetry (DSC) diagram during the phase change of a sample). The temperature θo at which a cell starts to generate heat is commonly called the onset temperature of the thermal runaway.
(2) Quasi-exponential heating stage (θo < θ < θr): At temperatures higher than θo, the battery became a heat source. Between 170 °C and 220 °C, the temperature rate increase followed a nearly straight line in the logarithmic plot (Fig. 4d). At 220 °C, a sharp increase in temperature rate marked the end of the quasi-exponential heating stage.
(3) Rapid thermal runaway stage (θr < θ < θm): At 220 °C, θ/dt increased sharply and initiated the rapid thermal runaway. The transition to thermal runaway was accompanied by a venting event. The thermal runaway ended when all reactants had been consumed. At this point, the maximum temperature θm = 687 °C was reached.
It is difficult to pinpoint the exact transition between stage 1 and 2. Several endothermic events often occurred near the onset temperature θo: the separator melt temperature was 130 °C, the cell safety vent usually opened at 160 °C and some material was released from the cell, causing a slight cool-down due to the Joule–Thomson effect. Thus, the exact value of θo can be obscured by the intermediate cell cool-down.
To keep it simple, θo was defined as the point at which the heating-rate curve switches from constant to quasi-exponential rising. One line is fitted to the heat-up part and one line to the quasi-exponential part of the rate curve in the logarithmic rate plot. The onset temperature θo can be further defined as the temperature at which the two lines cross (Fig. 4d).
3.2 Thermal-runaway experiments
At least 3 thermal-runaway experiments were conducted with each of the three cell species. A temperature profile overview of all experiments is shown in Fig. 5a. Each species had its unique thermal-runaway characteristics. The high capacity, cobalt rich LCO/NMC cells reached the highest θm at (853 ± 24)°C during thermal runaway. The cobalt poor NMC cells had a lower θm of (678 ± 13)°C. The LFP cells showed a less pronounced thermal runaway and reached a moderate θm of (404 ± 23)°C. The temperature curves showed small variations from sample to sample. It is likely that the variations were caused by different burst times of the rupture plates, which, together with subtle effects of venting, Joule–Thomson cool-down and clogging of the vent openings, influence the thermal-runaway reaction-pathways.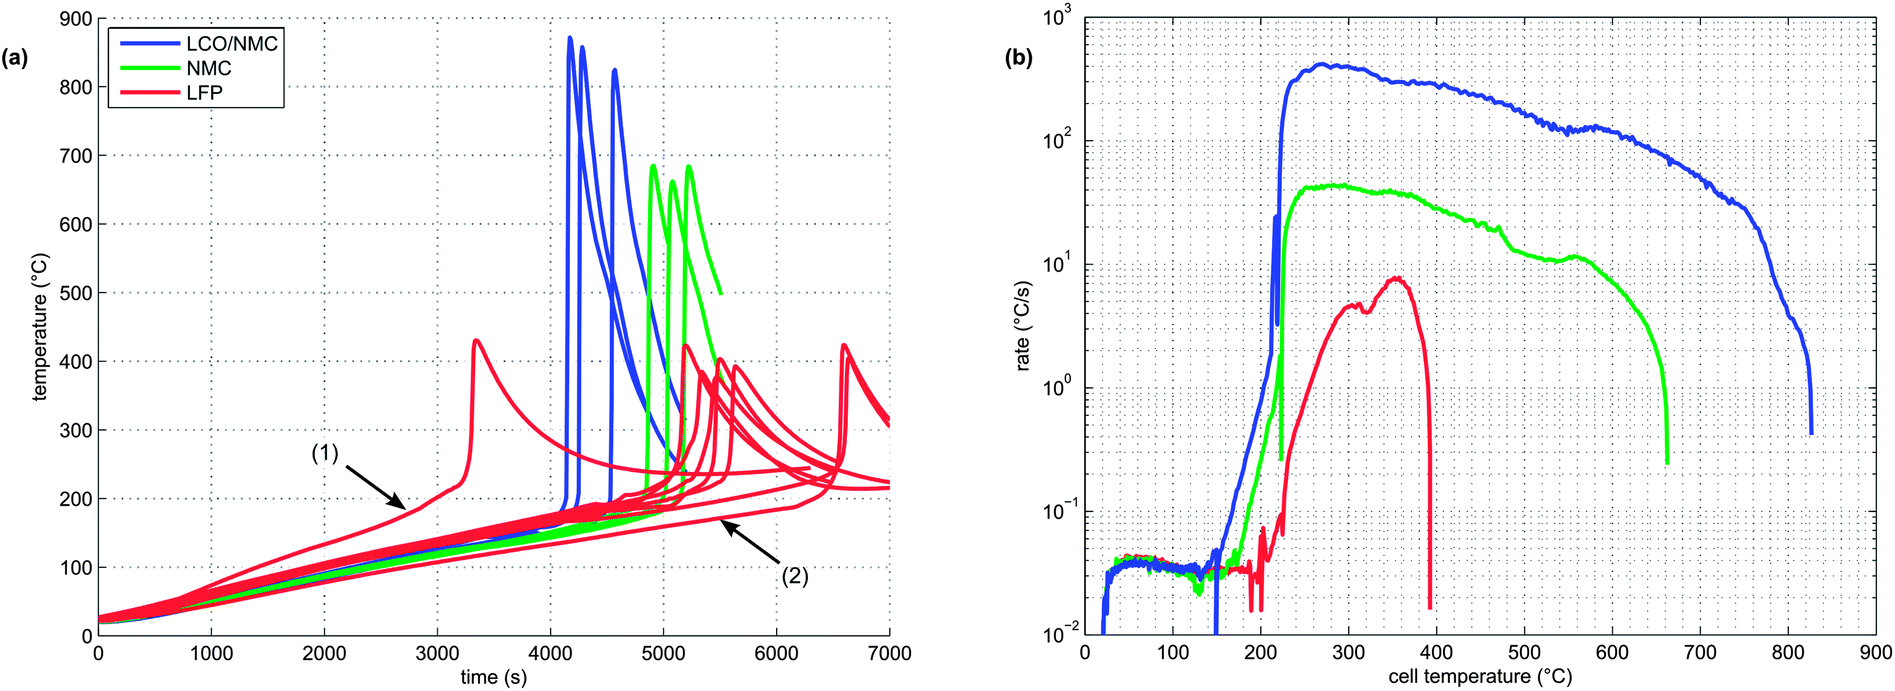 | ||
| Fig. 5 (a) Overview of the time–temperature profiles for the cells tested. Data for the whole experiment durations and for the whole experiment sets is shown. For the sake of completeness, one LFP test with a higher (1) and one with a lower (2) heating rate of the heater sleeve are included. (b) Temperature rates from three representative experiments. | ||
For the sake of completeness, two additional LFP experiments with different heater-sleeve heating-rates (1.5 and 3.5 °C min−1) were also included in the analysis (Fig. 5a). The thermal runaway characteristics of the LFP cell (θr, θm and n) did not depend on the heater-sleeve heating rate in the given heat-rate range. The two additional experiments contributed to the mean values in table 3 and Fig. 6
| LCO/NMC | NMC | LFP | ||
|---|---|---|---|---|
| θo | °C | 149 ± 2 | 168 ± 1 | 195 ± 8 |
| θr | °C | 208 ± 2 | 223 ± 3 | — |
| θm | °C | 853 ± 24 | 678 ± 13 | 404 ± 23 |
| n | mmol | 265 ± 44 | 149 ± 24 | 50 ± 4 |
| Δt | s | 0.8 | 0.2 | 30.0 |
 | ||
| Fig. 6 Detected components of the produced gases (mol%). | ||
For clarity, only one representative curve for each cell species is shown in the following graphs.
Each cell species had distinctive kinetic thermal-runaway characteristics (Table 3 and Fig. 5b). Of the three specimen, the LCO/NMC cell showed the lowest θo and θr, hence the LCO/NMC cell was the cell most vulnerable to over-heating conditions. For the NMC cell, θo and θr were shifted to higher temperatures. Transition temperatures of the LFP specimen were noticeably higher than those of both metal/oxide cells (LCO/NMC and NMC). The LFP cell was able to withstand the highest temperature before going into thermal runaway.
Both metal oxide cells showed the three stages described above (heat-up, quasi exponential heating, rapid thermal runaway). In contrast, the thermal runaway profile of the LFP cell lacked a distinct quasi-exponential stage. For the LFP cell, it was difficult to find a clear distinction between θo and θr. Therefore, θr is not given for the LFP species.
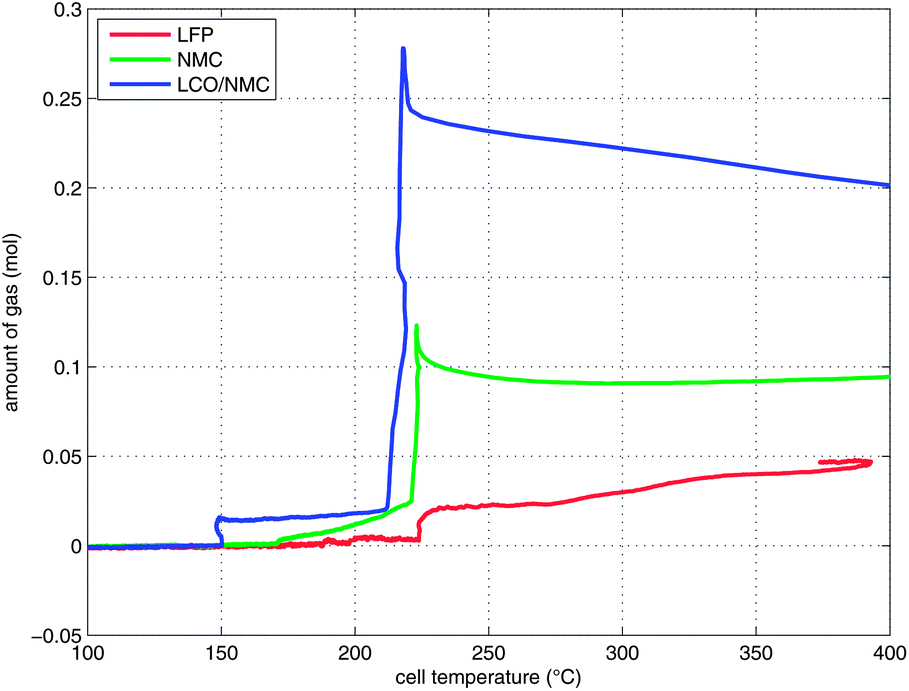
During the thermal runaway, the cells produced a significant amount of gas (Table 3). The amount of gas strongly depended on the cell type. The highest amount of gas was released by the LCO/NMC cell, followed by the NMC cell. The LFP cell yielded the least amount of gas.
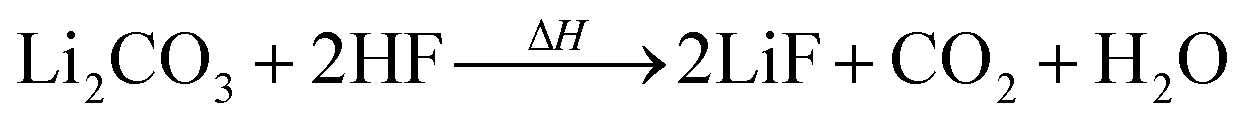
Two successive gas production events were evident in all experiments (Fig. 7):
 | ||
| Fig. 7 Temperature-vent gas profiles. Note that the x-axis is limited to the relevant temperature range. | ||
1 In the first venting event, prior to rapid thermal runaway, the burst plate of the battery opened, and ∼20 mmol were released by all three cell types.
2 In the second venting event, at the start of rapid thermal runaway, both metal-oxide cells released a high amount of additional gas at a high rate (Fig. 8). In contrast, the LFP cell released only a small amount of additional gas at a low production rate. In the case of the metal-oxide cells the gas was released in very short time. The NMC cell produced the main amount of gas in just 0.2 s, and the LCO/NMC in 0.8 s. After release, the hot gas was not in thermal equilibrium with the cooler walls of the reactor, and therefore the amount of gas decreased, as the released gas came into contact with the walls and condensed. In contrast, the gas production duration of the second venting for the LFP cell was ∼30 s. Because of the gradual release, the gases of the LFP cell were in better temperature equilibrium with the reactor walls and the gas condensation effect was not noticeable.
 | ||
| Fig. 8 Time-vent gas profiles. Note: to make the curves comparable, each curve was moved on the time axis, so that the second venting event starts at time zero. (a) The first 100 seconds and (b) the first 2 seconds of the second venting event are shown. | ||
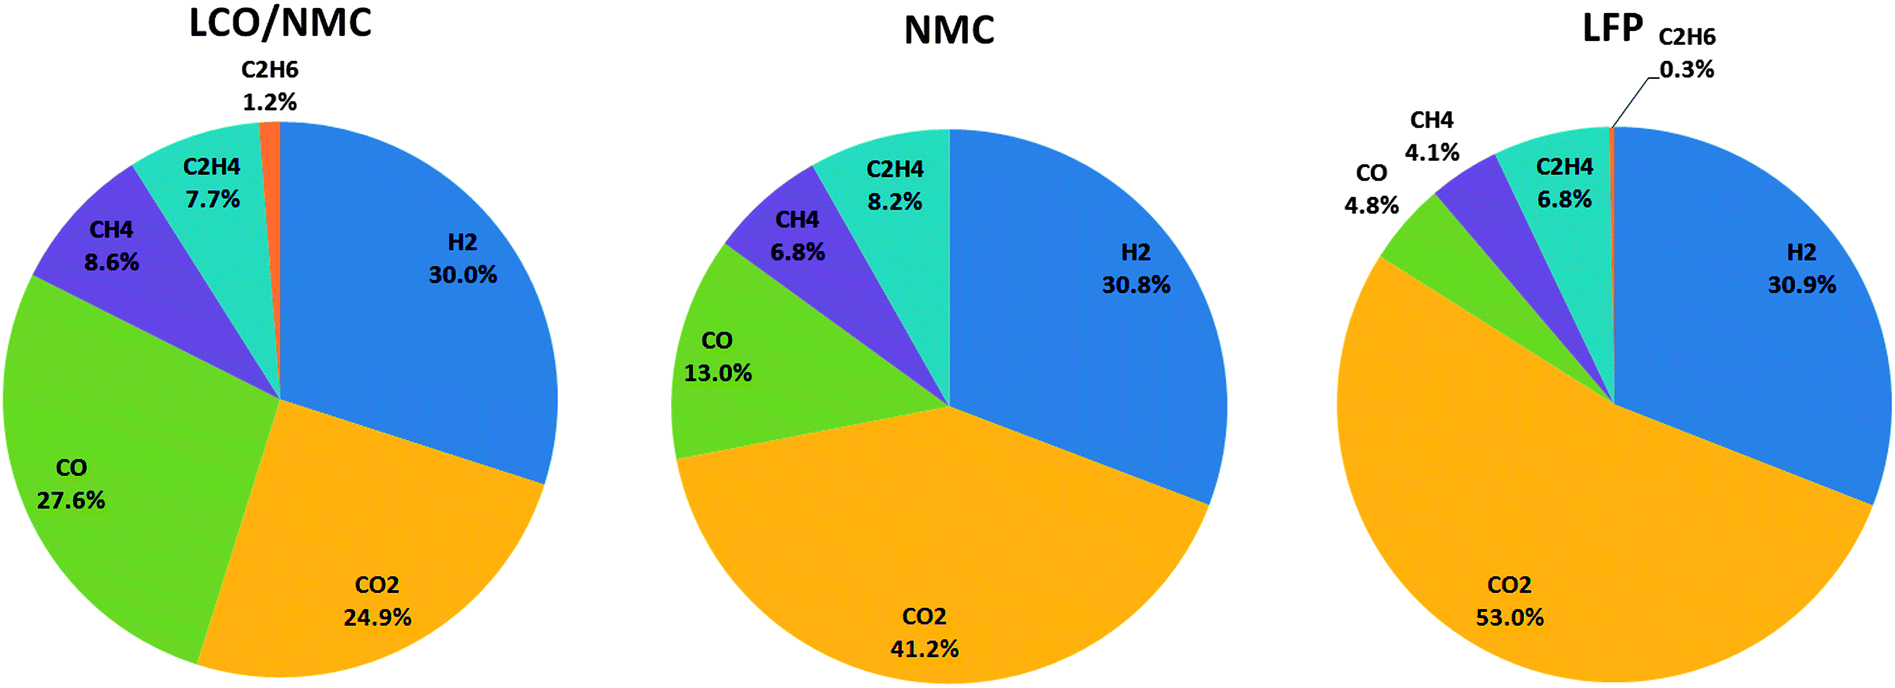
3.3 Gas analysis
At least one gas analysis was performed for each cell species. Each cell type showed a unique gas composition footprint (Fig. 6). The main components were H2 and CO2. Both metal-oxide cells produced a significant amount of CO. Additionally, smaller fractions of CH4, C2H4, and C2H6 were identified. As mentioned before, HF was not measured.Most components of the gases are flammable. The gases can be toxic due to the presence of CO.
3.4 Gas producing reactions
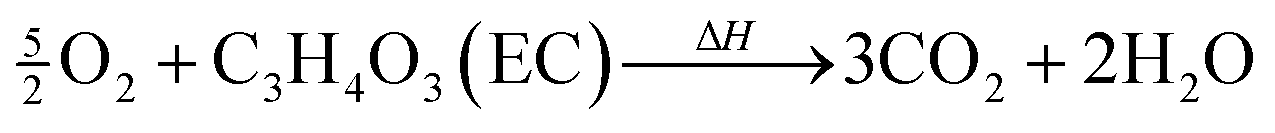
During the thermal runaway gases are released by thermally and electrochemically driven reactions of the electrode active materials, the intercalated lithium, the binder, the solid electrolyte interface (SEI), the electrolyte and the separator.
 | (2) |
A similar reaction of CMC and Li may take place above 250 °C:22
 | (3) |
 | (4) |
| ROCO2Li + HF → ROH + CO2 + LiF | (5) |
| 2ROCO2Li + H2O → 2ROH + Li2CO3 + CO2 | (6) |
Li2CO3 may be present in the cathode30 and/or can be produced by two-electron reduction of EC at the anode.31 Li2CO3 reacts with traces of HF with CO2 evolution:24,30
 | (7) |
EC solvent reduction through SEI (re)formation at the carbon surface of the anode can release CO2.32,33 Above 263 °C pure EC can thermally decompose and produce CO2.34 Linear carbonate solvents can decompose with CO2 release in the presence of CH3OLi.31
In the presence of impurities LiPF6 may react to POF3 that in turn reacts with the electrolyte in a decarboxylation reaction with CO2 release:31,35–38
| LiPF6 → LiF + PF5 | (8) |
| PF5 + ROH → HF + RF + POF3 | (9) |
| POF3 + solvent → CO2 + phosphate | (10) |
In the presence of oxygen, combustion of the carbonate based electrolyte solvents takes place,28,34,39 e.g.
 | (11) |
A plausible source of oxygen is the structural breakdown of delithiated metal oxide cathodes of the LCO/NMC and NMC cell.40 It was shown, that CO2 is mainly produced on the cathode side of an overcharged LCO cell.41 Therefore the electrolyte oxidation with O2 freed from the cathode may be the dominant CO2 producing reaction for the LCO/NMC and NMC cell. The cathode material of the LFP cell is thermally more stable and does not release oxygen.42
| 2CO2 + 2Li+ + 2e− → Li2CO3 + CO | (12) |
On the other hand, as shown in the case of an overcharged LCO cell, the main contribution of CO gas may come from the cathode side and not from the anode side.41 We suggest, that another source of CO may be incomplete combustion of carbon containing material with a limited amount of O2 that is freed from the cathode.
| C3H6O3(DMC) + 2Li+ + 2e− + H2 → Li2CO3 + 2CH4 | (13) |
| 2Li + C3H4O3(EC) → Li2CO3 + C2H4 | (14) |
| 2Li + 2C3H4O3(EC) → (CH2OCO2Li)2 + C2H4 | (15) |
| 2Li + (CH2OCO2Li)2 → 2Li2CO3 + 2C2H4 | (16) |
| 2Li + C3H6O3(DMC) → Li2CO3 + C2H6 | (17) |
4 Conclusion and outlook
Three types of consumer Li-ion batteries with the format 18650 with different cathode materials were evaluated in thermal runaway tests. The cells were brought into thermal runaway by external heating. All tests were performed in a pressure-tight reactor in an argon atmosphere. In agreement with literature,5 the cell containing LFP showed the best safety characteristics. The LFP cell had the highest onset temperature (∼195 °C), the smallest temperature increase during the thermal runaway (∼210 °C), the lowest amount of produced gas (∼50 mmol) and the lowest percentage of toxic CO in the gas (∼4%). Unfortunately, it was also the cell with the lowest working voltage (3.3 V) and the lowest energy content (3.5 W h).Batteries with higher energy content (5.7 W h and 9.9 W h) performed worse in safety tests. The onset temperature shifted down to ∼170 °C and ∼150 °C, the temperature increase during thermal runaway rose to ∼500 °C and ∼700 °C, the amount of gas released was ∼150 mmol and ∼270 mmol, and significant percentages of CO (13% and 28%) were found for the NMC and NMC/LCO cells, respectively.
All cells released high amounts of H2 and hydrocarbons. These gases are highly flammable. Even though the gas could not burn in the inert atmosphere inside the reactor, the surface of the high-energy cells reached temperatures of up to 850 °C during the experiments.
Modern devices are equipped with battery temperature and voltage monitoring. If a state beyond specification is detected, the devices shut down automatically to prevent battery abuse.18 If system shut-down can not prevent a thermal runaway in all cases, data in this work may be a valuable source for the specification of a robust energy-storage system which can withstand conceivable abuse events.
To reduce possible damage from thermal-runaway events in consumer devices, we suggest the following design optimization targets: (1) increase the temperature endurance and heat absorption capability of used materials; (2) minimize heat propagation to neighbouring burnable elements; (3) minimize gas ignition probability (e.g. mechanical separation of electric components from the gas release position).
This work has shown that the kinetics of the thermal-runaway process strongly depend on the energy content of the Li-ion battery. Future work will focus on the thermal runaway triggered by over-heating at different states of charge (SOC) and the thermal runaway caused by overcharge. Emphasis will be given to assessment of HF gas evolution, to gas analysis with GC-MS, and to the analysis of the liquid residues that are collected in the cooling trap.
Acknowledgements
The present work was conducted in the K2 project “New Component Simulation Models for HEVs” in the task “Li-Ion Battery Safety in Automotive Environment (LISAE)”. The authors would like to acknowledge the financial support of the “COMET K2 – Competence Centres for Excellent Technologies Programme” of the Austrian Federal Ministry for Transport, Innovation and Technology (BMVIT), the Austrian Federal Ministry of Economy, Family and Youth (BMWFJ), the Austrian Research Promotion Agency (FFG), the Province of Styria and the Styrian Business Promotion Agency (SFG). We would furthermore like to express our thanks to our supporting scientific project partners, namely Graz Centre for Electron Microscopy, Varta Micro Innovation GmbH and the Graz University of Technology. This work was made possible by the principal industrial project partners BASF SE and MAGNA STEYR Battery Systems GmbH & Co OG.References
- T. Nagaura and K. Tozawa, Prog. Batteries Sol. Cells, 1990, 9, 209 CAS.
- J. Wen, Y. Yu and C. Chen, Mater. Express, 2012, 2, 197–212 CrossRef CAS PubMed.
- C.-Y. Jhu, Y.-W. Wang, C.-M. Shu, J.-C. Chang and H.-C. Wu, J. Hazard. Mater., 2011, 192, 99–107 CAS.
- P. Ribière, S. Grugeon, M. Morcrette, S. Boyanov, S. Laruelle and G. Marlair, Energy Environ. Sci., 2012, 5, 5271 Search PubMed.
- D. Doughty and E. P. Roth, Electrochem. Soc. Interface, 2012, 21, 37–44 CAS.
- C.-Y. Jhu, Y.-W. Wang, C.-Y. Wen and C.-M. Shu, Appl. Energy, 2012, 100, 127–131 CrossRef CAS PubMed.
- S.-I. Tobishima and J.-I. Yamaki, J. Power Sources, 1999, 81–82, 882–886 CrossRef CAS.
- D. Belov and M.-H. Yang, Solid State Ionics, 2008, 179, 1816–1821 CrossRef CAS PubMed.
- H. Maleki, G. Deng, A. Anani and J. Howard, J. Electrochem. Soc., 1999, 146, 3224 CrossRef CAS PubMed.
- C.-Y. Jhu, Y.-W. Wang, C.-Y. Wen, C.-C. Chiang and C.-M. Shu, J. Therm. Anal. Calorim., 2011, 106, 159–163 CrossRef CAS PubMed.
- C.-Y. Wen, C.-Y. Jhu, Y.-W. Wang, C.-C. Chiang and C.-M. Shu, J. Therm. Anal. Calorim., 2012, 109, 1297–1302 CrossRef CAS.
- E. P. Roth and C. J. Orendorff, Electrochem. Soc. Interface, 2012, 21, 45–49 CAS.
- D. Abraham, E. P. Roth, R. Kostecki, K. McCarthy, S. MacLaren and D. Doughty, J. Power Sources, 2006, 161, 648–657 CrossRef CAS PubMed.
- Z. Chen, Y. Qin, Y. Ren, W. Lu, C. Orendorff, E. P. Roth and K. Amine, Energy Environ. Sci., 2011, 4, 4023 CAS.
- D. H. Doughty, E. P. Roth, C. C. Crafts, G. Nagasubramanian, G. Henriksen and K. Amine, J. Power Sources, 2005, 146, 116–120 CrossRef CAS PubMed.
- G. Nagasubramanian and C. J. Orendorff, J. Power Sources, 2011, 196, 8604–8609 CrossRef CAS PubMed.
- K.-S. Lee, S.-T. Myung, D.-W. Kim and Y.-K. Sun, J. Power Sources, 2011, 196, 6974–6977 CrossRef CAS PubMed.
- Z. J. Zhang and P. Ramadass, Encyclopedia of Sustainability Science and Technology, Springer, New York, 2012 Search PubMed.
- J.-H. Lee, U. Paik, V. a. Hackley and Y.-M. Choi, J. Electrochem. Soc., 2005, 152, A1763 CrossRef CAS PubMed.
- O. Haik, S. Ganin, G. Gershinsky, E. Zinigrad, B. Markovsky, D. Aurbach and I. Halalay, J. Electrochem. Soc., 2011, 158, A913 CrossRef CAS PubMed.
- A. D. Pasquier, J. Electrochem. Soc., 1998, 145, 472 CrossRef PubMed.
- W. Haiyan, A. Tang and W. Kelong, Chin. J. Chem., 2011, 29, 27–32 CrossRef.
- M. N. Richard and J. Dahn, J. Electrochem. Soc., 1999, 146, 2068 CrossRef CAS PubMed.
- M. Onuki, S. Kinoshita, Y. Sakata, M. Yanagidate, Y. Otake, M. Ue and M. Deguchi, J. Electrochem. Soc., 2008, 155, A794 CrossRef CAS PubMed.
- J.-S. Hong, H. Maleki, S. A. Hallaj, L. Redey and J. R. Selman, J. Electrochem. Soc., 1998, 145, 1489 CrossRef CAS PubMed.
- D. Aurbach, A. Zaban, Y. Gofer, Y. E. Ely, I. Weissman, O. Chusid and O. Abramson, J. Power Sources, 1995, 54, 76–84 CrossRef CAS.
- D. Aurbach, J. Electrochem. Soc., 1995, 142, 2882 CrossRef CAS PubMed.
- W. Kong, H. Li, X. Huang and L. Chen, J. Power Sources, 2005, 142, 285–291 CrossRef CAS PubMed.
- D. Aurbach, J. Electrochem. Soc., 1991, 138, 3529 CrossRef CAS PubMed.
- C. Doh, D. Kim, J. Lee, D. Lee, B. Jin, H. Kim, S. Moon, Y. Hwang and A. Veluchamy, Bull. Korean Chem. Soc., 2009, 30, 783 CrossRef CAS.
- G. Gachot, P. Ribière, D. Mathiron, S. Grugeon, M. Armand, J.-B. Leriche, S. Pilard and S. Laruelle, Anal. Chem., 2011, 83, 478–485 CrossRef CAS PubMed.
- C. Yang, Y. Wang and C. Wan, J. Power Sources, 1998, 72, 66–70 CrossRef CAS.
- S. Mori, H. Asahina, H. Suzuki, A. Yonei and K. Yokoto, J. Power Sources, 1997, 68, 59–64 CrossRef CAS.
- G. G. Botte and T. J. Bauer, J. Power Sources, 2003, 119–121, 815–820 CrossRef CAS.
- A. Hammami, N. Raymond and M. Armand, Nature, 2003, 424, 635–636 CrossRef CAS PubMed.
- C. L. Campion, W. Li and B. L. Lucht, J. Electrochem. Soc., 2005, 152, A2327 CrossRef CAS PubMed.
- C. L. Campion, W. Li, W. B. Euler, B. L. Lucht, B. Ravdel, J. F. DiCarlo, R. Gitzendanner and K. M. Abraham, Electrochem. Solid-State Lett., 2004, 7, A194 CrossRef CAS PubMed.
- T. Kawamura, A. Kimura, M. Egashira, S. Okada and J.-I. Yamaki, J. Power Sources, 2002, 104, 260–264 CrossRef CAS.
- R. Spotnitz and J. Franklin, J. Power Sources, 2003, 113, 81–100 CrossRef CAS.
- I. Belharouak, W. Lu, D. Vissers and K. Amine, Electrochem. Commun., 2006, 8, 329–335 CrossRef CAS PubMed.
- T. Ohsaki, T. Kishi, T. Kuboki, N. Takami, N. Shimura, Y. Sato, M. Sekino and A. Satoh, J. Power Sources, 2005, 146, 97–100 CrossRef CAS PubMed.
- A. K. Padhi, J. Electrochem. Soc., 1997, 144, 1188 CrossRef CAS PubMed.
- A. D. Pasquier, F. Disma and T. Bowmer, J. Electrochem. Soc., 1998, 145, 472 CrossRef PubMed.
- S. E. Sloop, J. B. Kerr and K. Kinoshita, J. Power Sources, 2003, 119–121, 330–337 CrossRef CAS.
- K. Kumai, J. Power Sources, 1999, 81–82, 715–719 CrossRef CAS.
- J.-S. Shin, C.-H. Han, U.-H. Jung, S.-I. Lee, H.-J. Kim and K. Kim, J. Power Sources, 2002, 109, 47–52 CrossRef CAS.
- H. Yoshida, T. Fukunaga, T. Hazama, M. Terasaki, M. Mizutani and M. Yamachi, J. Power Sources, 1997, 68, 311–315 CrossRef CAS.
- G. Gachot, S. Grugeon, G. G. Eshetu, D. Mathiron, P. Ribière, M. Armand and S. Laruelle, Electrochim. Acta, 2012, 83, 402–409 CrossRef CAS PubMed.
- D. Aurbach, A. Zaban, Y. Ein-Eli, I. Weissman, O. Chusid, B. Markovsky, M. Levi, E. Levi, A. Schechter and E. Granot, J. Power Sources, 1997, 68, 91–98 CrossRef CAS.
| This journal is © The Royal Society of Chemistry 2014 |