Self-assembly of hierarchical Fe3O4 microsphere/graphene nanosheet composite: towards a promising high-performance anode for Li-ion batteries†
Ting-qiang
Wang
,
Xiu-li
Wang
*,
Yi
Lu
,
Qin-qin
Xiong
,
Xu-yang
Zhao
,
Jian-bin
Cai
,
Sen
Huang
,
Chang-dong
Gu
and
Jiang-ping
Tu
*
State Key Laboratory of Silicon Materials, Key Laboratory of Advanced Materials and Applications for Batteries of Zhejiang Province, and Department of Materials Science and Engineering, Zhejiang University, Hangzhou 310027, China. E-mail: wangxl@zju.edu.cn; tujp@zju.edu.cn; tujplab@zju.edu.cn; Fax: +86 571 87952573; Tel: +86 571 87952856
First published on 6th November 2013
Abstract
A hierarchical Fe3O4 microsphere/graphene nanosheet (H-Fe3O4-MS/GNS) composite has been synthesized by a facile one-pot solvothermal route. The Fe3O4 microspheres uniformly decorated the surface of the two dimensional GNS. Each Fe3O4 microsphere possesses a hierarchical and porous structure, which is composed of Fe3O4 nanoparticles with a diameter of about 10 nm. As an anode material for Li-ion batteries, the H-Fe3O4-MS/GNS composite shows high specific capacity and good cycling stability (1171.6 mA h g−1 at 200 mA g−1 and 940.4 mA h g−1 at 500 mA g−1 up to 70 cycles), reduced voltage hysteresis, as well as enhanced rate capability. The improved electrochemical performance can be attributed to the combination of the conductivity, confinement and dispersion effects of GNS and the porous hierarchical structure of the Fe3O4 microsphere.
Introduction
With the increasing demand of Li-ion batteries (LIBs) for promising power sources in electric vehicles (EV) and hybrid electric vehicles (HEV), much attention has been paid to alternative anode materials with high capacity, long cycling lifetime and high safety.1–6 So far, transition metal oxides such as Co3O4,7 TiO2,8 FeOx,4,9 MnO10 have been intensively investigated as anode materials for LIBs due to their high specific capacities. Among them, Fe3O4 has received particular attention due to its high specific capacity, low cost, natural abundance and environmental friendliness. However, there still exist critical problems that limit its practical applications, such as intrinsically low electrical conductivity, large volume expansion/contraction during Li-ion insertion/extraction and large voltage hysteresis between the discharge and charge steps, consequently, result in poor cycling stability.11,12Great effort has been made to improve the electrochemical performance of Fe3O4 including construction nano-sized Fe3O4 with different morphologies or architectures,4,13,14 since it is an effective strategy to improve the cyclability due to its large surface area which would result in the sufficient contact of active material/electrolyte and the short diffusion length of Li ions. Another strategy is combining Fe3O4 with carbonaceous materials,15–25 because these carbonaceous materials not only increase the electrical conductivity but also suppress the particle aggregation, as well as the buffering effect for large volume changes. Nevertheless, achieving a long cycle life and a good rate capability still remains a large challenge for these materials.
Graphene nanosheet (GNS), a two-dimensional one-atom-thick sheet of sp2-bond carbon atoms,26 has been reported with extraordinarily high electrical conductivity, unique mechanical properties, and an ultrahigh specific surface area.27,28 Recently, graphene-based transition metal oxides have been widely fabricated for rechargeable LIBs, such as Mn3O4–GNS,29 Co3O4–GNS,30,31 Fe3O4–GNS,11,32–35 Fe2O3–GNS,36,37 SnO2–GNS,38 TiO2–GNS,39,40 NiO–GNS.41 These composite anodes have demonstrated large reversible capacities, high cycling stability and performances, attributing to the GNS which can (a) assist to accommodate volume expansion/contraction and avoid aggregation of active materials, (b) act as structural buffer during charge–discharge process, (c) improve the electrical conductivity of anode materials and (d) accelerate Li ion and electron transport by providing a shortened diffusion pathway.
Herein, we prepare a hierarchical Fe3O4 microsphere/graphene nanosheet (H-Fe3O4-MS/GNS) composite by a facile one-pot solvothermal route. In fact, hierarchical Fe3O4 sphere/graphene composites with different morphologies have perfect properties, such as high-performance microwave absorption ability,42,43 excellent water dispersibility,44 high magnetism45–47 and so on. As anode materials for LIBs, they present excellent electrochemical performance. Li et al.48 reported a three-dimensional (3D) hierarchical Fe3O4/graphene nanosheet (GNS) composite, of which the Fe3O4 nanoflowers were highly encapsulated in a GNS matrix. Jin et al.49 prepared the Fe3O4–pyrolytic graphite oxide (Fe3O4–PGO) composite of PGO sheets decorated with microsphere-type Fe3O4. Chen et al.50 reported the synthesis of a novel hollow porous Fe3O4 bead-rGO composite structure. In our synthetic approach, ethylene glycol (EG) was used as both a reducing agent and solvent. Sodium acetate was used not only for electrostatic stabilization to prevent the agglomeration of the particles but also to assist in the reduction of Fe3+ to Fe3O4. The negatively charged graphene oxide (GO) sheets could absorb positively charged Fe3+ by the electrostatic attraction in the oxygen-containing groups, which might serve as the nucleation sites.12 Even a more important is that additional sonication can help the Fe3+ to be adsorbed onto the surface of the GO powerfully. Compared with their composites, the hierarchical Fe3O4 microspheres we synthesized possess smaller secondary particles with a diameter of about 10 nm, which means that a shorter Li ion diffusion pathway. This composite shows a higher specific capacity and a better cycling stability, as well as enhanced rate capability. The excellent electrochemical performance can be attributed to a combination of GNS with hierarchical Fe3O4 microspheres.
Experimental
Synthesis of H-Fe3O4-MS/GNS composite
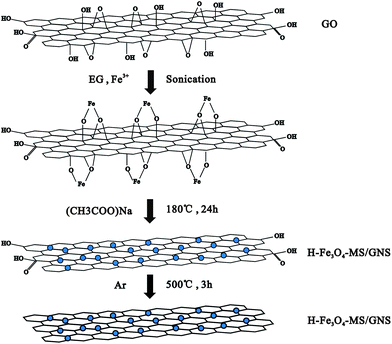
GO was prepared from natural graphite by the modified Hummers' method.51 H-Fe3O4-MS/GNS composite was fabricated by simultaneously forming Fe3O4 microspheres and reducing GO in EG. In a typical process, 50 mg of GO was added to 50 mL of EG with sonication for 3 h to form a uniform dispersion. Then, 1.5 mmol of FeCl3·6H2O were dissolved in EG (10 mL) and then added slowly to the above dispersion under stirring and then sonicate again to make the Fe3+ to be adsorbed onto the surface of the GO powerfully, followed by the dropwise addition of 10 mL of an EG solution mixed with sodium acetate (0.5 g) and stirring several hours. The mixed dispersion was then transferred to a Teflon-lined stainless steel autoclave and heated in an electric oven at 180 °C for 24 h. After cooling down to room temperature, the product was centrifuged and washed several times by alcohol and deionized water before drying at 80 °C in an oven overnight. The resulting powder was loaded into a tube furnace and heated under a argon gas atmosphere from room temperature to 500 °C at a heating rate of 10 °C min−1, maintaining at this temperature for 3 h to obtain a well-crystalline H-Fe3O4-MS/GNS composite. The formation mechanism is schematically illustrated in Fig. 1. For comparison, crystalline Fe3O4 microspheres were also obtained using the same route without addition of GO.Structural characterization
The morphology and microstructure of the products were characterized by X-ray diffraction (XRD, Rigaku D/max 2550 PC, Cu Kα), X-ray photoelectron spectroscopy (XPS, AXIS UTLTRADLD), scanning electron microscopy (SEM, Hitachi S-4700 and FESEM, FEI Sirion-100), and transmission electron microscopy (TEM, JEM 200CX at 160 kV, Tecnai G2 F30 at 300 kV). The Raman spectra were measured on a Jobin Yvon Labor Raman HR-800 using Ar-ion laser of 514.5 nm. Thermogravimetric (TG) analysis was conducted on a SDT Q600 instrument from 30 to 800 °C at a heating rate of 5 °C min−1 in air.Electrochemical measurements
The electrochemical tests were performed using a coin-type half cell (CR 2025). The working electrodes were prepared by a slurry coating procedure. The slurry consisting of 95 wt% H-Fe3O4-MS/GNS composite and 5 wt% polyvinylidene fluoride (PVDF) dissolved in N-methyl pyrrolidinone (NMP) was pasted on copper foil. After dried at 90 °C for 24 h in vacuum, the samples were pressed under a pressure of 20 MPa. Test cells were assembled in an argon-filled glove box with the metallic lithium foil as the as both the reference and counter electrodes, 1 M LiPF6 in ethylene carbonate (EC)–dimethyl carbonate (DME) (1![[thin space (1/6-em)]](https://www.rsc.org/images/entities/char_2009.gif) :
:![[thin space (1/6-em)]](https://www.rsc.org/images/entities/char_2009.gif) 1 in volume) as the electrolyte, and a polypropylene (PP) micro-porous film (Cellgard 2300) as the separator.
1 in volume) as the electrolyte, and a polypropylene (PP) micro-porous film (Cellgard 2300) as the separator.
The galvanostatic charge–discharge tests were conducted on a LAND battery program-control test system at certain current densities between 0.01 and 3.0 V at room temperature (25 ± 1 °C). Cyclic voltammetry (CV) tests were performed on the CHI660C electrochemical workstation in the potential range of 0–3.0 V (vs. Li/Li+) at a scanning rate of 0.1 mV s−1. Electrochemical impedance spectroscopy (EIS) measurements were carried out in the frequency range from 100 kHz to 0.01 Hz under AC stimulus with 5 mV of amplitude.
Results and discussion
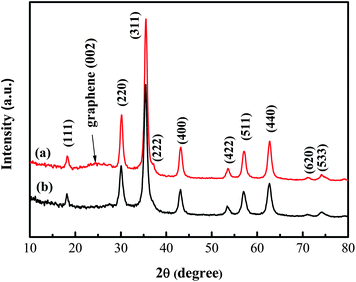
The content of GNS in H-Fe3O4-MS/GNS composite was determined based on TG analysis (see the ESI, Fig. S1†). From the TG plot, small weight loss of about 2% below 150 °C is ascribed to the evaporation of moisture in the composite. A weight increase of 0.26% is observed because of the oxygenation of Fe3O4. With increasing the temperature, the combustion of the GNS began at about 200 °C and completed at about 500 °C. It can be estimated that the weight percentage of the GNS in the composite is 23%.Fig. 2 shows typical XRD patterns of the H-Fe3O4-MS/GNS composite and bare Fe3O4. The diffraction peaks of the two powders are assigned to the pure face-centered cubic structural (Fd3m space group) magnetite Fe3O4 (JCPDS card no. 19-0629). The H-Fe3O4-MS/GNS composite shows an additional broad (002) diffraction peak at about 25°, which can be indexed into the disorderly stacked and less agglomerated GNS in the composite.52
The Raman spectra of H-Fe3O4-MS/GNS composite and GO provide the information related to the carbon structural changes during the synthesis process (Fig. S2†). Two prominent peaks at 1357 cm−1 and 1592 cm−1 are observed in GO, corresponding to the well-documented D and G bands, respectively. The D band is associated with disorder carbon, while the G band corresponds to sp2 hybridized carbon.53 A general feature of the reduction of GO is that the G band shifts to a lower wavenumber. The Raman spectrum of H-Fe3O4-MS/GNS composite also possesses both of the D and G bands, but the G band shifts to 1589 cm−1, indicating the reduction of GO. Another Raman spectrum feature of the reduction of GO is that the ratio of the two bands, D/G, increases when GO is reduced. The D/G intensity ratios are 0.89 for GO and 1.12 for H-Fe3O4-MS/GNS composite. This change in D/G intensity ratio indicates the presence of localized sp3 defects within the sp2 carbon network upon reduction of the exfoliated GO.54
The surface compositions of GO and H-Fe3O4-MS/GNS composite are further confirmed by XPS measurements. The XPS spectrum is fitted by the method of Gaussian fitting. As shown in Fig. 3a, the C 1s XPS spectrum of GO contains five components of (i) the nonoxygenated C at 284.6 eV, (ii) the carbon in C–OH at 285.7 eV, (iii) the carbon in C–O at 286.7 eV, (iv) the carbonyl carbon (C![[double bond, length as m-dash]](https://www.rsc.org/images/entities/char_e001.gif) O) at 288.0 eV and (vi) the carboxylate carbon (O
O) at 288.0 eV and (vi) the carboxylate carbon (O![[double bond, length as m-dash]](https://www.rsc.org/images/entities/char_e001.gif) C–O) at 289.1 eV. As shown in Fig. 3b, however, the C 1s XPS spectrum of H-Fe3O4-MS/GNS composite only includes three components. Furthermore, the relative contribution of the components associated with oxygenated functional groups decreases markedly, indicative of a sufficient reduction of GO. The inset of Fig. 3b gives the XPS survey spectrum of the H-Fe3O4-MS/GNS composite in the region of 0–1200 eV. The detected elements are Fe, C and O as expected for the H-Fe3O4-MS/GNS composite. The Fe 2p and O 1s XPS spectra confirm the presence of Fe3O4.
C–O) at 289.1 eV. As shown in Fig. 3b, however, the C 1s XPS spectrum of H-Fe3O4-MS/GNS composite only includes three components. Furthermore, the relative contribution of the components associated with oxygenated functional groups decreases markedly, indicative of a sufficient reduction of GO. The inset of Fig. 3b gives the XPS survey spectrum of the H-Fe3O4-MS/GNS composite in the region of 0–1200 eV. The detected elements are Fe, C and O as expected for the H-Fe3O4-MS/GNS composite. The Fe 2p and O 1s XPS spectra confirm the presence of Fe3O4.
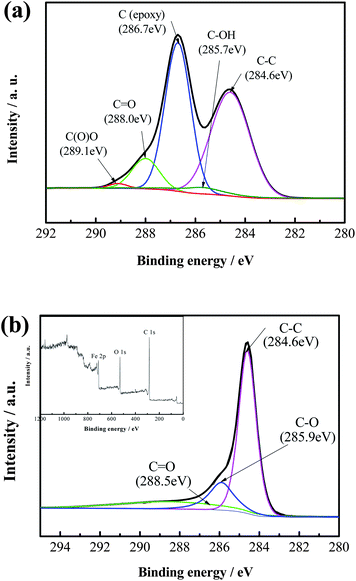 | ||
| Fig. 3 C 1s XPS spectra of (a) GO, and (b) H-Fe3O4-MS/GNS composite (XPS survey spectrum of the H-Fe3O4-MS/GNS composite presented in inset). | ||
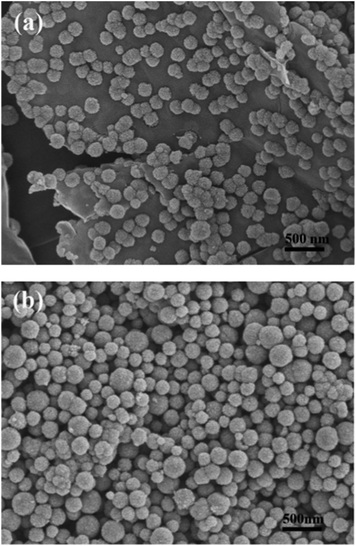
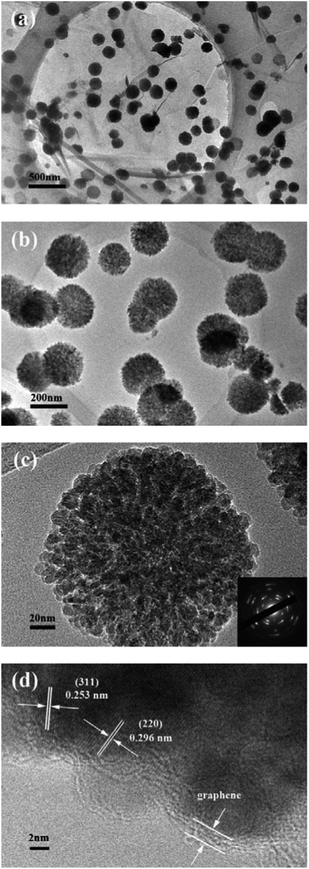
Fig. 4a clearly shows that the Fe3O4 microspheres uniformly decorated on the surface of the two-dimensional GNS. Each Fe3O4 microsphere has a diameter of about 200 nm. In contrast, the bare Fe3O4 microspheres tend to aggregate without the immobilizing effect of GNS and have a wide size distribution (Fig. 4b). TEM images of H-Fe3O4-MS/GNS composite confirm the SEM results and reveal that the Fe3O4 microspheres possess a hierarchical and porous structure. The translucent GNS is homogeneously covered by Fe3O4 microspheres (Fig. 5a and b). The GNS shows the folding nature which is clearly visible. A single Fe3O4 microsphere which sticks onto the GNS is shown in Fig. 5c, revealing that each microsphere is not a single crystal, but consists of ordered Fe3O4 nanoparticles with a diameter of about 10 nm. The selected area electron diffraction (SAED) pattern further confirms that each Fe3O4 microsphere is polycrystalline as shown in the bottom-right inset of Fig. 5c. The HRTEM image shows the typical lattice fringes of Fe3O4 particle in the GNS matrix (Fig. 5d). The lattice spacing of 0.296 nm and 0.253 nm correspond to the (220) and (311) planes of the Fe3O4 phase. These values are in good agreement with the standard data of Fe3O4 (JCPDS card no. 19-0629).
As reported previously, after a process of nucleation and oriented aggregation, hierarchical and porous Fe3O4 microspheres consisting of large numbers of Fe3O4 nanoparticles were formed under the solvothermal process.55,56 In simple terms, the negatively charged GO sheets could absorb positively charged Fe3+ by the electrostatic attraction in the oxygen-containing groups, which served as the nucleation sites, so the primary magnetite nanocrystals first formed. Afterward, the newly formed nanocrystals aggregated into round spheres, driven by minimization of total surface energy. It is noted that the Fe3O4 microspheres are strongly anchored on GNS even after sonication for a long time during the preparation of the TEM specimen, accounting for the strong interaction between the Fe3O4 microspheres and GNS. Furthermore, it is believed that such interaction can improve the electrochemical performance, since the GNS can prevent the agglomeration of nanoparticles during charge–discharge process. In addition, the strong anchor of Fe3O4 nanoparticles on conductive GNS enables to accelerate Li ion and electron transport by providing a shortened diffusion pathway. Similarly, the nanoparticles anchored on the GNS can effectively prevent the restacking of GNS.57
In view of the potential application as an anode material for LIBs, we investigated its ability of the H-Fe3O4-MS/GNS composite to reversibly react with Li ions. Fig. 6 presents the CV curves of H-Fe3O4-MS/GNS composite and bare Fe3O4 for the first three cycles in the potential range of 0–3.0 V (vs. Li/Li+) at a scan rate of 0.1 mV s−1. As shown in Fig. 6a, a sharp reduction peak at about 0.6 V is observed in the first cathodic scan for the H-Fe3O4-MS/GNS composite, which can be attributed to the reduction of Fe3+ or Fe2+ to Fe0 and the irreversible reaction with the electrolyte.18 In addition, two weak reduction peaks at about 0.8 V and 1.54 V are observed for the composite, which may be ascribed to be the formation of LixFe3O4.58 In this step, the conversion of Fe3O4 to Fe and the formation of amorphous Li2O are the main reason of the irreversible capacity during the first discharge process. Meanwhile, two anodic peaks at about 1.63 and 1.81 V correspond to the reversible oxidation of Fe0 to Fe2+/Fe3+.59 From the second cycle, both cathodic and anodic peaks are positively shifted in the subsequent cycles due to the structural modification after the first cycle. It is noted that the current density and the integrated area of the H-Fe3O4-MS/GNS composite are larger than those of the bare Fe3O4, and the peak at 1.81 V for the second or third cycle of the H-Fe3O4-MS/GNS composite which can be indexed to the reversible reaction to Fe3O4, are more obvious and intensive than those of the bare Fe3O4. Furthermore, there is no noticeable change of peak intensity and integrated areas for both cathodic and anodic peaks of the H-Fe3O4-MS/GNS composite after the first cycle compared with the bare Fe3O4, suggesting that the electrochemical reversibility of Fe3O4-graphene gradually establishes after the initial cycle and is much better than that for the bare Fe3O4. These all can be attributed to the fast Li ion and electron transport of strong covalent coupling interaction between the Fe3O4 microspheres and GNS. Furthermore, the porous structure of Fe3O4 microspheres can facilitate the infiltration of electrolyte which can also speed up the Li ion transport.
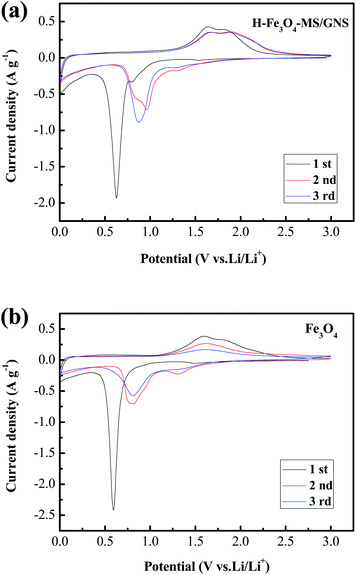 | ||
| Fig. 6 CV curves of (a) H-Fe3O4-MS/GNS composite, (b) bare Fe3O4 for the first three cycles at a scan rate of 0.1 mV s−1 in the potential range of 0–3.0 V (vs. Li/Li+). | ||
Fig. 7 shows the first two galvanostatic charge–discharge curves of the H-Fe3O4-MS/GNS composite and bare Fe3O4 microsphere electrodes between 0.01 and 3.0 V at a current density of 200 mA g−1. In the first discharge step, both curves present a long voltage plateau at about 0.75 V, followed by a sloping curve down to the cut voltage of 0.01 V, which are typical characteristics of voltage trends for the Fe3O4 electrode.59,60 The second discharge curves of the H-Fe3O4-MS/GNS composite and bare Fe3O4 are both different from the first, suggesting the drastic, Li+-driven, structural or textural modifications.61 The first specific discharge capacity of H-Fe3O4-MS/GNS composite and bare Fe3O4 are 1336.4 and 1246.2 mA h g−1, respectively. The extra capacity of the electrodes compared with the theoretic capacity resulted from the formation of solid electrolyte interface (SEI) film and possibly interfacial Li+ storage during the first discharge process.62 The polarization (i.e., voltage hysteresis between charge and discharge) could be due to the limited Li diffusion kinetics during the intercalation/deintercalation process.63 As shown in Fig. 7, the H-Fe3O4-MS/GNS composite shows small voltage differences between the charge and discharge plateaus, indicating that the characteristics of strong covalent coupling possesses low electrochemical polarization and thereby induces good reversibility in the discharge–charge processes. Fig. 8 further presents the voltage hysteresis curve of the H-Fe3O4-MS/GNS composite and bare Fe3O4 electrodes at a current density of 200 mA g−1. It is obtained by subtracting the discharge curve at the second cycle from the charge curve at the first cycle after normalization. For the capacity normalization used here, 0 refers to the full delithiation state charged to 3.0 V and 1.0 means the starting of charging.3 As shown in Fig. 8, the voltage polarization of bare Fe3O4 electrode is about 0.5–1.25 V in all lithiation/delithiation ranges, while the H-Fe3O4-MS/GNS composite exhibits an obvious reduction of voltage polarization to 0.3–1.1 V. It is considered that the decrease in voltage hysteresis for the H-Fe3O4-MS/GNS composite is attributed to the high electrical conductivity of GNS and the porous hierarchical structure of Fe3O4 microspheres, which accelerates the Li ion and electron transportation in the electrode.
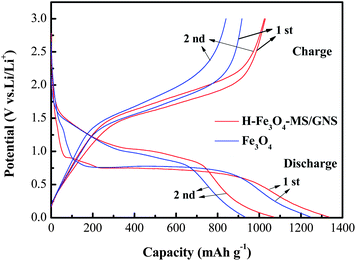 | ||
| Fig. 7 Charge–discharge profiles of H-Fe3O4-MS/GNS composite and bare Fe3O4 electrodes between 0.01 and 3.0 V at a current density of 200 mA g−1. | ||
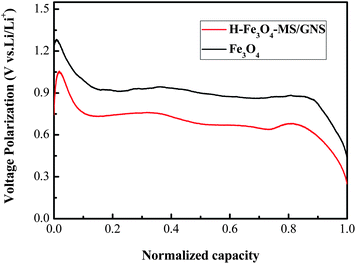 | ||
| Fig. 8 Comparison of voltage hysteresis curves of the H-Fe3O4-MS/GNS composite and bare Fe3O4 electrode at a current density of 200 mA g−1. | ||
Fig. 9a and b give the cycling performance of H-Fe3O4-MS/GNS composite and bare Fe3O4 at current densities of 200 and 500 mA g−1, respectively. Obviously, the H-Fe3O4-MS/GNS composite exhibits a better cycling stability than the bare Fe3O4. The specific reversible capacities of the H-Fe3O4-MS/GNS composite after 70 cycles are 1171.6 mA h g−1 at 200 mA g−1 and 940.4 mA h g−1 at 500 mA g−1, much higher than those of the bare Fe3O4 (169 mA h g−1 at 200 mA g−1 and 68.7 mA h g−1 at 500 mA g−1). In addition, the reversible capacity of H-Fe3O4-MS/GNS composite increases gradually with the increase of cycle number at 200 mA g−1, which can be observed in previous reports, such as graphene-wrapped Fe3O4 nanocomposite,57,64 while the bare Fe3O4 presents a fast capacity fade, only can sustain 18.1% of the initial capacity. At the current density of 500 mA g−1, the H-Fe3O4-MS/GNS composite still possesses an exceedingly high capacity retention of 96.4%, much higher than the bare Fe3O4 of 9.3%. The main reason for rapid capacity decay of the bare Fe3O4 electrode is believed that a large volume change and aggregation of particles occur during charge–discharge cycling. However, for the H-Fe3O4-MS/GNS composite electrode, the Fe3O4 microspheres are homogeneously decorated in the GNS. Such a dimensional confinement for the Fe3O4 microspheres by the surrounding GNS limits the volume expansion effect upon Li insertion. In addition, the GNS also provides a highly conductive network for electron transfer during the lithiation/delithiation process.
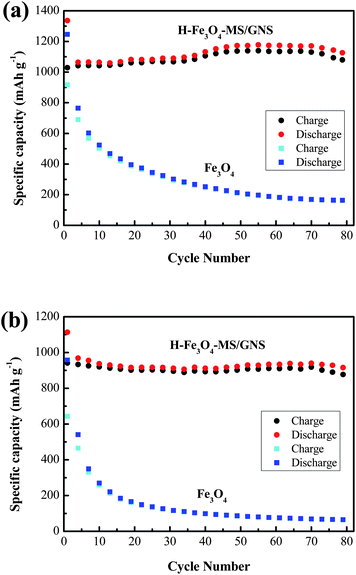 | ||
| Fig. 9 Cycling performance of H-Fe3O4-MS/GNS composite and bare Fe3O4 at current densities: (a) 200 and (b) 500 mA g−1. | ||
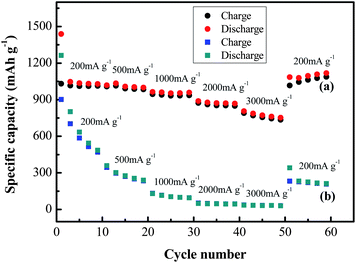
The H-Fe3O4-MS/GNS composite also shows significantly enhanced rate performance compared with the bare Fe3O4, as shown in Fig. 10. With increasing the current density from 200 to 3000 mA g−1, the discharge capacities of the two materials decrease, indicating the diffusion-controlled kinetics process for the electrode reaction.65 But it can clearly observed that the discharge capacities of bare Fe3O4 electrode decrease drastically, the reversible capacity rapidly drops from 906.4 to 465.8 mA h g−1 only in the first 10 cycles. The reversible discharge capacities of the H-Fe3O4-MS/GNS composite at 200, 500, 1000, 2000 and 3000 mA g−1 are 1015, 992, 935, 852 and 745 mA h g−1, respectively, greatly higher than those of the bare Fe3O4. When the current density is lowered down to 200 mA g−1, the discharge capacity of the composite swiftly recovers to 1016 mA h g−1 after 60 cycles, which demonstrates the excellent reversibility. To the best of our knowledge, the H-Fe3O4-MS/GNS composite synthesized in this method shows a superior rate retention. The improved cycling performance and rate capability are attributed to the high electrochemical activity and structure stability of the composite electrode.
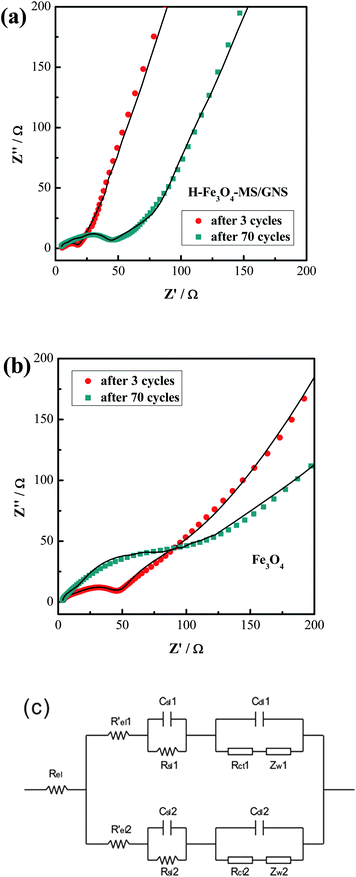
The EIS measurements are conducted to verify that the GNS is responsible for the improved electrochemical performance of the H-Fe3O4-MS/GNS composite. Fig. 11a and b show the Nyquist plots of H-Fe3O4-MS/GNS composite and bare Fe3O4 after 3 and 70 cycles at a current density of 200 mA g−1 measured at about 2.0 V. The shapes of the Nyquist plots of both electrodes are quite similar. The symbols are the experimental data whereas the continuous lines represent the fitted spectra. The Nyquist plots consist of a depressed semicircle where a high-frequency semicircle and a medium-frequency semicircle overlap each other and a long low-frequency line. The inclined line in the low-frequency region represents the Warburg impedance (Zw), which is related to solid-state diffusion of Li+ in the electrode materials. The semicircle in the high frequency is assigned to the resistance (Rsl) of Li+ diffusion in the surface layer (SEI film). The semicircle in the middle frequency range indicates the charge-transfer resistance (Rct), relating to charge transfer through the electrode/electrolyte interface. The intercept on the Z real axis in the high frequency region corresponds to the solution resistance (Rel).65 In order to further understand the Nyquist plots and get well comparing of the plots obtained before and after the addition of GNS, a modified two-parallel diffusion path model is selected, and the corresponding equivalent circuit is presented in Fig. 11c, where Rel indicates the solution resistance; Rsl(i) and Csl(i) stand for the resistance of migration and capacity of the surface-passivating layer, respectively; Rct(i) and Cdl(i) designate the Li+ charge-transfer resistance and double-layer capacitance at the interface between electrolyte and electrode, respectively; and ZW(i) represents the diffusion-controlled Warburg impedance (i = 1, 2).20,65 The value of Rct for H-Fe3O4-MS/GNS composite electrode through calculation increases from 3.21 Ω to 26.04 Ω after 70 cycles, whereas the one of the bare Fe3O4 increases strikingly, from 24.75 Ω to 175.28 Ω. But the values of Rsl for H-Fe3O4-MS/GNS composite and bare Fe3O4 electrodes all have no evident change after 70 cycles. Therefore, it is suggested that the charge-transfer resistance of the H-Fe3O4-MS/GNS composite is suppressed by the addition of GNS, which indicates that the electrons and Li ions can transfer more effectively between the interface of active materials and electrolyte, thus resulting in the enhanced electrode reaction kinetics during the charge–discharge process.
Conclusions
In summary, we report a facile one-pot solvothermal route for preparation of a hierarchical Fe3O4 microsphere/graphene nanosheet (H-Fe3O4-MS/GNS) composite. The H-Fe3O4-MS/GNS composite exhibits a high specific capacity and a good cycling stability, reduced voltage hysteresis and enhanced rate capability. The improved electrochemical performance not only attributed to the GNS, which can accommodate volume expansion/contraction, avoid aggregation of Fe3O4 particles and improve the electrical conductivity of electrode, but also to the porous and hierarchical structure of Fe3O4 microspheres, which can facilitate Li ion transportation and accommodate volume expansion/contraction to some extent. The superior electrochemical properties of the H-Fe3O4-MS/GNS composite make it a promising anode material for advanced LIBs.Acknowledgements
This work was supported by the Key Science and Technology Innovation Team of Zhejiang Province (2010R50013). The authors also thank the help of Dr Li'na Wang (Zhejiang Sci-Tech University).References
- J. M. Tarascon and M. Armand, Nature, 2001, 414, 359–367 CrossRef CAS PubMed.
- A. S. Aricò, P. Bruce, B. Scrosati, J. M. Tarascon and W. Van Schalkwijk, Nat. Mater., 2005, 4, 366–377 CrossRef PubMed.
- Q. Q. Xiong, J. P. Tu, X. H. Xia, X. Y. Zhao, C. D. Gu and X. L. Wang, Nanoscale, 2013, 5, 7906–7912 RSC.
- Y. C. Dong, R. G. Ma, M. J. Hu, H. Cheng, Q. D. Yang, Y. Y. Li and J. A. Zapien, Phys. Chem. Chem. Phys., 2013, 15, 7174–7181 RSC.
- Y. Lu, J. P. Tu, Q. Q. Xiong, H. Zhang, C. D. Gu, X. L. Wang and S. X. Mao, CrystEngComm, 2012, 14, 8633–8641 RSC.
- J. X. Zhao, Y. L. Cheng, X. B. Yan, D. F. Sun, F. L. Zhu and Q. J. Xue, CrystEngComm, 2012, 14, 5879–5885 RSC.
- Q. Q. Xiong, X. H. Xia, J. P. Tu, J. Chen, Y. Q. Zhang, D. Zhou, C. D. Gu and X. L. Wang, J. Power Sources, 2013, 240, 344–350 CrossRef CAS PubMed.
- J. Y. Shen, H. Wang, Y. Zhou, N. Q. Ye and L. J. Wang, CrystEngComm, 2012, 14, 6215–6220 RSC.
- Q. Q. Xiong, Y. Lu, X. L. Wang, C. D. Gu, Y. Q. Qiao and J. P. Tu, J. Alloys Compd., 2012, 536, 219–225 CrossRef CAS PubMed.
- Y. J. Mai, D. Zhang, Y. Q. Qiao, C. D. Gu, X. L. Wang and J. P. Tu, J. Power Sources, 2012, 216, 201–207 CrossRef CAS PubMed.
- Y. C. Dong, R. G. Ma, M. J. Hu, H. Cheng, C. K. Tsang, Q. D. Yang, Y. Y. Li and J. A. Zapien, J. Solid State Chem., 2013, 201, 330–337 CrossRef CAS PubMed.
- S. Y. Liu, J. Xie, C. C. Fang, G. S. Cao, T. J. Zhu and X. B. Zhao, J. Mater. Chem., 2012, 22, 19738–19743 RSC.
- S. K. Behera, J. Power Sources, 2011, 196, 8669–8674 CrossRef CAS PubMed.
- Y. Chen, H. Xia, L. Lu and J. M. Xue, J. Mater. Chem., 2012, 22, 5006–5012 RSC.
- E. Kang, Y. S. Jung, A. S. Cavanagh, G. H. Kim, S. M. George, A. C. Dillon, J. K. Kim and J. Lee, Adv. Funct. Mater., 2011, 21, 2430–2438 CrossRef CAS.
- C. M. Ban, Z. C. Wu, D. T. Gillaspie, L. Chen, Y. F. Yan, J. L. Blackburn and A. C. Dillon, Adv. Mater., 2010, 22, E145–E149 CrossRef CAS PubMed.
- H. Liu, G. X. Wang, J. Z. Wang and D. Wexler, Electrochem. Commun., 2008, 10, 1879–1882 CrossRef CAS PubMed.
- Q. Q. Xiong, J. P. Tu, Y. Lu, J. Chen, Y. X. Yu, Y. Q. Qiao, X. L. Wang and C. D. Gu, J. Phys. Chem. C, 2012, 116, 6495–6502 CAS.
- Y. J. Chen, G. Xiao, T. S. Wang, Q. Y. Ouyang, L. H. Qi, Y. Ma, P. Gao, C. L. Zhu, M. S. Cao and H. B. Jin, J. Phys. Chem. C, 2011, 115, 13603–13608 CAS.
- Q. Q. Xiong, J. P. Tu, Y. Lu, J. Chen, Y. X. Yu, X. L. Wang and C. D. Gu, J. Mater. Chem., 2012, 22, 18639–18645 RSC.
- S. H. Ren, R. Prakash, D. Wang, V. S. K. Chakravadhanula and M. Fichtner, ChemSusChem, 2012, 5, 1397–1400 CrossRef CAS PubMed.
- S. L. Jin, H. G. Deng, D. H. Long, X. J. Liu, L. A. Zhan, X. Y. Liang, W. M. Qiao and L. C. Ling, J. Power Sources, 2011, 196, 3887–3893 CrossRef CAS PubMed.
- S. Hariharan, K. Saravanan, V. Ramar and P. Balaya, Phys. Chem. Chem. Phys., 2013, 15, 2945–2953 RSC.
- L. W. Ji, Z. K. Tan, T. R. Kuykendall, S. Aloni, S. D. Xun, E. Lin, V. Battaglia and Y. G. Zhang, Phys. Chem. Chem. Phys., 2011, 13, 7139–7146 RSC.
- J. Liu, Y. C. Zhou, F. Liu, C. P. Liu, J. B. Wang, Y. Pan and D. F. Xue, RSC Adv., 2012, 2, 2262–2265 RSC.
- K. S. Novoselov, A. K. Geim, S. V. Morozov, D. Jiang, Y. Zhang, S. V. Dubonos, I. V. Grigorieva and A. A. Firsov, Science, 2004, 306, 666–669 CrossRef CAS PubMed.
- A. A. Balandin, S. Ghosh, W. Z. Bao, I. Calizo, D. Teweldebrhan, F. Miao and C. N. Lau, Nano Lett., 2008, 8, 902–907 CrossRef CAS PubMed.
- E. Yoo, J. Kim, E. Hosono, H. Zhou, T. Kudo and I. Honma, Nano Lett., 2008, 8, 2277–2282 CrossRef CAS PubMed.
- H. L. Wang, L. F. Cui, Y. A. Yang, H. S. Casalongue, J. T. Robinson, Y. Y. Liang, Y. Cui and H. J. Dai, J. Am. Chem. Soc., 2010, 132, 13978–13980 CrossRef CAS PubMed.
- H. Wu, M. Xu, Y. C. Wang and G. F. Zheng, Nano Res., 2013, 6, 167–173 CrossRef CAS.
- A. K. Rai, J. Gim, L. T. Anh and J. Kim, Electrochim. Acta, 2013, 100, 63–71 CrossRef CAS PubMed.
- C. D. Wang, Q. M. Zhang, Q. H. Wu, T. W. Ng, T. L. Wong, J. G. Ren, Z. C. Shi, C. S. Lee, S. T. Lee and W. J. Zhang, RSC Adv., 2012, 2, 10680–10688 RSC.
- M. Sathish, T. Tomai and I. Honma, J. Power Sources, 2012, 217, 85–91 CrossRef CAS PubMed.
- S. Baek, S. H. Yu, S. K. Park, A. Pucci, C. Marichy, D. C. Lee, Y. E. Sung, Y. Piao and N. Pinna, RSC Adv., 2011, 1, 1687–1690 RSC.
- M. Zhang and M. Q. Jia, J. Alloys Compd., 2013, 551, 53–60 CrossRef CAS PubMed.
- L. L. Tian, Q. C. Zhuang, J. Li, C. Wu, Y. L. Shi and S. G. Sun, Electrochim. Acta, 2012, 65, 153–158 CrossRef CAS PubMed.
- D. Z. Chen, W. Wei, R. N. Wang, J. C. Zhu and L. Guo, New J. Chem., 2012, 36, 1589–1595 RSC.
- S. M. Paek, E. Yoo and I. Honma, Nano Lett., 2009, 9, 72–75 CrossRef CAS PubMed.
- Y. Y. Liang, H. L. Wang, H. S. Casalongue, Z. Chen and H. J. Dai, Nano Res., 2010, 3, 701–705 CrossRef CAS PubMed.
- S. J. Ding, J. S. Chen, D. Y. Luan, F. Y. C. Boey, S. Madhavi and X. W. Lou, Chem. Commun., 2011, 47, 5780–5782 RSC.
- H. Liu, G. X. Wang, J. Liu, S. Z. Qiao and H. J. Ahn, J. Mater. Chem., 2011, 21, 3046–3052 RSC.
- C. G. Hu, Z. Y. Mou, G. W. Lu, N. Chen, Z. L. Dong, M. J. Hu and L. T. Qu, Phys. Chem. Chem. Phys., 2013, 15, 13038–13043 RSC.
- H. L. Xu, H. Bi and R. B. Yang, J. Appl. Phys., 2012, 111, 07A522 CrossRef.
- W. Fan, W. Gao, C. Zhang, W. W. Tjiu, J. S. Pan and T. X. Liu, J. Mater. Chem., 2012, 22, 25108–25115 RSC.
- X. H. Li, H. B. Yi, J. W. Zhang, J. Feng, F. S. Li, D. S. Xue, H. L. Zhang, Y. Peng and N. J. Mellors, J. Nanopart. Res., 2013, 15, 1–11 CAS.
- K. F. Zhou, Y. H. Zhu, X. L. Yang and C. Z. Li, New J. Chem., 2010, 34, 2950–2955 RSC.
- L. L. Ren, S. Huang, W. Fan and T. X. Liu, Appl. Surf. Sci., 2011, 258, 1132–1138 CrossRef CAS PubMed.
- X. Y. Li, X. L. Huang, D. P. Liu, X. Wang, S. Y. Song, L. Zhou and H. J. Zhang, J. Phys. Chem. C, 2011, 115, 21567–21573 CAS.
- B. Jin, A. H. Liu, G. Y. Liu, Z. Z. Yang, X. B. Zhong, X. Z. Ma, M. Yang and H. Y. Wang, Electrochim. Acta, 2013, 90, 426–432 CrossRef CAS PubMed.
- Y. Chen, B. H. Song, X. S. Tang, L. Lu and J. M. Xue, J. Mater. Chem., 2012, 22, 17656–17662 RSC.
- D. C. Marcano, D. V. Kosynkin, J. M. Berlin, A. Sinitskii, Z. Sun, A. Slesarev, L. B. Alemany, W. Lu and J. M. Tour, ACS Nano, 2010, 4, 4806–4814 CrossRef CAS PubMed.
- G. X. Wang, J. Yang, J. Park, X. L. Gou, B. Wang, H. Liu and J. Yao, J. Phys. Chem. C, 2008, 112, 8192–8195 CAS.
- X. D. Huang, X. F. Zhou, K. Qian, D. Y. Zhao, Z. P. Liu and C. Z. Yu, J. Alloys Compd., 2012, 514, 76–80 CrossRef CAS PubMed.
- F. Tuinstra and J. L. Koenig, J. Chem. Phys., 1970, 53, 1126–1130 CrossRef CAS.
- X. L. Hu and J. C. Yu, Adv. Funct. Mater., 2008, 18, 880–887 CrossRef CAS.
- Y. Chen, H. Xia, L. Lu and J. M. Xue, J. Mater. Chem., 2012, 22, 5006–5012 RSC.
- G. M. Zhou, D. W. Wang, F. Li, L. L. Zhang, N. Li, Z. S. Wu, L. Wen, G. Q. Lu and H. M. Cheng, Chem. Mater., 2010, 22, 5306–5313 CrossRef CAS.
- J. Z. Wang, C. Zhong, D. Wexler, N. H. Idris, Z. X. Wang, L. Q. Chen and H. K. Liu, Chem.–Eur. J., 2011, 17, 661–667 CrossRef CAS PubMed.
- Y. He, L. Huang, J. S. Cai, X. M. Zheng and S. G. Sun, Electrochim. Acta, 2010, 55, 1140–1144 CrossRef CAS PubMed.
- P. Poizot, S. Laruelle, S. Grugeon, L. Dupont and J. M. Tarascon, Nature, 2000, 407, 496–499 CrossRef CAS PubMed.
- S. Mitra, P. Poizot, A. Finke and J. M. Tarascon, Adv. Funct. Mater., 2006, 16, 2281–2287 CrossRef CAS.
- J. S. Zhou, H. H. Song, L. L. Ma and X. H. Chen, RSC Adv., 2011, 1, 782–791 RSC.
- A. Debart, L. Dupont, P. Poizot, J. B. Leriche and J. M. Tarascon, J. Electrochem. Soc., 2001, 148, A1266–A1274 CrossRef CAS PubMed.
- C. Montella, J. Electroanal. Chem., 2002, 518, 61–83 CrossRef CAS.
- J. Y. Xiang, J. P. Tu, Y. Q. Qiao, X. L. Wang, J. Zhong, D. Zhang and C. D. Gu, J. Phys. Chem. C, 2011, 115, 2505–2513 CAS.
Footnote |
| † Electronic supplementary information (ESI) available. See DOI: 10.1039/c3ra45268a |
| This journal is © The Royal Society of Chemistry 2014 |

