Martin Laher* and
Sabine Hild
Institute of Polymer Science, Johannes Kepler University Linz, Altenberger Strasse 69, A-4040 Linz, Austria. E-mail: Martin.Laher@jku.at; Tel: +43 732 2468 8711
First published on 5th December 2013
This paper focuses on the effect of polymer–solvent interactions and associated changes in the physical properties induced by the presence of solvent after vapour activation. The motivation was to understand the unbondability of activated parts during microfluidic chip fabrication at industrial scales after storage. In this context, missing knowledge due to still existing assumptions in literature concerning solvent bonding needs to be provided by experimental data finally to clarify the situation. A vapour infusion process using cyclohexane is demonstrated to successfully reproduce a defined solvent effect on injected moulded cyclo-olefin-polymer (COP) surfaces, characterized in this study at micro- and nanometer scales. Confocal Raman microscopy not only allows detection and visualization of remaining solvent in the top micrometer region, but also derivation of its distribution profile within the swollen surface layer. Atomic Force Microscopy (AFM) as a highly sensitive surface analysis technique enables a precise characterization of the top nanometer region of polymer surfaces by thermo-mechanical measurements. It further provides complementary results which are combined to create a complete picture about solvent effects on polymer surfaces. Understanding the influence of different parameters like activation time, time of bonding and post-activation treatments provides important knowledge for chip fabrication. The possibility to assess micrometer scale dimensions further enables imaging of specific areas of interest regarding chemical and thermal properties with local resolution at the nanometer scale. New aspects about solvent bonded interfaces can be graphically illustrated for the first time. A detailed characterization of final chips makes it possible to point out that the general assumption of complete solvent evaporation during bonding is insufficient regarding micrometer scale observations which is of great importance as microfluidic structures are of the same dimension. As long as physical interactions support solvent bonding, the conceptual knowledge derived in this study can be transferred to any polymer–solvent system.
A useful technique providing the possibility to modify polymers in a way to create bondability is surface activation. An activation treatment using solvents provides a potential low-cost alternative to plasma treatment and is known to enable homogeneous bond formation at temperatures far below the glass transition of the polymer without distortion of channel geometry thereby reducing the amount of substandard chips. Solvent assisted thermal bonding generally achieves 2–15 times greater bonding strength for poly(methyl methacrylate) (PMMA) compared to pure thermal bonding and can ideally reach the cohesive strength of the bulk material.12–18 Even though solvent bonding can be successfully applied, problems encountered at industrial scales underline the need to precisely understand the effect of solvent in order to optimize and improve microfluidic chip production.
Solvent activation provides a method to modify polymer surfaces as diffusing solvent molecules lead to a thin swollen surface layer inducing changes in its physical properties without any changes to the bulk. The solvent is expected to penetrate into the polymer as a sharp front propagating as a moving boundary of nearly constant concentration, characterized by a linearly dependent solvent uptake with time described as case II diffusion.15,19–21 The induced swelling of polymer increases polymer chain mobility as individual chain segments become surrounded and partly dissolved, which ultimately helps chain diffusion and results in entanglement and a tight bond formation.12,14,22,23 The situation after solvent activation can be seen to be analogous to the spin coating process where a polymer film is formed by rapid evaporation of solvent freezing polymer morphology.24 A stable polymer solution defines the starting condition for the spin coating process, but is not as easily defined for polymer surfaces exposed to solvent for only a few minutes.
Solvent activation can be done either by using liquids or exposure to air saturated with vapours of liquid solvents. A process of solvent vapour infusion, however, has been reported to show non-reproducible bonding behaviour15,20,23 possibly due to the effect of a surface resistance.25 Wallow et al.20 also mention when “some of the plastic components are not fully exposed to the permeant – a surface layer or “skin” develops – [which] interferes with the bonding process [making it] necessary for all the plastic components to be bonded to receive at least a brief exposure to the permeant in order to break through this surface layer”. Nevertheless, the infusion process has been shown to be successful for PMMA and COP/COC chip production even after exposure of just one component and only for a few minutes of activation.26–29 In this paper, a reproducible way of vapour infusion, indispensably needed when characterizing solvent induced changes in COP surfaces, is presented.
Even though the underlying concept of solvent bonding is theoretically understood, many assumptions and speculations circulate in literature regarding the effect of solvent, especially its penetration depth, distribution profile and whereabouts before and after bonding. Wallow et al.20 report that trapped solvent “remnant appears to be responsible for aiding the bonding process suggesting [it] diffuses away in the course of bonding and annealing”. They further report that the concentration of solvent present at the interface during bonding is obscure.15 Accordingly, Koesdjojo et al.14 write “presumably some of the solvent remains trapped in the bulk [and] will eventually permeate out from the surface … effectively bonding the two pieces once the solvent has completely permeated out”. In a different work, it is likewise suggested that the organic solvent is totally removed and evaporated after bonding and that no significant amount of residual solvent remains in microchannels30 leaving no interfacial layer of “significant thickness”.13 A gap of knowledge clearly prevents a complete understanding of solvent bonding and shows the necessity of a detailed analysis to clear up these assumptions.
Analysis techniques characterizing the final chip, by default, only include optical and/or SEM images of channel cross-sections to assure geometric integrity and complete bonding as well as a determination of achieved bond strength by tensile-, shear- or peel tests. Sometimes leakage tests applying compressed air13 or dyed liquids14,16,31,32 are used to confirm tight sealing after fabrication. Only once, a confirmation of a defect free bonding site after solvent bonding was shown by ultrasonic investigations.22 Not even neutron reflectometry was able to observe diffusing solvent.21 Induced changes in physical properties only in the topmost region require highly sensitive surface analysis techniques operating in micro- and nanometer scale to be detected. Swelling and deswelling of polymer is the key phenomenon used to bond microfluidic devices and as no characterization of the solvent effect on polymer surfaces before and after bonding has been implemented so far, a detailed chemical, mechanical and thermal analysis is presented in this study. Confocal Raman microscopy was chosen for detection of solvent within polymer and to derive its distribution profile with depth. Mechanical and thermal measurements were done using AFM because it provides the required sensitivity to detect minor changes in physical properties and a high lateral resolution in nanometer scale. A special heatable AFM cantilever allows thermal softening points to be locally measured. All methods additionally provide the advantage to map specific areas of interest and allow high resolution images to be calculated.
The development of solvent induced changes in the mechanical- and thermal properties of injected moulded COP surfaces considered with respect to the time elapsed after activation is discussed first. The second part concentrates on the extent of the solvent effect due to different activation times. Possible changes of evacuation and annealing treatments after activation are subsequently examined. The last part concentrates on cross-sections of bonded microchannels, especially bonding areas and microchannel covers.
Raman images show the area of the solvent peak integrated from 794–809 cm−1 plotted as “intensity value” at the local position. Each depth scan probed a volume of 20 × 20 × 10 μm split into a 20 layered stack separated by 500 nm scanned with 8 × 8 measurements per layer. The optical focus was adjusted on the surface assigned to be the first layer. An averaged spectrum of each layer was calculated and the integrated peak areas plotted versus depth to generate “depth scan” profiles. The depth-dependence of the Raman signal was corrected by a subtraction of an exponential fit to a reference depth scan on untreated, injected moulded COP covers. The corrected peak area value is denoted “area solvent peak” as plotted in figures. The standard deviation within an individual layer is about 2–3%. For an individual depth scan profile calculated for the profile taken after 2 h, is 2.4% in the first and 2.7% in the last layer, respectively. The reproducibility of individual depth scan results was proven for 5 different sets of samples.
![]() | ||
Fig. 1 Typical force–indentation curve measured by AFM used to derive mechanical properties as indicated. IPC is the initial point of contact. |
Hardness measurements were taken with a diamond tipped indenter lever of cube-corner geometry and a spring constant of 146 N m−1 (Micro Star Technologies, Huntsville, TX, USA). The tip radius is given to be below 50 nm. A maximum load of 15 μN was applied with a load- and unload rate of 100 μN s−1 and a dwell time of 0.2 s. The area function of this cube-corner tip was calculated from the unmodified z-signal of an AFM contact mode image of 1 μm in size and enables to correlate the tip area function up to an indentation depth of 250 nm.
Immediately after the activated sample is unloaded from the chamber, a sudden change of atmospheric conditions reverses the situation. The higher vapour pressure of solvent on the polymer surface triggers an evaporation process into ambient air. A chemical investigation with focus to detect and follow changes of the solvent concentration in the polymer surface was done by confocal Raman microscopy. The main interest with respect to solvent assisted bonding is to gain information about the thickness of the swollen layer and about the dependence of its solvent distribution with time. Therefore, a series of depth scans were acquired on an activated cover at different times after activation. The results presented in Fig. 2 show several interesting things.
![]() | ||
Fig. 2 Confocal Raman depth scans profiles of injected moulded COP covers after cyclohexane vapour exposure for 55 s. The area of the solvent peak directly corresponds to solvent intensity. |
Saturated cyclohexane vapour at room temperature swells the polymer surface down to a depth of 6–7 μm defining the diffusion limited after activation for 55 s. Fig. 2 also shows that the reached diffusion depth does not change with time whereas the solvent concentration reveals a strong initial decay within the first hour. Only minor changes thereafter elongate the time between two measurements required to detect ongoing changes up to several days. A decreasing vapour pressure of solvent in the swollen layer as its concentration goes down might explain a decelerating evaporation rate.
Considering each depth scan after activation, it is apparent that the highest solvent concentration is not found at the surface, but is consistently found about 2 μm below during the entire monitored period of 46 days. Only the distribution profile two minutes after activation has its maximum closer to the surface. This means that within the first minutes a strong gradient created by a thin film of absorbed solvent still drives molecules to diffuse into the polymer even though evaporation has already commenced. With ongoing time, the evaporation process increases the concentration gradient within the swollen layer inducing diffusive transport in opposite direction (towards the surface) and lowers the solvent content in the subsurface region. In order to re-establish equilibrium conditions, the concentration in the peak region is lowered to equalize the distribution profile disturbed by evaporation. Indicated by a stable peak position, the solvent concentration with depth is concluded to be controlled by a dynamic equilibrium.
The injection moulding process leads to internal stress in the polymer material as shear induced, non-equilibrium flow conditions in the mould are frozen upon cooling. In a swollen state, however, polymer chain segments possess the higher mobility necessary for relaxation processes. The solidification of swollen polymer regions by evaporation of solvent, therefore, enables reduction of this stress creating a slightly denser surface layer. An indication of the formation of a “surface resistance layer” or rapid vitrification of the plasticized polymer matrix has already been reported.15 Solvent evaporation from the surface together with the associated formation of a “resistance layer” possibly slowing down diffusion explains why the highest solvent concentration is not found at the surface, but some micrometers below.
Experimental data from confocal Raman microscopy clearly confirm speculations in literature that “presumably some of the solvent remains trapped in the bulk”14 after activation. Along with a decreasing solvent concentration in the swollen layer, an influence on mechanical and thermal characteristics is assumed. Expected changes in surface properties with time were investigated using AFM and LTA as these techniques provide highest sensitivity to detect changes in a region of only a few micrometers thickness.
Solvent induced changes in this paper are always discussed with respect to the corresponding value measured on untreated, injected moulded COP covers defined as 100%. This is because relative changes are more meaningful to compare than absolute ones. Absolute values (Table 1), furthermore depend on tip geometry, tip radius and measurement parameters. However, as solvent induced changes are calculated relative to untreated values, this dependence is rendered ineffective and allows a comparative presentation of different parameters within one figure (Fig. 3).
Parameter | Injection moulded | Unit |
---|---|---|
Max. ind. depth | 59.3 ± 2.6 | nm |
Total energy | 47.1 ± 1.5 | fJ |
Plastic energy | 42.2 ± 1.6 | fJ |
Elastic energy | 4.9 ± 0.4 | fJ |
Adhesion force | 204.4 ± 10.5 | nN |
Hardness | 116.0 ± 6.7 | MPa |
Stiffness | 21.8 ± 0.8 | N m−1 |
Softening temp. | 100.3 ± 0.6 | °C |
![]() | ||
Fig. 3 Chronology of mechanical (calculated from AFM force-) and thermal (LTA-) measurements on injected moulded COP covers after solvent activation for 55 s. |
Mechanical characteristics were calculated from force measurements described in Section 2.4. An activation treatment of 55 s with cyclohexane vapour creates a swollen surface layer opposing a lower resistance to the penetrating cantilever tip. An increase of the maximum achievable indentation depth immediately after activation of about 50% is found. Almost identical values are calculated for the total energy (sum of elastic and plastic energies). As the elastic component remains constant at 79.1 ± 8.0%, the associated increase results from plastic energy alone. The polymer surface can be plastically deformed to an extent about 60% higher compared to untreated samples due to higher chain mobility in the swollen layer. The adhesion force is also increased to about 140% and shows the same trend as indentation depth, but is influenced by a larger contact area of the tip with increasing indentation. For reasons of clarity, total energy, elastic energy and adhesion force are not shown in Fig. 3.
Contrary to increasing parameters after activation, stiffness and hardness are reduced to about 65% and 80%, respectively. The higher deviation range for hardness values can be explained by the fact that a special cantilever with known tip geometry and a higher spring constant is needed. This further goes along with a lower sensitivity to mechanical changes and explains larger deviations in hardness values as the contact area is calculated form squared indentation values. Compared to an achieved indentation depth of about 60 nm on untreated chips with the “normal” cantilever, a depth of ≈160 nm is probed in hardness measurements.
A mechanical investigation by AFM demonstrates apparent changes in physical properties of up to 50% after solvent activation within the top 100 nm region. Even though some of the discussed parameters show an increase whereas others are decreased, all show the same physical effect. The most reasonable modification due to the presence of solvent is surface softening seen in different variables like the maximum indentation depth, plastic energy and hardness. The stiffness value directly corresponds to a softer sample contact because a higher indentation depth is achieved with the same force. The surface softening of only the top surface layer explains why no problems concerning microchannel deformation are encountered in solvent assisted thermal bonding. Pressure applied in order to achieve intimate contact between mate parts enables a tight and homogenous bond formation whereas unsoftened bulk structures are not deformed.
All changes in mechanical variables after the activation treatment, however, are impermanent and immediately follow the tendency to reattain original values of untreated covers (100% line in Fig. 3). The distinct softening effect diminishes quickly (primarily during the first 20 min) and levels off about 30 min after activation with 10–20% deviation from original values. This again shows that there is remaining solvent retained within the swollen layer as could also be seen with confocal Raman microscopy even 46 days after activation. A residual mass of solvent present for at least one hour after immersion has already been reported by Wallow et al.15 for thin spin coated films, but can now be correlated to changes in mechanical characteristics. With respect to results derived from confocal Raman depth scans, the effect of a solvent treatment to modify surface properties is concluded to be exclusively defined by the concentration of solvent within the swollen layer.
Many physical properties of amorphous, thermoplastic polymers also show characteristic changes around a certain temperature range when heated. Changes in heat capacity, viscosity or the thermal expansion coefficient, for example, are used to define the onset of chain segmental mobility as the glass transition temperature. At this temperature, the sample also starts to soften. Local thermal analysis (LTA) allows measurement of the amount of thermal energy transferred during the heating time required to reach local softening at the nanometer scale. The heating time is then used to calculate the associated softening temperature Ts. Due to the fact that temperature and the presence of solvent both increase chain segmental mobility, a thermal investigation provides further insight about the effect of solvent on polymer surfaces.
The dependence of softening temperatures upon time can be nicely followed by LTA and is also plotted in Fig. 3 (open squares). After activation, a lower amount of energy is needed to thermally soften the polymer surface. As the boiling point of cyclohexane (81 °C) is lower than the Ts of COP, the hot tip will also induce local solvent evaporation from the probed volume. In order to eliminate any thermal influence, each measurement was taken at a new position. Compared to untreated, injected moulded COP covers, a distinct reduction of the softening temperatures of about 55% immediately after activation was found. Due to natural evaporation, this reduction is again impermanent and Ts increases within the first 15 minutes to about 60%, reaching 67% after one hour. After one week a Ts of 87% is measured and after one month 91%, confirming a deceleration of solvent induced changes with time and that initial values are never reached again due to the omnipresence of solvent as already discussed.
Mechanical analysis by AFM force–indentation curves probed the upper 50 nm of the polymer while hardness measurements reached an indentation depth of 160 nm. The depth, however, to which LTA measurements are sensitive to cannot be ascertained as easily. The distribution of heat generated in the cantilever together with the thermal profile around the tip in contact to the sample have been discussed and simulated by different groups.40–43 A spherical heat propagation around the tip has been experimentally shown by Schönherr et al.43 The depth profile of temperature gradients below the heated tip, however, can also be found to be simulated as parabolic and cylindrically shaped.44 No matter how the depth profile might be, the maximum depth heat can penetrate during a measurement depends on the heating rate, the heat conductivity of the sample (for thin films also on that of the substrate), the tip radius and the ambient temperature. For parameters used in the current work, we estimate the heating tip to sense an influence on thermal energy of up to 10–15 μm. This we conclude from an investigation on polymer films with several thicknesses supported on different substrates. Together with results from Raman microscopy, this shows that LTA is not a pure surface analysis technique, but also provides information about a certain depth range below the surface contact. A higher solvent concentration in a larger probed volume might be the reason why the solvent effect can be seen more distinctly with LTA compared to force–indentation measurements with AFM (see Fig. 3).
A thermal investigation by LTA not only underlines the applicability of this technique to characterize the solvent effect, it also confirms chemical and mechanical results providing another experimental proof of remaining solvent within the swollen surface layer generally assumed to be responsible for bonding. A lower softening temperature of only a few micrometers thick layer provides a second essential reason to understand why channel deformation is not an issue in solvent assisted thermal bonding. Compared to pure thermal bonding, the application of solvents allows much lower temperatures to be used to generate a tight and homogeneous bonding while unswollen bulk structures are not softened.
Fig. 4 shows solvent distribution profiles with depth resulting from different activation times ranging from 20 to 70 s. A clear distinction between individual profiles in the swollen layer found even 11 days after activation confirms a reproducible and accurate activation process for differences in activation times of as little as 10 seconds to be possible by our method of vapour infusion. It also shows that longer solvent exposure leads to increasing diffusion depths from 5 to 8 μm because a higher solvent concentration at the surface creates a stronger gradient driving molecules to further diffuse into the polymer. The already known distribution profile governed by the dynamic equilibrium with the highest amount of solvent trapped about 2 μm below the surface is again found and is independent of activation time. The depth scan data after a treatment of 70 s seems to be shifted by about half a micrometer which can, however, be attributed to a badly adjusted optical focus due to a decreasing height level by fast deswelling of the surface. Depth scans after the shortest activation time (20 and 30 s) do not show this profile clearly because solvent concentrations for these activation times are quite low after 11 days and are close to the detection limit.
![]() | ||
Fig. 4 Confocal Raman depth scans measured 11 days after solvent activation for different treatment times on injected moulded COP covers. |
Mechanical and thermal properties of injected moulded COP covers after different activation times can also be distinguished. The stiffness is chosen to be discussed representatively for all mechanical characteristics presented in Fig. 3 as plots of other variables look similar. The development of stiffness data for 5 different activation times ranging from 30 to 70 s calculated relative to values measured on untreated COP surfaces is plotted versus time (Fig. 5).
Immediately after a solvent treatment for 70 s, the stiffness is reduced to about 50% whereas it decreases by only about 35% after an activation for 30 s. The clear distinction within the first 5 minutes primarily results from initially faster decreasing rates due to a higher vapour pressure of absorbed solvent on the surface after longer activation. Additionally, it can be seen that the stiffness measured a certain period of time following longer treatments reaches the value measured immediately after shorter infusion times. For example, the stiffness after 70 s requires about 5 minutes to reach the initial value measured immediately after an activation for 30 s. However, having reached the same level, all stiffness values continue to increase with the same rate. This additional time required to equalize values corresponds to a horizontal shift factor of the data plotted in Fig. 5. By shifting individual curves in the x-direction, they can be adjusted to be almost congruent. This shows that the evaporation rate governing the decay thereafter is the same for identical solvent concentrations already derived to be the only parameter taking effect on swelling induced changes and their decay with time.
Differences in local softening temperatures due to a variation of activation times can also be detected by LTA. An initial reduction of Ts about 65% is found after exposure for 70 s. Compared to a maximum solvent effect on stiffness values of only 50%, the higher effect is attributed to the larger probed volume. Another confirmation is found in the fact that the discriminability between different activation times is much higher for LTA compared to stiffness measurements (10% and 5% respectively). The dependence of softening temperatures on activation times shows a linear correlation and a clear distinction between each activation time. A small increase of Ts is measured even after one month. After one week, the linear range of Ts values is averaged to 89.2% of the softening temperature on untreated COP surfaces. After one month, Ts values are averaged to 89.9% which confirms minor changes as expected due to almost frozen evaporation, but still showing the residual effect after solvent activation.
Even though based on different operating principles, chemical analysis using Raman microscopy and thermo-mechanical measurements by AFM confirm a reproducible and accurate activation process. Furthermore, both surface analysis techniques turned out to be applicable to detect differences in the extent of solvent induced modifications because of the possibility to operate and probe changes at micro- and nanometer scales. The effect of different activation times shows that a longer treatment simply loads the polymer layer with a higher amount of solvent which allows prolonging of the fabrication window for a successful bonding process by providing the required solvent effect over an extended period of time.
Activated samples were either isothermally tempered at 80 °C or evacuated down to a pressure of ≈0.8 mbar for one hour each. To investigate changes induced by these treatments, the initial and final state of solvent distribution profiles are compared (Fig. 6).
Regarding the effect of an isothermal treatment, the solvent distribution itself is not changed and conforms to the known equilibrium profile even after tempering (squared plots in Fig. 6). A lower concentration with the largest reduction at the peak position again confirms the solvent distribution within the swollen layer to be controlled by a dynamic equilibrium. The declining surface concentration due to heat induced evaporation creates a strong concentration gradient equilibrating and re-establishing the disturbed profile for the lower concentration creating the impression that solvent evaporates from the reservoir below the surface. An isothermal treatment at 80 °C provides enough energy for solvent molecules not only to diffuse to the surface, but also to evaporate faster because of a higher mobility at elevated temperatures. The overall influence of heat, though, is to provide the energy required to accelerate evaporation yielding lower solvent concentrations much fast than the decay at room temperature.
Plastic energy and stiffness data are discussed representatively for other mechanical characteristics as they show opposite effects sufficient to create a complete picture of post-activation influences. A figure showing mechanical data is presented in the ESI (Fig. S1).†
Considering the influence of an isothermal treatment on mechanical parameters, a reduction of plastic energy about 10% is found for all activated samples. This corresponds to a hardening of the surface layer also seen in the associated increase of the stiffness of about the same value. A tempering process, however, has an additional effect on injected moulded parts as heat penetrates through the entire volume. Flow conditions in the mould when the polymer melt is injected and pressure is applied cause orientation of polymer chains to a certain extent. This creates internal stress as a non-equilibrium state is frozen when cooling down rapidly to room temperature after demoulding. A thermal treatment not only provides the energy to accelerate evaporation, it also enables relaxation processes within the material reducing stress and slightly increasing stiffness/hardness.
Considering an evacuation treatment, Fig. 6 (triangles) shows that vacuum conditions increase the solvent concentration in the top 2 μm region. At vacuum conditions, the vitrified resistance layer created by solidification of the swollen surface can be permeated more easily by diffusing solvent molecules because a higher concentration gradient creates a stronger driving force. Modified physical conditions at low pressure influence the dynamic equilibrium and change the distribution profile. Thus, an evacuation treatment can be seen as a kind of re-activation effect by extraction of solvent from the reservoir below created during solvent activation. It leads to a re-swelling of the top surface region and can be used to re-provide the necessary solvent concentration for a successful process at the time of bonding.
The influence of an evacuation treatment on mechanical properties is inverse to a thermal treatment because the effect on the solvent concentration is the exact opposite. An increase in plastic energy means that the sample can be more easily deformed within the probed depth range of 50 nm. The impact is more pronounced for samples originally exposed to solvent vapour for longer times as a higher amount of solvent is trapped and can be extracted to the surface. For example, plastic energy is increased by 10% on samples treated for 30 s, but by 20% on those activated for 60 s. To achieve the same plastic deformation after evacuation as compared to an isothermally tempered sample, 20% less energy is required. A lower resistance against the penetration of the cantilever tip can also be seen in the associated reduction of stiffness about the same extent after evacuation. Considering these results with respect to chip fabrication, an evacuation treatment could be used to re-soften the surface without any changes to bulk properties, which allows reactivation of unbondable parts after longer storage times.
Optical microscope and SEM images of microchannel cross-sections sometimes allow distinguishing a topographic boundary between mate parts probably resulting from the cutting process, but none of these techniques allows identification of solvent containing regions. AFM tapping mode images of freshly cut chips do not reveal any bonding zone either and even the very sensitive phase image does not allow to distinguish different regions if carefully and smoothly cut. AFM height images of chip cross-sections taken several days after sample preparation provide a first hint of a solvent containing interface as the supposed bonding area subsides by about 10 to 50 nm leaving a kind of groove. This caving results from a reduction of swollen volume as solvent evaporates leading to the conclusion that there is residual solvent even in bonding areas of microfluidic chips.
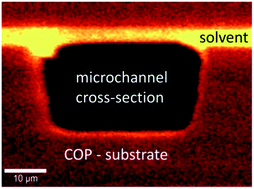
To actually confirm the existence of solvent in bonding areas, a chemical investigation of a small channel cross-section of 40 × 20 μm was done using Raman microscopy. The calculated image (Fig. 7) not only confirms the obvious existence of a linear region containing solvent in bonding areas and even microchannel covers, it further clearly shows the diffusion front as distinct boundary sharply separating regions not containing solvent. This allows speculations about complete evaporation circulating in literature now shown for the first time by unambiguous experimental data to be incorrect. The thickness of the solvent containing region of 4–5 μm is only about 2 μm lower than the value derived from confocal Raman depth scans. However, this is perfectly reasonable as the softer, swollen surface is compressed during bonding to form a tight connection. Fig. 7 also shows a slightly lower solvent concentration in the channel cover compared to the adjacent bonded regions. The lower concentration might result from the open structure facilitating evaporation of solvent through microchannels.
With respect to these results, the solvent in the final chip was attempted to be removed. The effect of an evacuation step (1 h at ≈0.8 mbar), however, shows that solvent contrarily is found with even slightly higher intensity on the cross-sectioned surface confirming that vacuum conditions extract solvent closer to the surface. An annealing process at 80 °C for one hour could not remove solvent either, but lowers its concentration, again consistent with results from post-activation treatments on activated covers.
A more detailed analysis of areas indicated by squares in Fig. 7 was done using local thermal analysis. LTA technique not only permits detection of solvent in polymer, it is also the only existing method that allows calculation of thermal images showing the local softening temperature distribution in the scanned area of interest providing nanometer scale resolution.
Fig. 8(a) provides an AFM height image showing the topography of a cross-sectioned bonding area without any boundary visible, except for the coloured overlay of the thermal image calculated from LTA measurements in a matrix of 16 × 16 points acquired over the same area. The thermal image shows a solvent containing region with softening temperatures of ≈85 °C presented in blue clearly distinguished from polymer not containing solvent (102 °C). Interestingly, the topography of the same area after thermal measurements (Fig. 8(b)) shows a wall of more than 300 nm in height created by heat induced evaporation naturally raising only solvent containing polymer as confirmed by the overlayed thermal image. Thus, AFM height images provide a real “physical” proof that the amount of thermal energy transferred during LTA measurements induces evaporation of remaining solvent.
![]() | ||
Fig. 8 AFM tapping mode height images of a cross-section of the bonding area as indicated in Fig. 7 with overlay of the thermal image from LTA measurements in colour. (a) Topography of a new cut cross-section before thermal measurements; (b) topography after thermal measurements. |
LTA was also used to investigate cover plates above microchannels with higher lateral resolution after post-activation treatments additionally applied in order to remove solvent. The topography of a 20 μm section of a cover edge taken before thermal measurements was smooth and planar, without any bonding area visible. The AFM height image after LTA measurements with overlay of the thermal image (Fig. 9), however, shows a sag of the solvent containing edge about 150 nm by heat induced evaporation. Compared to the creation of a wall from solvent containing polymer upon evaporation from confined volumes, a sole reduction is found without confinement. The thermal image with 32 × 32 points taken after evacuation still clearly shows a solvent containing edge with softening temperatures about 5 °C lower than regions without solvent. An isothermal annealing step at 80 °C was also inadequate to remove solvent as the taken thermal image looks similar to Fig. 9.
![]() | ||
Fig. 9 AFM tapping mode height image of the edge of an (initially flat) microchannel cover cross-section as indicated in Fig. 7 after evacuation (1 h at ≈0.8 mbar) and after the overlayed thermal image (32 × 32 measurements) was taken. |
The lower difference in Ts values of solvent and no solvent containing regions in the higher resolution image is probably caused by the increasing number of thermal measurements heating up the whole imaged area. The distance between two local positions was 1.3 μm in Fig. 8, but decreased to only 0.6 μm as resolution was increased from 16 to 32 points for Fig. 9. A higher resolution image provides more accurate data, but additionally shows the influence of one thermal measurement on subsequent ones due to lower separation. Heat provided by the tip propagates spherically and slightly increases the temperature of surrounding regions. If the next measurement position is within that range, heat could propagate in the time between these two measurements, then the subsequent softening temperature would be measured slightly higher as is the case in Fig. 9. The hot tip also induces evaporation of solvent from a certain area leading to gradually increasing values of Ts. This influence on solvent containing polymer is intensified if heat cannot be removed like from a bonded region. A thermal image with high resolution corroborating this influence is provided in the ESI showing gradually higher softening temperatures along the bonding line (Fig. S2).†
Several demonstrations of the perfect performance of solvent bonded microfluidic chips for applications with high resolution detection26,27,30 confirm that there are no problems concerning remaining solvent. The fact that our attempts by evacuation or tempering turned out to be insufficient to remove solvent suggest that it is strongly confined by a dense glassy surface layer created by solidification of the swollen surface due to evaporation obviously preventing contact with liquids flowing through microchannels. An analysis of the uppermost surface range of 0.5–5 nm with AFM force measurements gave no indication of present solvent either.
Footnote |
† Electronic supplementary information (ESI) available: Mechanical data after post-activation treatments and a thermal image showing heat induced evaporation from the bonding area. See DOI: 10.1039/c3ra45167d |
This journal is © The Royal Society of Chemistry 2014 |