A tandem mass spectrometry-based method to assess the architectural purity of synthetic polymers: a case of a cyclic polylactide obtained by click chemistry†
Thomas
Josse
ab,
Julien
De Winter
ab,
Philippe
Dubois
b,
Olivier
Coulembier
b,
Pascal
Gerbaux
*a and
Antony
Memboeuf
*c
aInterdisciplinary Center for Mass Spectrometry, Organic Synthesis and Mass Spectrometry Laboratory, University of Mons, 23 Place du Parc, 7000 Mons, Belgium. E-mail: pascal.gerbaux@umons.ac.be
bCenter of Innovation and Research in Materials and Polymers, Laboratory of Polymeric and Composite Materials, University of Mons, 23 Place du Parc, 7000, Mons, Belgium
cUniversité de Brest, CNRS, UMR 6521, 6 Av. Le Gorgeu, 29200 Brest, France. E-mail: antony.memboeuf@univ-brest.fr
First published on 29th August 2014
Abstract
A tandem mass spectrometry-based method is developed to determine the degree of purity achieved in the cyclization of a linear poly(L-lactide) prepared by copper-catalyzed alkyne-azide cycloaddition. When proton nuclear magnetic resonance, size-exclusion chromatography, and single-stage mass spectrometry are unable to demonstrate the presence of a residual linear polymer, the proposed ESI-tandem mass spectrometry methodology allows detection of starting material traces (<5%) based on radically different collision-induced dissociation (CID) behaviours. The technique is believed to be readily adaptable to numerous isomeric pairs of macromolecules presenting different CID characteristics.
Introduction
Click reactions have recently attracted increased attention, specifically for use in materials and life sciences.1 In the last decade, the preparation of well-defined complex polymer architectures such as block (co)polymers,2 star-shaped polymers3 or dendrimers4 was successfully achieved based on click couplings. In particular, the design of cyclic peptides,5 polynucleotides6 and more generally cyclic polymers has been drastically improved using click reactions, i.e. copper-catalyzed alkyne-azide cycloaddition (CuAAc),7 Hetero-Diels–Alder cycloaddition (HDA),8 and the thiol–ene coupling.9 Although the CuAAc reaction between azide and alkyne complementary end-groups is nowadays the most common method for the preparation of cyclic polymers and is well-known for its remarkable efficiency, trace amounts of the linear precursor are inescapable. As polymer physical properties are inherently related to the chemical structure, the architectural purity assessment is a key step in their evaluation.10 The traditional characterization techniques, such as proton nuclear magnetic resonance (1H NMR), size-exclusion chromatography (SEC), and Fourier Transformed Infra-Red (FT-IR) spectroscopy, are not sensitive enough to characterize unambiguously the purity of cyclic polymers and provide only averaged information over the sample. Usually, mass spectrometry (MS) measurements can provide far more detailed information on the chemical structure of individual polymer chains as well as side-products with a high sensitivity.11 Nevertheless, as a consequence of the 100% atom economy12 of click reactions, linear and cyclic polymers are isomers and therefore the purity cannot be unequivocally assessed based on single-stage MS measurements.7,8 On-line coupling with a chromatographic separation technique, i.e. Ion-Mobility (IM), was recently used to differentiate linear and cyclic poly(ε-caprolactone) topological isomers.13 More recently, tandem mass spectrometry was also used to differentiate macrocycles from their linear analogues, by careful visual inspection of MS/MS spectra14 or combined with a complex energy-resolved ion-mobility strategy15 but without giving any quantitative information. In a recent report, Memboeuf et al. presented a simple tandem mass spectrometry-based method for the analysis and quantification of a mixture of isobaric ions using the Survival Yield (SY) technique.16 Depending on the excitation regime in Collision-Induced Dissociation (CID) experiments, isobaric ions were separated and quantified. The procedure relies on the fact that fragment ions of the two isobars are induced at different collision energies according to differences in the structures of the isobaric components. In this context, Grayson and co-workers recently reported the CID fragmentations of cyclic and linear polymer isomers obtained by CuAAc reaction.14 As long as the polymer exhibits an azide end-group, the partial elimination of the N2 molecule is highlighted even at the low excitation regime.17 Interestingly, the triazole linker resulting from the cyclization is no longer prone to the loss of N2. In the present report, we take advantage of this fingerprint fragmentation for quantitative purpose using the survival yield technique.Results and discussion
Cyclic poly(L-lactide) (P(L-LA)) was prepared by CuAAc reaction performed on the well-defined linear α-azide-ω-alkyne P(L-LA) (MSEC, appn = 6500 g mol−1; ĐM = 1.12). The general procedure is depicted in Scheme 1. | ||
| Scheme 1 Synthetic route for the preparation of cyclic P(L-LA) using CuAAc click coupling. PMDETA = N,N,N′,N′′,N′′-pentamethyldiethylene triamine. | ||
The preparation of the functional precursor 1 was realized according to the published procedure.7 First, the cyclization efficiency was determined by qualitative techniques, i.e. SEC and Matrix-assisted Laser Desorption/Ionization mass spectrometry (MALDI-MS), and quantitative 1H NMR. A direct evidence of the cyclization efficiency can easily be provided by SEC analysis. In general, a cyclization reaction leads to a more compact structure resulting in a smaller hydrodynamic volume. Consequently, cyclic polymers display a longer retention time.18 In close agreement, a clear shift of the entire molar mass distribution of polymer 1 (MSEC, appn = 6500 g mol−1; ĐM = 1.12) to higher elution volume combined with the retention of the molar mass distribution attests the high efficiency of the cyclization reaction, affording cyclic polymer 2 (MSEC, appn = 4500 g mol−1; ĐM = 1.13) (Fig. 1). Since the Mark–Houwink parameters for P(L-LA) chains cannot be applied to the macrocyclic topology, the as-reported SEC molecular weights (MSEC, appn) are relative to polystyrene standards and therefore over predicts the absolute average molecular weights.
 | ||
| Fig. 1 Overlay of SEC traces for the linear precursor, α-azide-ω-alkyne-P(L-LA) 1 and the cyclic polymer 2. | ||
The MALDI-TOF MS spectra depicted in Fig. 2 for linear precursor 1 and macrocycle 2 reveal a common major distribution, consequence of the ‘click’ atom economy, and are therefore indistinguishable based on this signal only. As suspected following the report of Grayson and co-workers,17 linear precursor 1 is prone to the loss of N2 (Fig. 2a), while for cyclic product 2 this loss is no longer observed. Moreover, protonated ions of 2 appear as a signature for the triazole group, due to its pronounced basicity (Fig. 2b).
 | ||
| Fig. 2 MALDI-MS spectra of (a) α-azide-ω-alkyne-P(L-LA) 1 and (b) the cyclic polymer 2. An expanded region from m/z 3380 to m/z 3560 is illustrated on the right. NaI is used as cationization agent. | ||
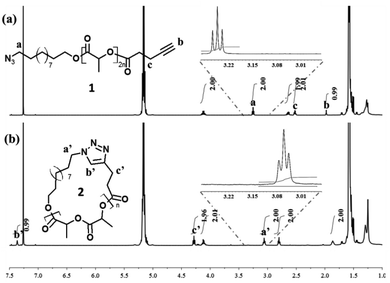
In addition to an apparent reduction in the molecular weight in SEC experiments (Fig. 1), the efficiency of the intramolecular cyclization is unequivocally confirmed by MALDI-MS analyses where the molecular weight of the polymer samples 1 (MMALDIn = 3500 g mol−1; ĐM = 1.05) and 2 (MMALDIn = 3500 g mol−1; ĐM = 1.05) remained unchanged after the “click” cyclization (Fig. 2). The cyclization is also confirmed to proceed to very high conversions by the complete disappearance of characteristic signals for linear P(L-LA) 1, i.e. δ = 1.98, δ = 2.52 and δ = 3.25 ppm (protons b, c and a respectively in Fig. 3a), but also by the presence of the characteristic signals, i.e. δ = 3.06, δ = 4.28 and δ = 7.37 ppm (protons a′, c′ and b′, respectively, in Fig. 3b), of the cycloadduct in the 1H NMR spectra.
As a preliminary conclusion, quantitative conversion of the linear P(L-LA) 1 into the cyclic P(L-LA) 2 seems to be pointed out by all these characterization techniques (SEC, MALDI-MS and 1H NMR). However, whereas 1H NMR spectroscopy is well-known to afford quantitative information, this method definitively suffers from a lack in sensitivity, particularly well-emphasized for the quantification of macromolecules end-groups at the trace level.19
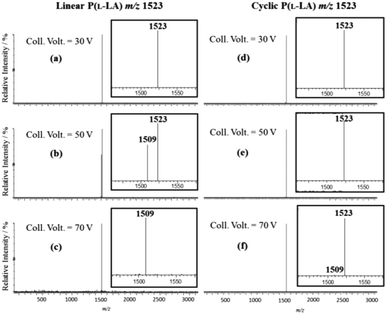
To overcome this lack in sensitivity and fully characterize the cyclization product, our isomeric system was then submitted to tandem mass spectrometry methods with special care given to the detection of residual linear macromolecules. Electrospray ionization (ESI) tandem mass spectrometry analysis of lithium cationized P(L-LA) precursor 1 and cyclic P(L-LA) 2 were performed, both separately and in mixtures (see ESI†, Fig. S1). CID experiments were done on the doubly charged ion m/z 1523 corresponding to a degree of polymerization (DP) of 19. MS/MS spectra were recorded at increasing collision voltages (CV) from 5 to 100 V. In the range 30–70 V, a pure linear polymer gives fragment ions at m/z 1509 only, corresponding to the loss of N2 from parent ions at m/z 1523, while the cyclic polymer remains quasi-unfragmented in the same range (Fig. 4). Fragment ions of 2 were found in the range 75–100 V (see ESI†, Fig. S2). The Survival Yield technique uses the Survival Yield (SY) ratio which is a convenient quantitative measure of the fragmentation degree that is defined according to: SY = ((IM)/(IM + ∑IF)), where IF stands for the intensities of fragment ions peaks and IM for the parent ions peak intensity.20 Using this definition, the value of this ratio can be recorded and plotted as a function of the excitation voltage: this leads to the SY curve.
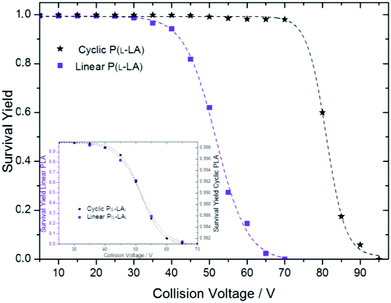
Under the same experimental conditions, SY curves for linear and cyclic polymers 1 and 2, respectively, were first obtained separately (Fig. 5). At the same mass-to-charge ratio, the curve obtained for lithium cationized cyclic P(L-LA) is shifted to much higher excitation voltages as compared to the one obtained for linear P(L-LA). This is in close agreement with the general assumption that collisionally-excited cyclic cations first undergo a ring-opening reaction that leads to linear cationic species having exactly the same m/z ratio.21 Therefore, under the same experimental conditions, cyclic cations exhibit a delay in the collision-induced dissociations compared to their linear isomers. At 70 V the whole population of linear [PLA19 + 2Li]2+ parent ions have already dissociated by loss of neutral N2, when in contrast cyclic polymer [PLA19 + 2Li]2+ molecular ions do not exhibit fragment ions at first glance. A closer inspection of the cyclic polymer SY curve in the range 30–70 V reveals a small decrease with a sigmoid-type shape, well-illustrated after magnification of the SY curve (Fig. 5, inset). By plotting both SY curves for linear and cyclic polymers in their respective fragmentation range between 30 and 70 V, an almost perfect overlap was observed, which demonstrates the presence of molecules of the linear type inside the cyclic polymer sample. Interestingly, the latter is expected to contain pure cyclic polymers according to other characterization techniques.
In order to evaluate the degree of contamination, we used the standard addition method (addition of different precise amounts of pure linear polymers into the cyclic polymer sample), and measured the SY curves for the new samples. Briefly, when increasing the amount of linear polymers into the cyclic sample, the SY curve tends to get closer to the curve obtained in the case of a pure linear sample (Fig. 6).
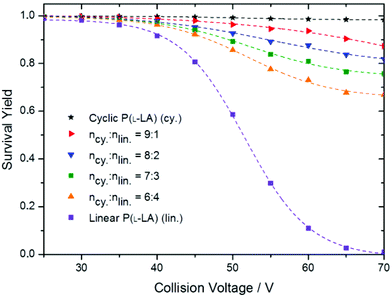 | ||
Fig. 6 SY curves for cyclic, linear and cyclic![[thin space (1/6-em)]](https://www.rsc.org/images/entities/char_2009.gif) : :![[thin space (1/6-em)]](https://www.rsc.org/images/entities/char_2009.gif) linear P(L-LA) mixtures at relative concentrations 9 linear P(L-LA) mixtures at relative concentrations 9![[thin space (1/6-em)]](https://www.rsc.org/images/entities/char_2009.gif) : :![[thin space (1/6-em)]](https://www.rsc.org/images/entities/char_2009.gif) 1, 8 1, 8![[thin space (1/6-em)]](https://www.rsc.org/images/entities/char_2009.gif) : :![[thin space (1/6-em)]](https://www.rsc.org/images/entities/char_2009.gif) 2, 7 2, 7![[thin space (1/6-em)]](https://www.rsc.org/images/entities/char_2009.gif) : :![[thin space (1/6-em)]](https://www.rsc.org/images/entities/char_2009.gif) 3 and 6 3 and 6![[thin space (1/6-em)]](https://www.rsc.org/images/entities/char_2009.gif) : :![[thin space (1/6-em)]](https://www.rsc.org/images/entities/char_2009.gif) 4, recorded under the same experimental conditions. 4, recorded under the same experimental conditions. | ||
As exemplified in Fig. 6, CV in the range 60–70 V affords enough fragment ions to achieve a high sensitivity. Since the entire quantification method is based on the observation of fragment ions from the linear isomer, only the data points obtained at these high collision voltages were considered. By separately collecting data points obtained at 60, 65 and 70 V collision voltages and plotting (1-SY) as a function of the relative amount of linear polymers added, straight lines are obtained using simple linear regression (Fig. 7). The absolute value of the x-axis intercept provides access to the amount of linear contaminants in the initial cyclic polymer sample (or simply by dividing the slope by the intercept in the linear fit equation). In the original cyclic polymer sample, we determined that at 70 V, 2.3 ± 1% of the linear isomer is still present considering a 95% confidence interval. The robustness of the method is demonstrated by the determination of a linear residue content of 2.1 ± 0.9% and 1.8 ± 1.1% for CV = 65 and 60 V, respectively.
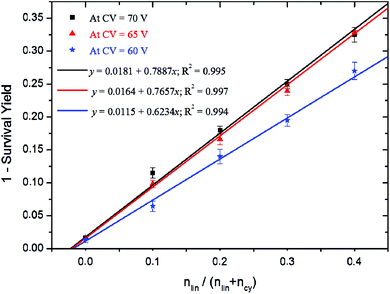 | ||
Fig. 7 Correlation between the SY values recorded at 60, 65 and 70 V collision voltages and the ratio cyclic/linear P(L-LA) from sample preparation 9![[thin space (1/6-em)]](https://www.rsc.org/images/entities/char_2009.gif) : :![[thin space (1/6-em)]](https://www.rsc.org/images/entities/char_2009.gif) 1, 8 1, 8![[thin space (1/6-em)]](https://www.rsc.org/images/entities/char_2009.gif) : :![[thin space (1/6-em)]](https://www.rsc.org/images/entities/char_2009.gif) 2, 7 2, 7![[thin space (1/6-em)]](https://www.rsc.org/images/entities/char_2009.gif) : :![[thin space (1/6-em)]](https://www.rsc.org/images/entities/char_2009.gif) 3 and 6 3 and 6![[thin space (1/6-em)]](https://www.rsc.org/images/entities/char_2009.gif) : :![[thin space (1/6-em)]](https://www.rsc.org/images/entities/char_2009.gif) 4. 4. | ||
Experimental
Materials
All reagents were purchased from Aldrich and used without further purification, unless otherwise noted. L-LA (≥99%) was purchased from Galactic, recrystallized from dried toluene three times and stored in a glove box under a dry nitrogen atmosphere (O2 < 5 ppm, H2O < 1 ppm) prior to use. CH2Cl2 was dried over CaH2 for 48 hours at r.t., distilled under reduced pressure and stored in a glove box under a dry nitrogen atmosphere. 1,8-diazabicyclo-[5.4.0]undec-7-ene (DBU) was purchased from Fluka, dried over BaO, distilled and stored in a glove box. Copper(I) bromide was purified by washing with acetic acid. 11-azidoundecanol was synthesized as reported in the literature22 and dried over anhydrous MgSO4 prior to storage in the glove box. 4-pentynoic anhydride was also synthesized as reported in the literature.23Instrumentation
1H NMR spectra were recorded in CDCl3 at a concentration of 20 mg per 0.6 mL on a Bruker AMX500 (500 MHz), with a shift reported in parts-per-million downfield from tetramethylsilane used as an internal reference.Size exclusion chromatography was performed in THF (with 2% triethylamine added) at 35 °C using a Polymer Laboratories liquid chromatograph equipped with a PL-DG802 degasser, an isocratic HPLC pump LC 1120 (flow rate = 1 mL min−1), a Marathon autosampler (loop volume = 200 μL, solution conc. = 1 mg mL−1), a PL-DRI refractive index detector and three columns: a PL gel 10 μm guard column and two PL gel Mixed-B 10 μm columns (linear columns for separation of MWPS ranging from 500 to 106 Daltons). Poly(styrene) standards were used for calibration.
Positive-ion MALDI-MS experiments were conducted using a Waters QToF Premier mass spectrometer equipped with a nitrogen laser, operating at 337 nm with a maximum output of 500 J m−2 delivered to the sample in 4 ns pulses at a 20 Hz repeating rate. Time-of-flight mass analyses were performed in the reflectron mode at a resolution of about 10k. All the samples were analyzed using trans-2-[3-(4-tert-butylphenyl)-2-methylprop-2-enylidene] malononitrile (DCTB) as a matrix. That matrix was prepared as 40 mg mL−1 solution in CHCl3. The matrix solution (1 μL) was applied to a stainless steel target and air-dried. Polymer samples were dissolved in CHCl3 to obtain 1 mg mL−1 solutions. Aliquots (1 μL) of those solutions were applied onto the target area already bearing the matrix crystals, and air-dried. For the recording of the single-stage MS spectra, the quadrupole (rf-only mode) was set to pass all the ions of the distribution, and they were transmitted into the pusher region of the time-of-flight analyzer where they were mass analyzed with 1 s integration time. Data were acquired in continuum mode until acceptable averaged data were obtained.
Positive-ion ESI tandem Mass Spectrometry (ESI-MS/MS) experiments were performed using a Micromass/Waters QqQ Quattro II mass spectrometer equipped with a Z-spray ionisation source. Polymer samples were dissolved in acetonitrile to obtain 0.2 mg mL−1 solution. LiI aqueous solution was added to afford a 1![[thin space (1/6-em)]](https://www.rsc.org/images/entities/char_2009.gif) :
:![[thin space (1/6-em)]](https://www.rsc.org/images/entities/char_2009.gif) 10 polymer
10 polymer![[thin space (1/6-em)]](https://www.rsc.org/images/entities/char_2009.gif) :
:![[thin space (1/6-em)]](https://www.rsc.org/images/entities/char_2009.gif) LiI molar ratio. Analyte solutions were introduced into the source at a 5 μL min−1 flow rate using a Harvard Apparatus type 22 syringe pump. The temperature of the source was set at 90 °C and the desolvation temperature at 120 °C. The electrospray voltages were set to the following values: probe (capillary) at 3.25 kV, sample cone at 70 V, and extraction cone at 30 V. The first hexapole was in RF-mode only with a 0.1 V amplitude for optimal ion transmission. The first quadrupolar analyser was used in average resolution mode with 12 as Low-Mass (LM) and High-Mass (HM) resolution, while for the second analyser 14 was used for both mass ranges. Multiplier detector voltage was set to its maximum value at 950 V. Throughout the complete set of measurements, vacuum was maintained at 4.5 × 10⁻⁵ mbar inside the instrument, while 2.8 × 10⁻³ mbar of Ar was introduced in the collision cell during MS/MS experiments. MS/MS spectra were recorded during 1 min for collision voltages in the range 0 to 60 V and 5 minutes for collision voltage in the range 60 to 100 V at a scan rate of 500 amu s−1. Since visual inspection of MS/MS spectra reveals only one fragment in the range 0–70 V, corresponding to the loss of N2 (−14 m/z shift) from the doubly charged linear parent ions, MS/MS spectra for mixtures were recorded on a 25 m/z mass range in order to improve the sensitivity. The ESI-MS/MS spectra were subsequently analyzed using the MassLynx software (Waters, UK). All MS/MS spectra were background subtracted (15% below curve), smoothed (Savitsky-Golay; 3 smooths) and centroided (top 80%; areas). The peak list is then transferred in the Excel software and used for the determination of the SY ratio.
LiI molar ratio. Analyte solutions were introduced into the source at a 5 μL min−1 flow rate using a Harvard Apparatus type 22 syringe pump. The temperature of the source was set at 90 °C and the desolvation temperature at 120 °C. The electrospray voltages were set to the following values: probe (capillary) at 3.25 kV, sample cone at 70 V, and extraction cone at 30 V. The first hexapole was in RF-mode only with a 0.1 V amplitude for optimal ion transmission. The first quadrupolar analyser was used in average resolution mode with 12 as Low-Mass (LM) and High-Mass (HM) resolution, while for the second analyser 14 was used for both mass ranges. Multiplier detector voltage was set to its maximum value at 950 V. Throughout the complete set of measurements, vacuum was maintained at 4.5 × 10⁻⁵ mbar inside the instrument, while 2.8 × 10⁻³ mbar of Ar was introduced in the collision cell during MS/MS experiments. MS/MS spectra were recorded during 1 min for collision voltages in the range 0 to 60 V and 5 minutes for collision voltage in the range 60 to 100 V at a scan rate of 500 amu s−1. Since visual inspection of MS/MS spectra reveals only one fragment in the range 0–70 V, corresponding to the loss of N2 (−14 m/z shift) from the doubly charged linear parent ions, MS/MS spectra for mixtures were recorded on a 25 m/z mass range in order to improve the sensitivity. The ESI-MS/MS spectra were subsequently analyzed using the MassLynx software (Waters, UK). All MS/MS spectra were background subtracted (15% below curve), smoothed (Savitsky-Golay; 3 smooths) and centroided (top 80%; areas). The peak list is then transferred in the Excel software and used for the determination of the SY ratio.
Synthetic procedures
Conclusions
In summary, a tandem mass spectrometry-based methodology was developed to determine the architectural purity of a cyclic polylactide sample prepared by copper-catalyzed alkyne-azide cycloaddition. Although usual polymer characterization techniques were unable to demonstrate the presence of a residual linear polymer, the proposed ESI-tandem mass spectrometry methodology allows detecting starting material traces (<5%) based on radically different collision-induced dissociation (CID) behaviours of topological isomers. Thanks to its ultra-high sensitivity, mass spectrometry is emerging as a predilection technique for the analysis and quantification of numerous isomeric pairs of macromolecules, particularly at the trace level. The authors hope this proof of concept will help in the evaluation and improvement of synthetic procedures. A detailed analysis of the performance (reproducibility, repeatability, sensitivity, etc.) of the proposed technique is currently under investigation within our laboratory.Acknowledgements
O. C., P. D. and P. G. thank the financial support from the Wallonia Region, the European Commission (FSE, FEDER), the National Fund for Scientific Research (F.R.S.-FNRS), and the Belgian Federal Science Policy Office (PAI 6/27). T. J. thanks F.R.I.A. for its financial support thesis Grant. O. C. is a Research Fellow of the F.R.S.-FNRS. A.M. thanks the University of Brest for BME financing T. J. stay in Brest and, the Région de Bretagne for granting the SAD project ProtMSMS. The authors would like also to thank Y. Lijour and A. Maroto for useful comments and suggestions.References
- (a) H. Nandivada, X. Jiang and J. Lahann, Adv. Mater., 2007, 19, 2197 CrossRef CAS; (b) W. H. Binder and R. Sachsenhofer, Macromol. Rapid Commun., 2008, 29, 952 CrossRef CAS; (c) C. Barner-Kowollik and A. J. Inglis, Macromol. Chem. Phys., 2009, 210, 987 CrossRef CAS.
- J. A. Opsteen and J. C. M. Van Hest, Chem. Commun., 2005, 57 RSC.
- O. Altintas, B. Yankul, G. Hizal and U. Tunca, J. Polym. Sci., Part A: Polym. Chem., 2006, 44, 6458 CrossRef CAS.
- O. Altintas, A. L. Demirel, G. Hizal and U. Tunca, J. Polym. Sci., Part A: Polym. Chem., 2008, 46, 5916 CrossRef CAS.
- S. Punna, J. Kuzelka, Q. Wang and M. G. Finn, Angew. Chem., Int. Ed., 2005, 44, 2215 CrossRef CAS PubMed.
- R. Kumar, A. El-Sagheer, J. Tumpane, P. Lincoln, L. M. Wilhelmsson and T. Brown, J. Am. Chem. Soc., 2007, 129, 6859 CrossRef CAS PubMed.
- (a) B. A. Laurent and S. M. Grayson, J. Am. Chem. Soc., 2006, 128, 4238 CrossRef CAS PubMed; (b) J. N. Hoskins and S. M. Grayson, Macromolecules, 2009, 42, 6406 CrossRef CAS.
- (a) M. Glassner, J. P. Blinco and C. Barner-Kowollik, Macromol. Rapid Commun., 2011, 32, 724 CrossRef CAS PubMed; (b) T. Josse, O. Altintas, K. K. Oehlenschlaeger, Ph. Dubois, P. Gerbaux, O. Coulembier and C. Barner-Kowollik, Chem. Commun., 2014, 50, 2024 RSC; (c) T. Mizawa, K. Takenaka and T. Shiomi, J. Polym. Sci., Part A: Polym. Chem., 2000, 38, 237 CrossRef CAS.
- M. J. Stanford, R. L. Pflughaupt and A. P. Dove, Macromolecules, 2010, 43, 6538 CrossRef CAS.
- L. Y. Qiu and Y. H. Bae, Pharm. Res., 2006, 23, 1 CrossRef CAS PubMed.
- G. Montaudo and R. P. Lattimer, Mass spectrometry of polymers, CRC Press, Boca Raton, 2002 Search PubMed.
- B. M. Trost, Science, 1991, 254, 1471–1477 CAS.
- J. N. Hoskins, S. Trimpin and S. M. Grayson, Macromolecules, 2011, 44, 6915 CrossRef CAS.
- A. M. Yol, D. E. Dabney, S.-F. Wang, B. A. Laurent, M. D. Foster, R. P. Quirk, S. M. Grayson and C. Wesdemiotis, J. Am. Soc. Mass Spectrom., 2013, 24, 74 CrossRef CAS PubMed.
- W. Hoffmann, J. Hofmann and K. Pagel, J. Am. Soc. Mass Spectrom., 2014, 25, 471 CrossRef CAS PubMed.
- A. Memboeuf, L. Jullien, R. Lartia, B. Brasme and Y. Gimbert, J. Am. Soc. Mass Spectrom., 2011, 22, 1744 CrossRef CAS PubMed.
- Y. Li, J. N. Hoskins, S. G. Sreerama and S. M. Grayson, Macromolecules, 2010, 43, 6225 CrossRef CAS PubMed.
- D. Geiser and H. Höcker, Macromolecules, 1980, 13, 653 CrossRef CAS.
- A. Caraculacu, E. C. Buruiana, G. Robila, T. Hjertberg and E. Sorvik, Makromol. Chem., Rapid Commun., 1982, 3, 323 CrossRef CAS.
- A. Memboeuf, A. Nasioudis, S. Indelicato, F. Pollreisz, A. kuki, S. Kéki, O. F. van den Brink, K. Vékey and L. Drahos, Anal. Chem., 2010, 82, 2294 CrossRef CAS PubMed.
- J. De Winter, V. Lemaur, Ph. Marsal, O. Coulembier, J. Cornil, Ph. Dubois and P. Gerbaux, J. Am. Soc. Mass Spectrom., 2010, 21, 1159 CrossRef CAS PubMed.
- J. Yang, Y. Wang, A. Rassat, Y. Zhang and P. Sinay, Tetrahedron, 2004, 60, 12163 CrossRef CAS PubMed.
- M. Malkoch, K. Schleider, E. Drockenmuller, C. J. Hawker, T. P. Russel, P. Wu and V. V. Fokin, Macromolecules, 2005, 38, 3663 CrossRef CAS.
Footnote |
| † Electronic supplementary information (ESI) available: Spectrometric data: ESI-MS spectra of 1 and 2; ESI-MS/MS spectra of 2. See DOI: 10.1039/c4py01087f |
| This journal is © The Royal Society of Chemistry 2015 |

