
 Open Access Article
 This Open Access Article is licensed under a
 Creative Commons Attribution 3.0 Unported Licence
Sialylation of lactosyl lipids in membrane microdomains by T. cruzi trans-sialidase†
Gavin T.
Noble
,
Faye L.
Craven
,
Maria Dolores
Segarra-Maset
,
Juana Elizabeth Reyes
Martínez
,
Robert
Šardzík
,
Sabine L.
Flitsch
* and
Simon J.
Webb
*
Manchester Institute of Biotechnology and School of Chemistry, The University of Manchester, 131 Princess Street, Manchester, M1 7DN, UK. E-mail: sabine.flitsch@manchester.ac.uk; S.Webb@manchester.ac.uk; Fax: +44(0)-161-306-5201; Tel: +44(0)-161-306-4524
First published on 25th September 2014
Abstract
A synthetic perfluoroalkyl-tagged lactosyl glycolipid has been shown to form lipid microdomains in fluid phospholipid bilayers. When embedded in the membranes of phospholipid vesicles, this glycolipid was trans-sialylated by soluble T. cruzi trans-sialidase (TcTS) to give a perfluoroalkyl-tagged glycolipid that displayed the ganglioside GM3 epitope, with up to 35% trans-sialylation from fetuin after 18 h. Following sialylation, vesicles bearing this Neu5Ac(α2-3)Gal(β1-4)Glc sequence in their “glycocalyx” were recognised and agglomerated by the lectin M. amurensis leukoagglutinin. Monitoring TcTS-mediated trans-sialylation by HPLC over the first 6 h revealed that enzymatic transformation of bilayer-embedded substrate was much slower than that of a soluble lactosyl substrate. Furthermore, clustering of the lactose-capped glycolipid into “acceptor” microdomains did not increase the rate of sialic acid transfer from fetuin by soluble TcTS, instead producing slight inhibition.
Introduction
Trypanosoma cruzi (T. cruzi) is a parasitic trypanosome endemic in Latin America that causes Chagas disease, a condition that results in cardiomyopathy and digestive megasyndromes at the chronic stage of infection.1 As part of the life-cycle of the parasite, the motile elongated trypomastigote form invades host cells via endocytosis, followed by conversion to a spherical amastigote form that reproduces by mitosis.2 Sialylation of T. cruzi mucins on the parasite surface is involved in the cell invasion process,3 and is required to help evade the early complement-mediated host immune response.4 However T. cruzi cannot synthesise sialic acid, and the source of parasite sialic acid was unknown until the discovery of the enzyme T. cruzi trans-sialidase (TcTS). This transglycosidase transfers sialic acid from host cell glycoconjugates,5 such as ganglioside GM3,6 to mucin glycans5,7 that are attached to the parasite surface via glycophosphatidyl inositol (GPI) anchors.8Structural studies of TcTS show several domains:9 an N-terminal catalytic domain, a globular domain believed to bind nerve growth factor receptor TrkA,10 and a C-terminal unfolded domain called the ‘shed acute phase antigen’. The catalytic domain of TcTS has a high specificity for Gal(β1-4)Glc (Lac) and Gal(β1-4)GlcNAc (LacNAc) sequences, catalysing the formation of Neu5Ac(α2-3)Gal(β1-4)Glc (or with GlcNAc in place of Glc).6b,11 This transfer reaction is reversible and the equilibrium position depends upon the relative concentrations of sialic acid “donors” and “acceptors”. The catalytic site of TcTS is a wide flexible cleft close to the protein surface12 that accommodates the sialyl donor and lactosyl acceptor sequentially. Sialic acid is transferred through a ping–pong mechanism,13 where binding of a sialyl residue is required before the β-galactoside interaction can occur.14 TcTS also has lectin-like capabilities, and there are natural variants that exhibit minimal enzymatic activity yet retain the ability to bind sialic acid.15 This lectin-like ability allows parasite displaying TcTS on its surface to bind to sialic acid on targeted cell surfaces (such as the host insect gut lining), which may aid the cell invasion process.16 Two forms of TcTS are utilised by T. cruzi; a membrane-bound form that is terminated with a glycosylphosphatidylinositol (GPI) anchor, and a secreted form that is produced through hydrolysis of this GPI link. This soluble TcTS is released into the extracellular space and bloodstream where it weakens the immune system by attacking the thymus, inducing apoptosis in thymocytes by sialylating the CD43 mucin on the surface of these cells.17
How substrate clustering on cell surfaces, as found in “lipid rafts”, affects reactivity with soluble enzymes is poorly understood. Glycosyltransferases are a class of enzyme of intense interest, for example in chemoenzymatic synthesis,18 that are also often available as soluble forms. Although multivalent displays of inhibitor are known to block both lectin binding and glycosyltransferase activity,19 glycoside transfer to multivalent displays of substrate on surfaces has been rarely quantified. We had previously observed that soluble β(1,4)-galactosyltransferase (β4GalT1) galactosylated GlcNAc-capped lipid 3 (Fig. 1) in substrate microdomains 9-fold faster than the same glycolipids dispersed across a phospholipid bilayer surface, an enhancement that was attributed to multivalent binding to a shallow, accessible and extended substrate cleft around the active site.20
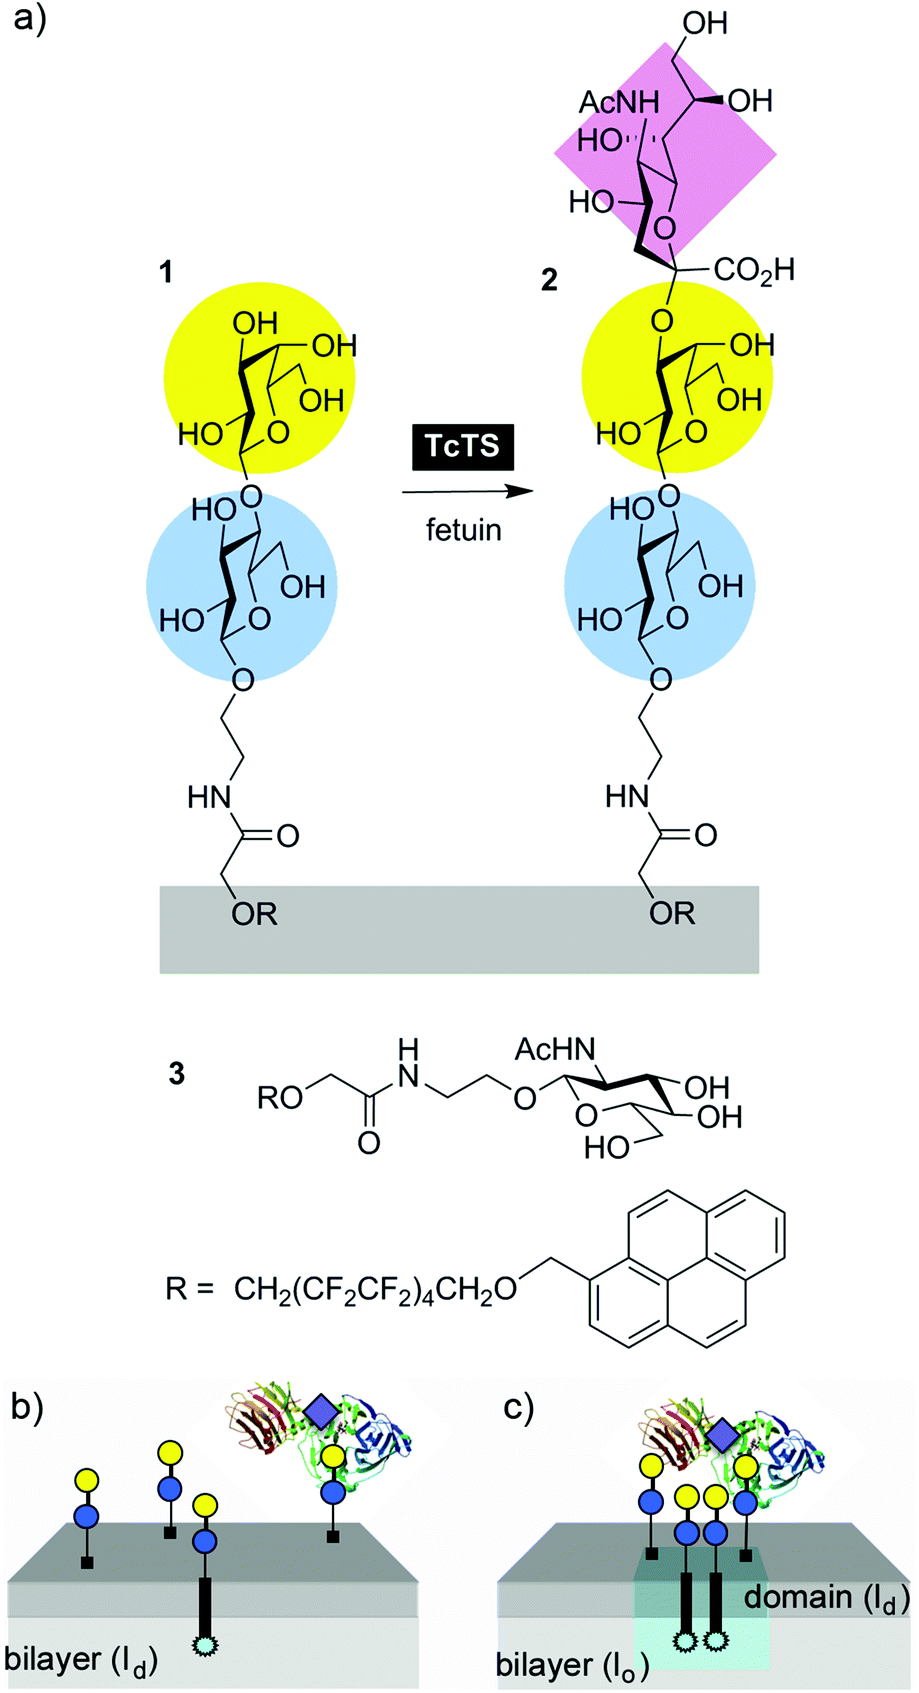 | ||
| Fig. 1 (a) A sialic acid residue is transferred to phase separating Lac lipid 1 from fetuin by TcTS, producing Neu5Ac(α2-3)Gal(β1-4)Glc capped lipid 2. GlcNAc lipid 3 is a phase-separating non-substrate comparison. (b) Lac lipid 1 is dispersed across the membrane in liquid disordered (ld) bilayers like dimyristoyl phosphatidylcholine (DMPC) at 37 °C but (c) phase separates to form lipid microdomains (pale blue pyrenyl excimer fluorescence) in liquid ordered (lo, DMPC–cholesterol) or solid ordered membranes (so, DPPC) at 37 °C. | ||
It was hoped that soluble TcTS, also with a shallow active site, should be able to access Lac or LacNAc on a bilayer surface. Furthermore, TcTS causes some of its biological effects by targeting substrate clusters in host cell membranes.21 High densities of saccharide epitopes, including sialic acid and galactose, are found in “lipid rafts”, cell surface domains that are crucial for cell signaling. These phase separated clusters of proteins, cholesterol and glycolipids22 in the fluid cell membrane matrix can accumulate GPI-anchored proteins and sialyl-capped lipids like gangliosides, making these sialic acid “donor” regions targets for both sialidases23 and trans-sialidases like TcTS.21 The converse, non-sialylated lipid rafts formed from potential “acceptors” like lactosylceramide, also have several important physiological roles24 including in neuroinflammatory disease,25H. pylori adhesion to gastrointestinal cells,26 and pathogen phagocytosis by neutrophils.27
We have developed a pyrene-perfluoroalkyl membrane anchor that can form functionalised fluid microdomains in bilayers that are in liquid ordered (lo) or solid ordered (so) states.28 Appending lactose onto this pyrene-perfluoroalkyl membrane anchor to create “acceptor” glycolipid 1 (Fig. 1) will provide two insights: how sialylation by TcTS is affected by (a) substrate insertion into a bilayer and (b) clustering within that bilayer. Successful sialylation will afford a lipid bearing the ganglioside GM3 epitope (Neu5Ac(α2-3)Gal(β1-4)Glc) in a process analogous to GM3 biosynthesis from lactosylceramide, and may provide phospholipid vesicles with a synthetic sialylated glycocalyx. Rates of reaction can be compared with our previous assays of soluble enzyme activity20 and may provide insight into how secreted TcTS might act on lactosylceramide rafts.
Herein we describe the synthesis of perfluoroalkyl-tagged lactose-lipid 1 (Fig. 1) and studies of the TcTS mediated transfer of sialic acid onto the lactose headgroup of 1. The effect of clustering lipid 1 into microdomains on the rate of sialic acid transfer by soluble TcTS was also assessed.
Results and discussion
Synthetic perfluoroalkyl-tagged glycolipids like 1 are readily available by coupling amine-terminated glycosides to acid-terminated membrane anchors (Scheme 1). | ||
| Scheme 1 Synthesis of lactose-capped lipid 1. | ||
The key acetyl-protected 2-aminoethyl lactoside 7 is available via both the azide and CBz protection routes.29 Conversion of lactose peracetate to the bromide allowed activation by metal salts using the Koenigs–Knorr method.30 Using silver carbonate as an activator gave numerous side-products, so the more reactive Hg(CN)2–HgBr2 mixture was used with CBz-protected ethanolamine. A reasonable yield of the CBz-protected lactose derivative was obtained with an α![[thin space (1/6-em)]](https://www.rsc.org/images/entities/char_2009.gif) :β anomeric ratio of 1:1.7. The required β-anomer 5 was recovered using column chromatography and then deprotected by hydrogenation to give 7. Similarly, employing 2-azidoethanol with Hg(CN)2–HgBr2 gave the azido-terminated lactose derivative, which could be hydrogenated to 7. Forming the amide linkage between the saccharide and lipid components was achieved using N,N′-dicyclohexylcarbodiimide (DCC) to form the N-hydroxysuccinimide (NHS) active ester. To avoid O- to N-acetyl transfer, acid activation was performed in parallel with hydrogenation, with the resulting amine immediately added to the activated NHS ester. The acetate protecting groups were then cleaved using Zemplén conditions31 to give lipid 1. Both the CBz and azido routes gave similar final yields (14% and 12% respectively from heptaacetylactosyl bromide).
:β anomeric ratio of 1:1.7. The required β-anomer 5 was recovered using column chromatography and then deprotected by hydrogenation to give 7. Similarly, employing 2-azidoethanol with Hg(CN)2–HgBr2 gave the azido-terminated lactose derivative, which could be hydrogenated to 7. Forming the amide linkage between the saccharide and lipid components was achieved using N,N′-dicyclohexylcarbodiimide (DCC) to form the N-hydroxysuccinimide (NHS) active ester. To avoid O- to N-acetyl transfer, acid activation was performed in parallel with hydrogenation, with the resulting amine immediately added to the activated NHS ester. The acetate protecting groups were then cleaved using Zemplén conditions31 to give lipid 1. Both the CBz and azido routes gave similar final yields (14% and 12% respectively from heptaacetylactosyl bromide).
Lipid microdomain formation by 1
The pyrenyl fluorophore in 1 has two functions: it allows the direct visualisation of 1 in vesicles by fluorescence microscopy and it forms excited dimers (excimers) at high local concentrations. The ratio of excimer (460 nm) to monomer (395 nm) fluorescence emission (the E/M ratio) is directly indicative of the local concentration of pyrene moieties and the rate of collision between them,32 so increases in the E/M ratio indicate the formation of microdomains containing 1. The E/M ratio also provides important information about the behaviour of lactose fluorolipid 1 in solution, such as the critical aggregation concentration (CAC), and in bilayers, like the exchange rate between outer and inner leaflets (“flip–flop”). To measure the CAC of 1, a suspension of 1 in pH 7.4 phosphate buffer (20 μM 1, 37 °C) was formed by sonication of a thin lipid film. A high E/M ratio of 20 ± 1 indicated aggregates were present at 20 μM, but serial dilution revealed a CAC of 49.5 nM. This value is ∼3-fold higher than similar glycolipids like GlcNAc-lipid 3, possibly due to increased aqueous solubility afforded by the additional sugar in the headgroup.Lactose fluorolipid 1 should mix with liquid disordered (ld) phase bilayers but phase separate from so and lo bilayers.28a Lipid 1 was incorporated into large unilamellar phospholipid vesicles (LUVs, 800 nm diameter) with three different compositions: dimyristoyl phosphatidylcholine only (DMPC); dipalmitoyl phosphatidylcholine (DPPC); a 1:1 mix of DMPC and cholesterol (DMPC–chol). These compositions were chosen because at 37 °C these bilayers are in fluid ld, so and lo phases respectively. Vesicles were formed via extrusion of a buffered aqueous suspension of lipid 1 and the appropriate phospholipid mixture through 800 nm polycarbonate membranes above the bilayer melting temperature (Tm). As previously for GlcNAc-lipid 3,20 the maximum incorporation of 1 in each bilayer composition was determined using UV-visible spectroscopy, and was found to be 9.5% mol mol−11 in DMPC, 8.7% mol mol−11 in DPPC and 8.5% mol mol−11 in DMPC–chol.
The fluorescence emission spectra of these LUV suspensions were recorded at 37 °C. As expected, Lac-lipid 1 exhibited little phase separation in DMPC membranes at a low 1% mol mol−1 loading (E/M = 0.14) but phase-separated from DMPC–chol and DPPC (E/M = 1.3 and 1.0 respectively). At the maximum loading in DMPC (9.5% mol mol−1), Lac-lipid 1 had a higher E/M of 0.80 ± 0.15 due to the higher rate of interpyrene collision at this 10-fold higher loading. The maximum loadings in DMPC–chol (8.5% mol mol−1) and DPPC (8.7% mol mol−1) both showed extensive clustering of Lac-lipid 1 (E/M = 3.9 ± 0.2 and 3.0 ± 0.4 respectively). As for 3,20 giant unilamellar vesicles (GUVs) were then used to directly visualise microdomains of Lac-lipid 1. At ∼9% mol mol−1 loading, microdomains were observed in GUVs composed of either DMPC–chol or DPPC, but only weak uniformly distributed excimer emission could be observed in DMPC, in good agreement with the E/M values measured in LUVs (Fig. 2).
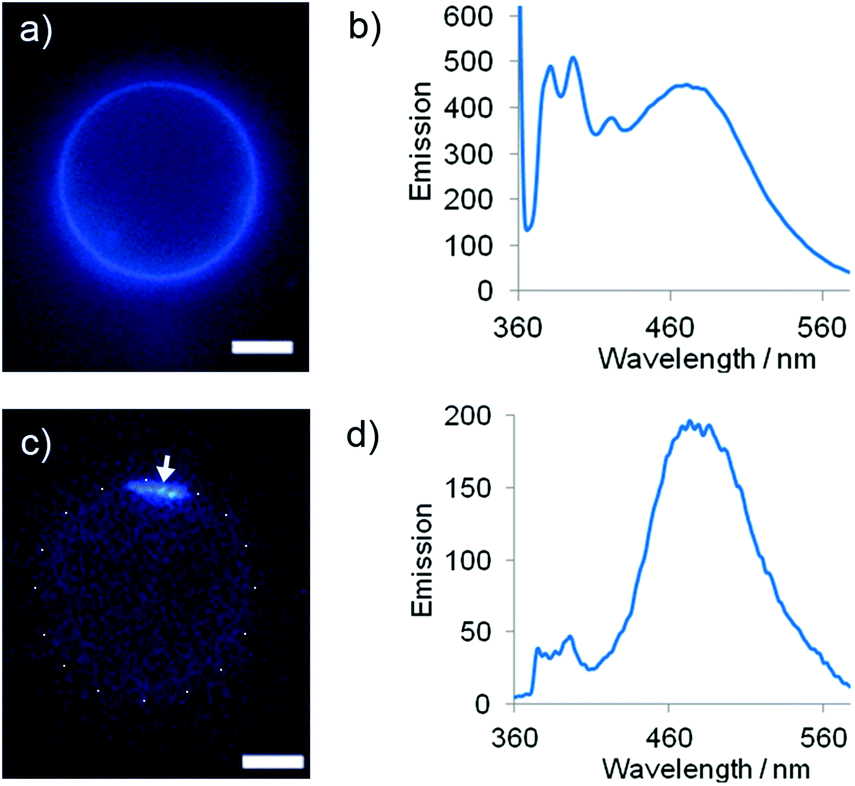 | ||
| Fig. 2 (a) Epi-fluorescence microscopy image of a DMPC GUV with 9.5% mol mol−11. (b) Fluorescence emission spectrum from DMPC LUVs with 9.5% mol mol−11. (c) Epi-fluorescence microscopy image of a DPPC GUV with 8.7% mol mol−11, arrow indicates microdomain, white dots show GUV outline. (d) Fluorescence emission spectrum from DPPC LUVs with 8.7% mol mol−11. Scale bars 40 μm. | ||
To contextualise rates of enzymatic transformation, the flip–flop rate for 1 was estimated. Following previous methodology,20 Lac-lipid 1 was added to blank LUVs composed of DMPC, DMPC–chol or DPPC to give a loading of 1% mol mol−1. Immediately after addition, the E/M ratio dropped from 20 (buffer) to 0.5 in DMPC, 1.5 in DMPC–chol and 1.3 in DPPC as the lipids inserted into the bilayers. A subsequent slower decline in E/M provided the outer-to-inner leaflet flip–flop half-lives, which were approximately t½ = 1.5 h in DMPC, t½ = 7 h in DMPC–chol and t½ = 5 h in DPPC. These half-lives indicate slower flip–flop through ordered bilayers and also show that flip–flop takes longer for 1 than for GlcNAc-lipid 3 (t½ = 1 h in DMPC and 4 h in DMPC–chol),20 possibly due to the extra hydrophilic saccharide unit prohibiting transit through the hydrophobic core of the bilayer. These flip–flop half-lives indicate that over short periods (<1 h) only the outer leaflet of 1 is available to the enzyme, but near complete sialylation should be possible after overnight incubation.
Enzymatic modification of Lac-lipid 1 embedded in vesicles
The transformation of 1 into 2 by TcTS/fetuin at 37 °C was assayed by HPLC and MS using procedures developed previously.20 LUVs (800 nm diameter) composed of DMPC, DMPC–chol and DPPC containing a target loading of ∼9% mol mol−1 Lac-lipid 1 (200 μM 1) were synthesised by extrusion. The maximum loading of 1 in the vesicle membranes was employed, as preliminary experiments had indicated that at 1% mol mol−1 loadings the amount of product formed was too small to be accurately measured (1% mol mol−1 corresponds to 20 μM 1 in the buffer volume). The vesicle suspensions (100 μL, ∼0.18 mM 1) were then incubated with fetuin and TcTS for 18 h. Two reagent concentrations were assessed: either 10 mg mL−1 fetuin (equivalent to 1.25 mM sialic acid33) with ∼39 nM TcTS, or 50 mg mL−1 fetuin (equivalent to 6.3 mM sialic acid) with ∼195 nM TcTS. The vesicles were stable under the reaction conditions, which was aided by the lack of any co-solvent or surfactant in the enzyme buffer. In both cases there was an excess of sialic acid available for transfer from fetuin.After overnight incubation with 10 mg mL−1 fetuin and ∼39 nM TcTS, both MALDI-ToF/ToF MS and HPLC indicated partial sialylation of Lac-lipid 1. MALDI-ToF/ToF MS analysis showed a small peak at m/z 1438 that corresponded to the di-sodium sialylated product. The low intensity of the peak suggested poor conversion – peak height comparison gave 7–9% conversion after overnight reaction – but concerns about product decomposition under MS conditions complicated the analysis.34 HPLC and LC/MS proved to be better analytical methods, with good resolution of two pyrene-containing peaks. Sialylation produced the more hydrophilic lipid 2 with a retention time of ∼14 min, compared to ∼17 min for the starting Lac-lipid 1 (Fig. 3a). Using a standard HPLC method,20 the fraction of 1 converted to 2 was determined from the peak areas of the starting lipid 1 and sialylated product 2, revealing low levels of sialylation (∼8%) that agreed with the values from the MALDI-ToF mass spectra. However, increasing the amount of fetuin and TcTS five-fold gave a 3- to 4-fold increase in sialylation to 20–35% (Fig. 3a and b), clearly showing that TcTS can transform membrane-bound lactosyl-lipids into sialyl-terminated trisaccharide glycolipids in situ. Although a larger excess of fetuin may have driven the reaction further towards product 2, these assays show that Lac-lipid 1 is a competent substrate for TcTS despite its highly unnatural structure.
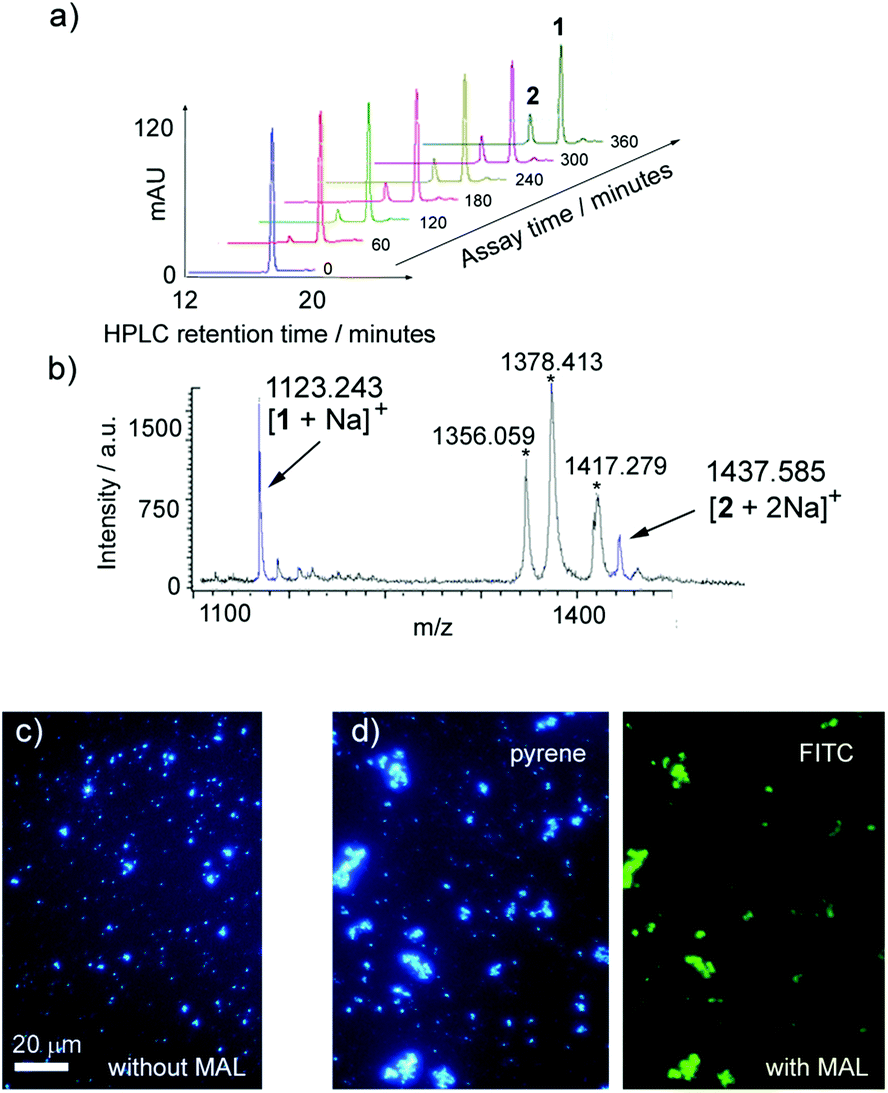 | ||
| Fig. 3 (a, b) Conversion of 1 in DMPC vesicles (9.5% mol mol−1) to 2 after fetuin/TcTS treatment (50 mg mL−1 and 195 nM): (a) HPLC traces (abs. at 346 nm). (b) Partial MALDI-ToF/ToF MS spectrum. Product peaks in blue are [1 + Na]+ (m/z 1123) and [2 + 2Na]+ (m/z 1438). Phospholipid peaks (*) are [2DMPC + H]+ (m/z 1356), [2DMPC + Na]+ (m/z 1378) and [2DMPC + Na + K]+ (m/z 1417). (c, d) Epi-fluorescence micrographs of DMPC LUVs (800 nm) with 9.5% mol mol−11 after fetuin/TcTS treatment (50 mg mL−1 and 195 nM): (c) dispersed vesicles in the absence of fluorescein labelled Maackia amurensis leukoagglutinin (FITC-MAL) (d) agglutinated vesicles after FITC-MAL addition, showing pyrenyl (left) and fluorescein (right) emission. Scale bar 20 μm. | ||
The sialylation of 1 was verified using lectin-mediated vesicle agglutination. The legume Maackia amurensis produces the well-studied lectin M. amurensis leukoagglutinin (MAL), which is known to selectively bind sialic acid terminated oligosaccharides with an α(2-3) glycosidic linkage to galactose.35 Fluorescein labelled MAL (FITC-MAL) was used to confirm enzymatic sialylation of 1 in vesicles. MAL should selectively bind to the enzymatically sialylated product 2 but not 1, and as an agglutinin with multiple sialic acid binding sites (K ∼ 1.1 × 10⁶ M−1 for α(2,3)-sialyl LacNAc35a), vesicle aggregation would be expected if enzymatic sialylation had occurred. No aggregation was observed in the presence of FITC-MAL (20 μg mL−1) for DMPC vesicles bearing 9.5% 1 in their membrane (Fig. 3c). However after vesicle incubation with TcTS and fetuin as described above (18 h), the addition of FITC-MAL produced large aggregates, with fluorescence microscopy showing co-localisation of FITC and pyrene fluorescence (Fig. 3d). Aggregation by FITC-MAL shows these sialylated vesicles now expose the Neu5Ac(α2-3)Gal(β1-4)Glc recognition epitope in their artificial “glycocalyx”.
Interestingly, after 18 h the extent of Lac-lipid 1 sialylation differed little between the vesicle compositions (DMPC, DMPC–chol or DPPC). At 1 mg of fetuin and 39 nM TcTS, conversions were 8.5% (DMPC), 7.4% (DMPC–chol) and 7.6% (DPPC), rising to 35% (DMPC), 21% (DMPC–chol) and 30% (DMPC–chol) if 5 mg of fetuin and 195 nM TcTS were employed. With the proviso that after 18 h these reactions may be approaching equilibrium, these observations suggested that TcTS was not sensitive to substrate clustering, with the dispersed lipid (1 in DMPC) giving slightly higher conversions than the lipid 1 in microdomains (1 in DMPC–chol or DPPC).
Quantifying the effect of glycolipid domain formation on enzyme activity
To assess the initial rate of sialylation by TcTS, the time course for the conversion of 1 into 2 was monitored. The addition of 50 mg mL−1 fetuin (equivalent to 6.3 mM sialic acid) and 195 nM TcTS gave the highest total conversions after 18 h, so these conditions were employed to study the rate of production of 2 over the first 7 h (Fig. 4), which largely involves reaction of 1 in the outer leaflet of the bilayer.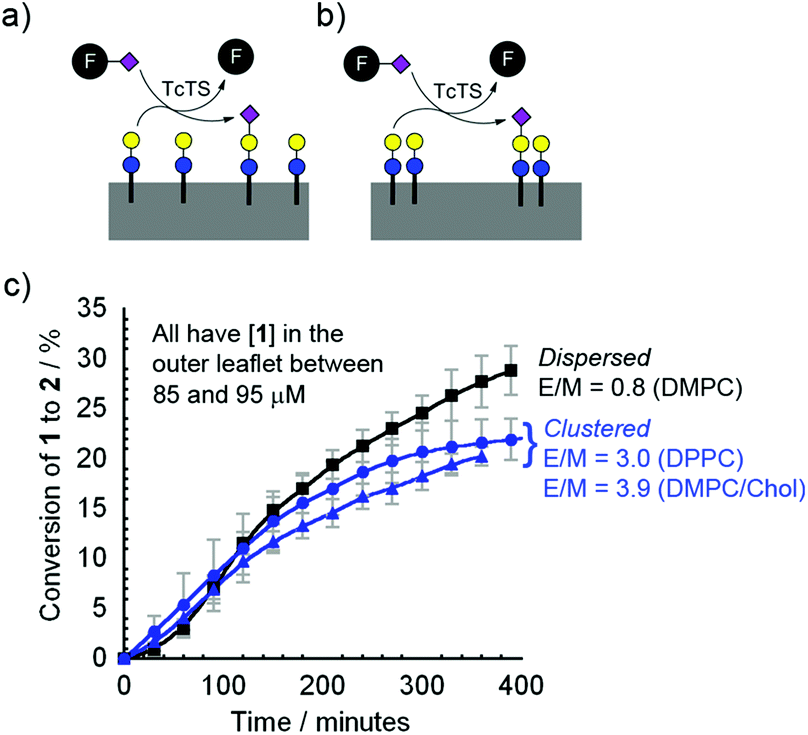 | ||
Fig. 4 (a, b) Schemes showing the conversion of vesicle-bound 1 to 2 by TcTS and fetuin (F) when 1 is (a) dispersed or (b) clustered. (c) Rate of conversion of vesicle-bound 1 to 2 by TcTS/fetuin (195 nM and 50 mg mL−1): 9.5% mol mol−11 in DMPC vesicles (■); 8.7% mol mol−11 in DPPC ( ); 8.5% mol mol−11 in DMPC–chol ( ); 8.5% mol mol−11 in DMPC–chol ( ). The extent of clustering is indicated by the E/M values at 37 °C in each case. Curve fits are to guide the eye, standard error bars are shown. ). The extent of clustering is indicated by the E/M values at 37 °C in each case. Curve fits are to guide the eye, standard error bars are shown. | ||
The HPLC data clearly showed that, unlike the transformation of GlcNac fluorolipid 3 into a Gal-GlcNAc fluorolipid by β4GalT1/UDP-Gal, the rate of transformation of 1 into 2 by TcTS/fetuin in any of the membrane compositions DMPC, DMPC–chol or DPPC was similar, with slight inhibition observed under these conditions when lipid 1 was in microdomains. This is despite the clear difference in the extent of clustering of 1 in each of these membrane compositions, as indicated by the E/M values and fluorescence microscopy. In all cases the reaction rate at the membrane was much slower than in solution, with the reaction of benzyl lactose under the same conditions complete within 1 h. Using fluorogenic substrate 4-methyl-umbelliferyl-N-acetylneuraminic acid (MUNANA) as the sialic acid donor revealed that MUNANA hydrolysis was ∼34-fold faster than formation of 2 over the first 3 h (see ESI†), confirming the low reactivity of bilayer-embedded 1 with TcTS.
Reported structural and kinetic studies of TcTS allow its reactivity with phase separated 1 to be rationalised. The active site of TcTS (Fig. 5) is a long shallow cleft that forms when a sialic acid “donor” is present. However, oligo(galactose) substrates do not appear to form multivalent interactions with this long cleft, as TcTS does not demonstrate higher activity with Lac-terminated oligosaccharides than with lactose itself.11 Several literature studies instead report that close proximity between Gal sites prevents full sialylation.36 TcTS-mediated sialic acid transfer to T. cruzi mucin-derived glycoconjugates showed that if two Gal sites are present in branched tri- and tetrasaccharides, then the first sialic acid transfer inhibits a second.37 These studies were supported by TcTS assays on synthetic glycopeptide fragments of T. cruzi mucins;38,39e.g. a synthetic pentasaccharide with terminal β-D-Galp residues was selectively monosialylated at the least hindered site.40,41 Our observations also suggest that crowding of Lac headgroups, in this case in microdomains, may inhibit the initial activity of TcTS. The diminished reactivity of TcTS with “acceptor” lactosyl microdomains implies that transfer of sialic acid to lactosyl rich regions, like lactosylceramide lipid rafts,27 may not be favoured. It also contrasts with enhanced interactions reported between TcTS and sialic acid “donor” lipid rafts within a biological context.21
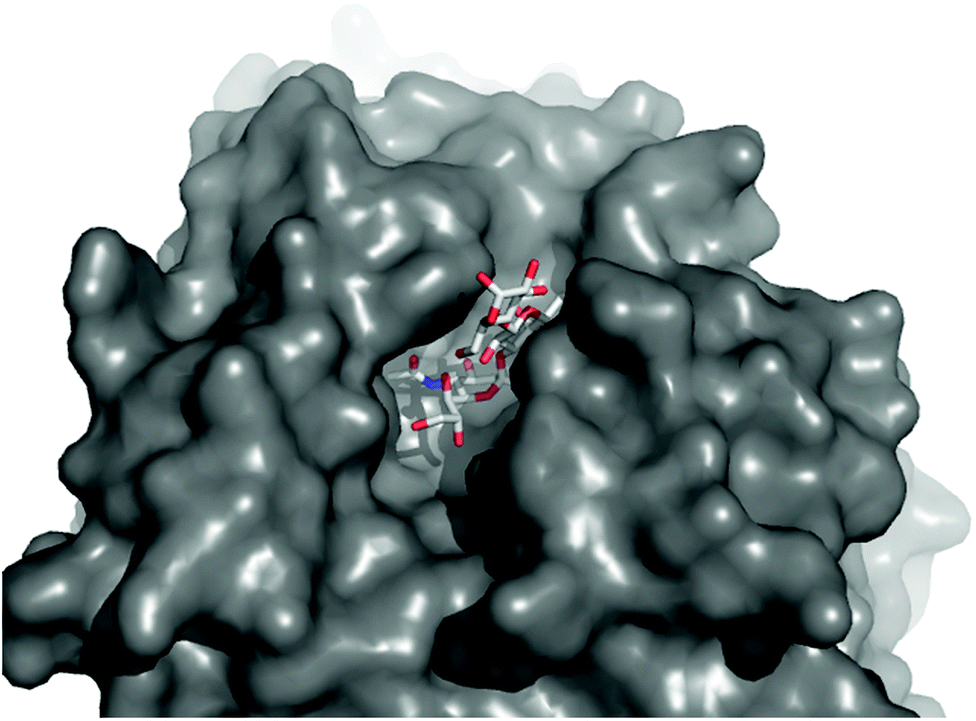 | ||
| Fig. 5 Top view of the oligosaccharide binding pocket in the Neu5Ac(α2-3)Gal(β1-4)Glc/TcTS complex, showing filling of the binding pocket donor and acceptor sites by Neu5Ac(α2-3)Gal(β1-4)Glc. Structure from PDB ID: 1S0I.12 | ||
Unlike β4GalT1, secondary interactions of TcTS with “acceptor” substrate rich surfaces do not seem to be significant enough to enhance enzymatic activity. This difference suggests that enzyme structure could be a key factor that determines if substrate clustering in microdomains enhances the initial rate of enzymatic transformations. However other factors could also play a role. For example, during later periods of TcTS activity, when a significant amount of lipid 2 has been produced, the sialylated product could also be a donor substrate for TcTS. A decrease in the net rate of production of 2 might result, which may be more pronounced when both 1 and 2 are in close proximity within microdomains.
Conclusions
TcTS has been shown to successfully catalyse sialic acid transfer onto the headgroup of synthetic lactosyl-capped fluorolipid 1, creating a phase-separating glycolipid that displayed the GM3 epitope. This transfer was carried out on membrane-embedded 1, producing sialylated phospholipid vesicles that were recognised by the lectin Maackia amurensis leukoagglutinin. Unlike related studies using soluble β4GalT1, glycolipid clustering in the bilayer did not increase the rate of reaction with soluble TcTS, but instead produced slight inhibition.The use of vesicles as a medium for biocatalytic syntheses can offer advantages over organic solvents when coupling lipophilic and hydrophilic substrates.42 The liposomal products from chemoenzymatic transformations can also have biotechnological applications, for example chemoenzymatically sialylated liposomes may target cells overexpressing Siglecs43 or be masked from the immune response.4,44 Furthermore, using TcTS in conjunction with β4GalT1 could mimic the biosynthesis of GM3 from glycosylceramide in vivo,45 and investigations into the use of chemoenzymatic cascades are ongoing.
Acknowledgements
We thank Prof. A. C. C. Frasch, Universidad Nacional General San Martín, Argentina, for kindly providing the TcTS clone. J.E.R.M. thanks CONACyT-México for funding (scholarship reference 214433/309655). F.C. and G.T.N. thank the BBSRC for providing studentship funding.Notes and references
- (a) J. R. Coura and J. Borges-Pereira, Acta Trop., 2010, 115, 5–13 CrossRef PubMed; (b) A. Rassi Jr., A. Rassi and J. A. Marin-Neto, Lancet, 2010, 375, 1388–1402 CrossRef.
- K. M. Tyler and D. M. Engman, Int. J. Parasitol., 2001, 31, 472–480 CrossRef CAS.
- (a) S. Schenkman and D. Eichinger, Parasitol. Today, 1993, 9, 218–225 CrossRef CAS; (b) M. E. Giorgi and R. M. de Lederkremer, Carbohydr. Res., 2011, 346, 1389–1393 CrossRef PubMed.
- S. Tomlinson and J. Raper, Parasitol. Today, 1998, 14, 354–359 CrossRef CAS.
- G. A. M. Cross and G. B. Takle, Annu. Rev. Microbiol., 1993, 47, 385–411 CrossRef CAS PubMed.
- (a) M. A. Ferrero-García, S. E. Trombetta, D. O. Sánchez, A. Reglero, A. C. C. Frasch and A. J. Parodi, Eur. J. Biochem., 1993, 213, 765–771 CrossRef PubMed; (b) F. Vandekerckhove, S. Schenkman, L. P. d. Carvalho, S. Tomlinson, M. Kiso, M. Yoshida, A. Hasegawa and V. Nussenzweig, Glycobiology, 1992, 2, 541–548 CrossRef CAS PubMed.
- (a) R. M. van Well, B. Y. M. Collet and R. A. Field, Synlett, 2008, 2175–2177 CAS; (b) S. Schenkman, M.-S. Jiang, G. W. Hart and V. Nussenzweig, Cell, 1991, 65, 1117–1125 CrossRef CAS.
- M. A. J. Ferguson, J. S. Brimacombe, S. Cottaz, R. A. Field, L. S. Guther, S. W. Homans, M. J. McConville, A. Mehlert, K. G. Milne, J. E. Ralton, Y. A. Roy, P. Schneider and N. Zitzmann, Parasitology, 1994, 108, S45–S54 CrossRef.
- A. Buschiazzo, M. F. Amaya, M. L. Cremona, A. C. Frasch and P. M. Alzari, Mol. Cell, 2002, 10, 757–768 CrossRef CAS.
- M. V. Chuenkova and M. PereiraPerrin, Biochemistry, 2005, 44, 15685–15694 CrossRef CAS PubMed.
- R. Agustí, M. E. Giorgi, V. M. Mendoza, C. Gallo-Rodriguez and R. M. de Lederkremer, Bioorg. Med. Chem., 2007, 15, 2611–2616 CrossRef PubMed.
- M. F. Amaya, A. G. Watts, I. Damager, A. Wehenkel, T. Nguyen, A. Buschiazzo, G. Paris, A. C. Frasch, S. G. Withers and P. M. Alzari, Structure, 2004, 12, 775–784 CrossRef CAS PubMed.
- A. G. Watts, I. Damager, M. F. Amaya, A. Buschiazzo, P. M. Alzari, A. C. Frasch and S. G. Withers, J. Am. Chem. Soc., 2003, 125, 7532–7533 CrossRef CAS PubMed.
- A. R. Todeschini, W. B. Dias, M. F. Girard, J.-M. Wieruszeski, L. Mendonça-Previato and J. O. Previato, J. Biol. Chem., 2004, 279, 5323–5328 CrossRef CAS PubMed.
- (a) H. Uemura, S. Schenkman, V. Nussenzweig and D. Eichinger, EMBO J., 1992, 11, 3837–3844 CAS; (b) A. R. Todeschini, M. F. Girard, J.-M. Wieruszeski, M. P. Nunes, G. A. DosReis, L. Mendonça-Previato and J. O. Previato, J. Biol. Chem., 2002, 277, 45962–45968 CrossRef CAS PubMed.
- S. S. C. dC-Rubin and S. Schenkman, Cell. Microbiol., 2012, 14, 1522–1530 CrossRef CAS PubMed.
- (a) S. Schenkman, L. Pontes de Carvalho and V. Nussenzweig, J. Exp. Med., 1992, 175, 567–575 CrossRef CAS; (b) J. Mucci, M. G. Risso, M. Susana Leguizamón, A. C. C. Frasch and O. Campetella, Cell. Microbiol., 2006, 8, 1086–1095 CrossRef CAS PubMed; (c) A. F. F. R. Nardy, J. L. da Silva Filho, A. R. Pérez, J. de Meis, D. A. Farias-de-Oliveira, L. Penha, I. de Araújo Oliveira, W. B. Dias, A. R. Todeschini, C. G. Freire-de-Lima, M. Bellio, C. Caruso-Neves, A. A. Pinheiro, C. M. Takiya, O. Bottasso, W. Savino and A. Morrot, Microbes Infect., 2013, 15, 365–374 CrossRef CAS PubMed.
- (a) L.-X. Wang and B. G. Davis, Chem. Sci., 2013, 4, 3381–3394 RSC; (b) Z. Wang, Z. S. Chinoy, S. G. Ambre, W. Peng, R. McBride, R. P. de Vries, J. Glushka, J. C. Paulson and G.-J. Boons, Science, 2013, 341, 379–383 CrossRef CAS PubMed; (c) A. Larkin, M. M. Chang, G. Whitworth and B. Imperiali, Nat. Chem. Biol., 2013, 9, 367–373 CrossRef CAS PubMed; (d) C. D. Brown, M. S. Rusek and L. L. Kiessling, J. Am. Chem. Soc., 2012, 134, 6552–6555 CrossRef CAS PubMed; (e) R. T. Gale, E. W. Sewell, T. A. Garrett and E. D. Brown, Chem. Sci., 2014, 5, 3823–3830 RSC.
- (a) M. Hartmann and T. K. Lindhorst, Eur. J. Org. Chem., 2011, 3583–3609 CrossRef CAS; (b) M. Durka, K. Buffet, J. Iehl, J.-F. Nierengarten and S. P. Vincent, Chem. – Eur. J., 2012, 18, 641–651 CrossRef CAS PubMed.
- G. T. Noble, F. L. Craven, J. Voglmeir, R. Šardzík, S. L. Flitsch and S. J. Webb, J. Am. Chem. Soc., 2012, 134, 13010–13017 CrossRef CAS PubMed.
- C. E. Butler, T. M. U. de Carvalho, E. C. Grisard, R. A. Field and K. M. Tyler, Traffic, 2013, 14, 853–869 CrossRef CAS PubMed.
- M. G. Paulick and C. R. Bertozzi, Biochemistry, 2008, 47, 6991–7000 CrossRef CAS PubMed.
- G. P. Leser and R. A. Lamb, Virology, 2005, 342, 215–227 CrossRef CAS PubMed.
- C. A. Lingwood, Cold Spring Harbor Perspect. Biol., 2011, 3, a004788 Search PubMed.
- J.-S. Won, A. K. Singh and I. Singh, J. Neurochem., 2007, 103, 180–191 CrossRef CAS PubMed.
- J. Fantini, N. Garmy and N. Yahi, Biochemistry, 2006, 45, 10957–10962 CrossRef CAS PubMed.
- K. Iwabuchi, H. Nakayama, C. Iwahara and K. Takamori, FEBS Lett., 2010, 584, 1642–1652 CrossRef CAS PubMed.
- (a) S. J. Webb, K. Greenaway, M. Bayati and L. Trembleau, Org. Biomol. Chem., 2006, 4, 2399–2407 RSC; (b) R. J. Mart, K. P. Liem, X. Wang and S. J. Webb, J. Am. Chem. Soc., 2006, 128, 14462–14463 CrossRef CAS PubMed; (c) G. T. Noble, K. P. Liem, S. L. Flitsch and S. J. Webb, Org. Biomol. Chem., 2009, 7, 5245–5254 RSC; (d) K. P. Liem, G. T. Noble, S. L. Flitsch and S. J. Webb, Faraday Discuss., 2010, 145, 219–233 RSC; (e) S. J. Webb, Acc. Chem. Res., 2013, 46, 2878–2887 CrossRef CAS PubMed.
- R. Šardzík, G. T. Noble, M. J. Weissenborn, A. Martin, S. J. Webb and S. L. Flitsch, Beilstein J. Org. Chem., 2010, 6, 699–703 CrossRef PubMed.
- W. Koenigs and E. Knorr, Ber. Dtsch. Chem. Ges., 1901, 34, 957–981 CrossRef.
- G. Zemplén and E. Pacsu, Chem. Ber., 1929, 62, 1613–1614 CrossRef.
- H. J. Galla and E. Sackmann, J. Am. Chem. Soc., 1975, 97, 4114–4120 CrossRef CAS.
- Lee et al. estimated that 126 nmol sialic acid is available per mg of fetuin, corresponding to around 75% of total sialic acid on the protein. See: S.-G. Lee, D.-H. Shin and B.-G. Kim, Enzyme Microb. Technol., 2002, 31, 742–746 CrossRef CAS.
- R. Šardzík, R. Sharma, S. Kaloo, J. Voglmeir, P. R. Crocker and S. L. Flitsch, Chem. Commun., 2011, 47, 5425–5427 RSC.
- (a) K. Yamamoto, Y. Konami and T. Irimura, J. Biochem., 1997, 121, 756–761 CrossRef CAS; (b) C. Geisler and D. L. Jarvis, Glycobiology, 2011, 21, 988–993 CrossRef CAS PubMed.
- However cyclic [β-D-Galp-triazole] dimers and trimers were completely sialylated by TcTS and MUNANA. See: V. L. Campo, I. Carvalho, C. H. T. P. Da Silva, S. Schenkman, L. Hill, S. A. Nepogodiev and R. A. Field, Chem. Sci., 2010, 1, 507–514 RSC.
- J. O. Previato, C. Jones, M. T. Xavier, R. Wait, L. R. Travassos, A. J. Parodi and L. Mendonça-Previato, J. Biol. Chem., 1995, 270, 7241–7250 CrossRef CAS PubMed.
- (a) J. A. Harrison, K. P. Ravindranathan Kartha, E. J. L. Fournier, T. L. Lowary, C. Malet, U. J. Nilsson, O. Hindsgaul, S. Schenkman, J. H. Naismith and R. A. Field, Org. Biomol. Chem., 2011, 9, 1653–1660 RSC; (b) V. Leiria Campo, I. Carvalho, S. Allman, B. G. Davis and R. A. Field, Org. Biomol. Chem., 2007, 5, 2645–2657 RSC; (c) R. Agusti, M. E. Giorgi, V. M. Mendoza, C. Gallo-Rodriguez and R. M. de Lederkremer, Bioorg. Med. Chem., 2007, 15, 2611–2616 CrossRef CAS PubMed.
- S. Singh, M. Scigelova, M. Lilja Hallberg, O. W. Howarth, S. Schenkman and D. H. G. Crout, Chem. Commun., 2000, 1013–1014 RSC.
- V. M. Mendoza, R. Agusti, C. Gallo-Rodriguez and R. M. de Lederkremer, Carbohydr. Res., 2006, 341, 1488–1497 CrossRef CAS PubMed.
- R. Agusti, V. M. Mendoza, C. Gallo-Rodriguez and R. M. de Lederkremer, Tetrahedron: Asymmetry, 2005, 16, 541–551 CrossRef CAS PubMed.
- M. P. Christie, P. Simerska, F. E.-C. Jen, M. P. Jennings and I. Toth, ChemPlusChem, 2013, 78, 793–796 CrossRef CAS.
- P. R. Crocker, Curr. Opin. Struct. Biol., 2002, 12, 609–615 CrossRef CAS.
- (a) V. P. Torchilin, Nat. Rev. Drug Discovery, 2005, 4, 145–160 CrossRef CAS PubMed; (b) J. E. Hudak, S. M. Canham and C. R. Bertozzi, Nat. Chem. Biol., 2013, 10, 69–75 CrossRef PubMed.
- T. Wennekes, R. J. B. H. N. van den Berg, R. G. Boot, G. A. van der Marel, H. S. Overkleeft and J. M. F. G. Aerts, Angew. Chem., Int. Ed., 2009, 48, 8848–8869 CrossRef CAS PubMed.
Footnote |
| † Electronic supplementary information (ESI) available: Experimental details; spectra and CACs of novel lipids; measurements of E/M ratios and flip–flop rates; conditions and representative HPLC traces for enzymatic reactions. See DOI: 10.1039/c4ob01852d |
| This journal is © The Royal Society of Chemistry 2014 |