Unique temporal and spatial biomolecular emission profile on individual zinc oxide nanorods†
Manpreet
Singh
,
Sheng
Song
and
Jong-in
Hahm
*
Department of Chemistry, Georgetown University, 37th & O Sts. NW., Washington, DC 20057, USA
First published on 16th October 2013
Abstract
Zinc oxide nanorods (ZnO NRs) have emerged in recent years as extremely useful, optical signal-enhancing platforms in DNA and protein detection. Although the use of ZnO NRs in biodetection has been demonstrated so far in systems involving many ZnO NRs per detection element, their future applications will likely take place in a miniaturized setting while exploiting single ZnO NRs in a low-volume, high-throughput bioanalysis. In this paper, we investigate temporal and spatial characteristics of the biomolecular fluorescence on individual ZnO NR systems. Quantitative and qualitative examinations of the biomolecular intensity and photostability are carried out as a function of two important criteria, the time and position along the long axis (length) of NRs. Photostability profiles are also measured with respect to the position on NRs and compared to those characteristics of biomolecules on polymeric control platforms. Unlike the uniformly distributed signal observed on the control platforms, both the fluorescence intensity and photostability are position-dependent on individual ZnO NRs. We have identified a unique phenomenon of highly localized, fluorescence intensification on the nanorod ends (FINE) of well-characterized, individual ZnO nanostructures. When compared to the polymeric controls, the biomolecular fluorescence intensity and photostability are determined to be higher on individual ZnO NRs regardless of the position on NRs. We have also carried out finite-difference time-domain simulations the results of which are in good agreement with the observed FINE. The outcomes of our investigation will offer a much needed basis for signal interpretation for biodetection devices and platforms consisting of single ZnO NRs and, at the same time, contribute significantly to provide insight in understanding the biomolecular fluorescence observed from ZnO NR ensemble-based systems.
Introduction
One-dimensional (1D) zinc oxide structures have been recently demonstrated as highly effective optical platforms for ultratrace-level biomolecular detection for a variety of fluorophores that are commonly used in biomedical assays.1–7 As fluorescence is widely used in basic biology and applied biomedical research, its impact in biodetection will continue to grow. In the majority of these applications so far, densely grown periodic arrays of zinc oxide nanorods (ZnO NRs) served as signal enhancing platforms. In this ensemble configuration, a group of vertically grown ZnO NRs formed each detectable spot in an array, and NRs within a spot collectively contributed to the optical signal enhancement produced by fluorophore-conjugated biomolecules.1–7 However, the size of many biomedical detection devices is becoming smaller and smaller at an increasing rate as the need for more convenient, portable, and low-volume analyses arises.8–11 This current trend of sensor miniaturization will favor the use of single ZnO NRs, rather than a collection of NRs, as discrete detection elements for in vitro measurements as well as their in vivo applications.12–15 However, individual materials may present significantly different optical characteristics from their ensemble-averaged behavior, similar to what has been reported for single and multiple quantum dot systems.16,17 Hence, the optical response of single nanomaterials needs to be carefully and systematically examined before their meaningful use in biodetection devices.Zero-dimensional (0D) nanomaterials such as metallic and semiconducting nanoparticles are extensively used in biodetection as alternative quantum dot fluorophores for in vivo testing as well as signal enhancing metallic substrates for in vitro optical measurements.12–20 Therefore, the optical characteristics such as absorption/emission profiles and photostabilities are investigated to a great extent both for the inherent property of 0D semiconducting nanomaterials and for fluorophore-modified 0D metallic nanomaterials collectively.12–23 In addition, optical characteristics of single 0D nanoparticles are examined in many of these studies.16,17,21–23
On the other hand, very few research studies have been conducted to investigate optical characteristics of individual 1D nanostructures systematically in biomedically relevant settings so far. Yet, bio-optical investigation of such systems may lead to a discovery of new optical properties and applications based on the high shape anisotropy inherent to 1D nanomaterials. Conversely, for improved ensemble measurements, fundamental knowledge of biomolecular emission from single NRs may provide a central basis for accurate analysis and interpretation of optical signals measured from a collection of NRs.
In order to address this critical need, we investigate temporal and spatial optical responses of individual ZnO NRs with varying physical dimensions that are coupled with biomolecules. Specifically, we examine fluorescence emission from biomolecules directly coupled with individual ZnO NRs as a function of the position along the length of NRs. Unique optical responses that can stem from the high anisotropy of 1D nanomaterials can be better characterized by investigating a system containing isolated, individual 1D materials than those consisting of ensembles of nanostructures. For the first time, we characterize the photostability of biomolecular fluorophores on individual ZnO NRs and compare the outcomes with those measured from conventional polymeric materials. We report NR position-dependent intensity and stability profiles for biomolecular emission quantitatively and present three crucial findings: overall signal enhancement, signal intensification on individual nanorod ends, and increased photostability. The biomolecular fluorescence signal is much higher on individual ZnO NRs compared to control platforms. When examining signal distribution along the long axis of individual NRs, the biomolecular fluorescence is highly intensified on NR ends when compared to the main body of NRs. Regardless of the position on NRs, the time-dependent fluorescence profile is enhanced on ZnO NRs relative to control platforms and exhibits increased photostability of biomolecular emission on individual ZnO NRs.
Experimental section
A 1 × 1 cm Si wafer (0.017 in. thickness) obtained from Silicon, Inc. was cleaned by sonication in ethanol and dried under a stream of N2. For individual ZnO NRs, 20 μL of 20 nm Au colloid (Ted Pella, Inc.) was deposited on a Si wafer for 5 min and gently blown dry with nitrogen. The source materials, 0.45 grams of a 2![[thin space (1/6-em)]](https://www.rsc.org/images/entities/char_2009.gif) :1 mixture of graphite (99%) and zinc oxide powders (99.999%) obtained from Alfa Aesar Inc., were placed in a quartz boat at the center of a horizontal resistance furnace, and a target boat containing the catalyst-deposited Si substrate was placed 15.6 cm downstream. The furnace was heated to 950 °C for 2 h at a ramp up/ramp down rate of 15°C min−1 under a constant Ar flow of 100 standard cubic centimeters per minute. Various aspect ratios of ZnO NRs were achieved by slight alterations to the distance between the source materials and the growth substrate. ZnO NRs were subsequently sonicated off their growth substrates in ethanol and 2 μL aliquots of dispersed ZnO NRs were subsequently drop-cast onto clean Si wafers. For preparing the polymeric control substrates, a Si wafer was cleaned with ethanol, acetone, and toluene before being coated with an appropriate homopolymer film. A 2% (w/v) solution of the homopolymer, PMMA (molecular weight, Mw = 120000 g mol−1 with a polydispersity of 1.20) or PS (Mw = 152000 g mol−1 with a polydispersity of 1.34), in toluene was spun cast onto the Si substrate at 3500 rpm for 1 min yielding ultrathin PMMA and PS films of 63 nm and 78 nm in thickness, respectively. The film thickness was determined by carrying out ellipsometry measurements using a Stokes Ellipsometer LSE (Gaertner Scientific, Skokie, IL).
:1 mixture of graphite (99%) and zinc oxide powders (99.999%) obtained from Alfa Aesar Inc., were placed in a quartz boat at the center of a horizontal resistance furnace, and a target boat containing the catalyst-deposited Si substrate was placed 15.6 cm downstream. The furnace was heated to 950 °C for 2 h at a ramp up/ramp down rate of 15°C min−1 under a constant Ar flow of 100 standard cubic centimeters per minute. Various aspect ratios of ZnO NRs were achieved by slight alterations to the distance between the source materials and the growth substrate. ZnO NRs were subsequently sonicated off their growth substrates in ethanol and 2 μL aliquots of dispersed ZnO NRs were subsequently drop-cast onto clean Si wafers. For preparing the polymeric control substrates, a Si wafer was cleaned with ethanol, acetone, and toluene before being coated with an appropriate homopolymer film. A 2% (w/v) solution of the homopolymer, PMMA (molecular weight, Mw = 120000 g mol−1 with a polydispersity of 1.20) or PS (Mw = 152000 g mol−1 with a polydispersity of 1.34), in toluene was spun cast onto the Si substrate at 3500 rpm for 1 min yielding ultrathin PMMA and PS films of 63 nm and 78 nm in thickness, respectively. The film thickness was determined by carrying out ellipsometry measurements using a Stokes Ellipsometer LSE (Gaertner Scientific, Skokie, IL).
Lyophilized dichlorotriazinylaminofluorescein-conjugated, anti-bovine immunoglobulin G antibody (DTAF-antiIgG) and horse radish peroxidase (HRP) were received from Rockland Immunochemicals, Inc. 3,3′,5,5′-Tetramethylbenzidine (TMB) solution was obtained from VWR Scientific Inc. (West Chester, PA). DTAF-antiIgG was then reconstituted as per manufacturing recommendations and diluted appropriately in deionized water (DI) to obtain desired concentrations. 10 μL of varying concentrations of DTAF-antiIgG was deposited onto the ZnO NR and control substrates and kept in a humidity controlled chamber protected from light for 5 min. Immediately before fluorescence measurements, the substrate was subsequently washed with DI and dried with a gentle stream of N2. When necessary, substrate cleaning between fluorescence measurements was achieved by 5 min nitrogen plasma cleaning. Plasma cleaning was performed on a Harrick PDC-32G plasma cleaner at a setting of 18 W radio frequency. For morphological and structural characterization, as-grown ZnO NRs were imaged using a FEI/Philips XL 20 scanning electron microscope (SEM) operating at 20 kV. X-ray diffraction (XRD) data were obtained using a Rigaku Ultima IV X-ray diffractometer (Woodlands, TX) equipped with CuKα radiation accelerating at a voltage and current of 45 kV and 44 mA, respectively.
Optical and fluorescence measurements were carried out using a Zeiss Axio Imager A2M (Carl Zeiss Inc., Thornwood, NY) fluorescence microscope equipped with an AxioCAM MRm 4105 digital camera and AxioVision software. Fluorescence excitation was produced by using a 120 W mercury vapor lamp (X-Cite 120Q) while bright field (BF) and dark field (DF) illumination was produced by using a 12 V 100 W halogen lamp. In order to probe fluorescence emission from DTAF-antiIgG, a spectroscopic setting of 450–490 nm excitation and 510–540 nm collection with a 495 nm long pass filter was used. Fluorescence imaging was conducted periodically over 10 min using a 2 s exposure through an EC Epiplan-NEOFLUAR 50× magnification (Numerical Aperture, NA = 0.8) objective lens in a darkroom. All time-lapse images were subsequently analyzed using Image J (a Java-based image processing program) and Origin 8 (OriginLab Corp.) software. Atomic force microscopy (AFM) measurements of proteins were carried out using Digital Instruments Multimode Nanoscope IIIa in tapping mode at a scan speed of 1 Hz or lower. Silicon tips with a resonant frequency of 72 kHz and a spring constant of 1 N m−1 were used in our measurements. UV-vis absorbance spectra were recorded on a Hewlett Packard 8452A Diode Array Spectrophotometer in order to monitor the HRP enzymatic activity for its chromogenic substrate of TMB.
Results and discussion
Polymeric versus ZnO platforms
Three types of substrates are prepared as test and control platforms: individual ZnO NRs (test), PS (control), and PMMA (control). The latter two materials are chosen as examples of conventional polymeric materials that are used widely in biodetection as microwell arrays and microtitre plates. Although many types of ZnO nanostructures such as cages, helices, belts, bows, combs, and rods are available through well-established solution-based and gas-phase synthetic routes, we use specifically 1D ZnO NRs in all fluorescence measurements reported in this paper since among many available ZnO nanostructures, chemical vapor deposition (CVD)-grown rods have been most extensively used as fluorescence signal enhancing platforms. In order to employ individual ZnO NRs, as opposed to ensembles of vertically oriented NRs, as optical detection platforms for biomolecular fluorescence, these NRs are oriented laterally in the plane of a Si growth substrate. Their synthesis is carried out in a home-built CVD reactor using growth methods reported earlier.1,2,5,24Fig. 1 displays the crystal morphology and structure of a typical ZnO NR employed in our investigation. The wurtzite NR (11.1 μm and 1.0 μm in length and diameter, respectively) exhibits well-defined side (prismic plane) and end (basal plane) facets, as evidenced by the reflected bright field (BF), dark field (DF), and scanning electron microscopy (SEM) images, Fig. 1(A). The single crystallinity of the NR and its preferential growth along the c-axis are clearly shown in the X-ray diffraction (XRD) data, Fig. 1(B). Similar to what has been reported earlier,6,7,24 atomically defect-free ZnO NRs grown using this method do not show absorption and emission in the spectroscopic range of DTAF.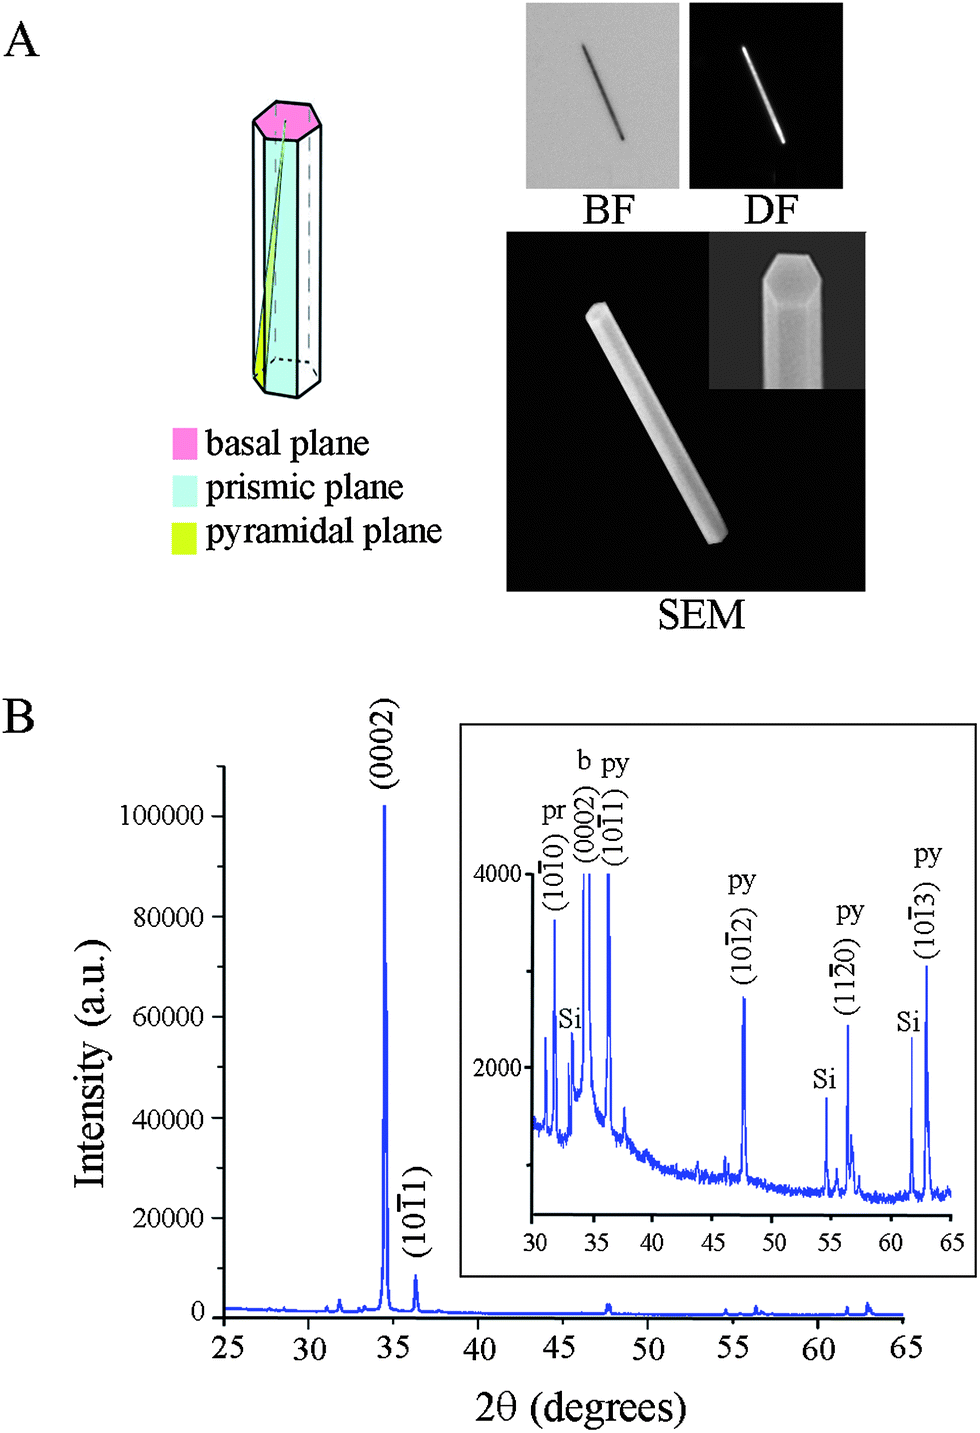 | ||
| Fig. 1 Physical and crystal structures of a typical ZnO NR used in the fluorescence experiment. Approximately 100 individual ZnO NRs were evaluated in the temporal and spatial measurements of biomolecular fluorescence on individual ZnO NRs. (A) Representative BF, DF, and SEM images of a ZnO rod are displayed. The NR in the panels is 1.0 μm and 11.1 μm in diameter and length, respectively. The hexagonal end facets as well as well-defined side facets of a wurtzite ZnO NR are clearly shown in the SEM inset. (B) XRD data of a typical batch of ZnO NRs display predominant 1D growth characteristics along the c-axis of the NRs. The inset clearly displays the low-intensity peaks arising from ZnO NR pyramidal and prismic planes. | ||
Since polymeric substrates can exhibit fluorescence from the materials themselves even before the addition of fluorophore-coupled biomolecules, such autofluorescence profiles are characterized first on PMMA and PS platforms by measuring their time-dependent fluorescence intensity profiles at the excitation and emission wavelengths appropriate for the chosen fluorophore, DTAF. PMMA displayed approximately five times higher initial autofluorescence when compared to PS with its intensity decaying exponentially with time, Fig. 2(A). Upon constant exposure to the excitation light for 10 min, the autofluorescence of the two polymers reached the same level. In the next set of experiments, the fluorescence intensity was profiled with respect to time after 200 μg ml−1 DTAF-antiIgG was introduced to the two control platforms. Fig. 2(B and C) display a autofluorescence-subtracted signal that is normalized to the intensity at time, T = 0 for PMMA and PS. The decay of biomolecular fluorescence is much faster on PMMA than on PS, although the initial intensity of DTAF-antiIgG on PMMA is 1.4 times higher than that on PS. We define T1/2, T1/5, and T1/10 as the time taken for the fluorescence intensity to lose 50%, 80%, and 90% of the intensity at T = 0, respectively. DTAF-antiIgG fades quickly over time (T1/2 = 17 s) on PMMA, whereas the same molecules exhibit a slower, more photostable decay on PS leading to an extended half-life (T1/2 = 32 s). Average T1/2, T1/5, and T1/10 values for the two control substrates are reported in Table 1. Fig. 2(D) displays 500 nm × 500 nm topographic AFM images of 4 μg ml−1 IgG deposited onto PMMA and PS platforms. The results show that, under the same deposition conditions, the amount of adsorbed proteins is higher on PS than on PMMA. Therefore, the higher fluorescence signal on PMMA at T = 0, in comparison with that on PS, is not due to increased adsorption of DTAF-antiIgG onto PMMA. It is likely related to the inherent optical properties of the polymers such as the absorption loss due to the electronic transition. For example, it is known that the optical loss due to electronic transitions for PMMA is much lower than that of PS, as determined by Urbach's empirical rule.25,26
 | ||
| Fig. 2 Biomolecular fluorescence characteristics observed from the polymeric substrates of PMMA and PS. Black symbols and red lines correspond to the experimental data and curve fit, respectively. (A) The autofluorescence intensities from the polymeric substrates are profiled with respect to the exposure time, t. Both PMMA and PS show non-negligible autofluorescence where the original autofluorescence of PMMA is five times higher than that from PS. (B and C) Normalized, autofluorescence-subtracted fluorescence intensity from 200 μg ml−1 DTAF-antiIgG on PMMA (B) and on PS (C) is measured at constant illumination and plotted with respect to the exposure time. (D) 500 nm × 500 nm AFM topography panels showing the differences in the adsorbed IgG amount on the PMMA (left) and PS (right) platforms under the same biodeposition conditions. Protein adsorption is favored on PS, showing higher amounts of IgG on PS. | ||
| Control and test platforms | T 1/2 (s) | T 1/5 (s) | T 1/10 (s) |
|---|---|---|---|
| PMMA | 17 ± 2.1 | 72 ± 14.8 | 161 ± 10.2 |
| PS | 32 ± 5.0 | 123 ± 15.4 | 205 ± 9.3 |
| Individual ZnO NR ends (basal plane) | 60 ± 5.3 | 163 ± 10.1 | 250 ± 15.9 |
| Individual ZnO NR main body (prismic plane) | 40 ± 6.0 | 136 ± 5.5 | 237 ± 17.4 |
Fluorescence intensification on ZnO nanorod ends (FINE)
Similar measurements were repeated on the test platform of individual ZnO NRs using 200 μg ml−1 DTAF-antiIgG. Upon examining the time-dependent fluorescence intensity along the long axis of NRs, a very intriguing phenomenon was elucidated from single ZnO NRs. Unlike the even fluorescence distribution observed on all areas of PS and PMMA, biomolecular emission on ZnO NRs is NR position dependent. The highest emission is observed on the two end facets (basal planes of the wurtzite crystal) of the NRs, and the signal intensity observed on the side facets (prismic planes) of the NRs is much lower than the intensities on the NR ends. For the rest of this paper, we refer to this observation of fluorescence intensification on nanorod ends as FINE. The three dimensional contour maps shown in Fig. 3(A) clearly display these findings. Fluorescence intensities are plotted as functions of time and different positions along the long axis of two NRs, 2 μm and 25 μm in length. We also note that FINE is a highly localized phenomenon, and the fluorescence intensity quickly reaches the measured value of the main body when moving away from the NR ends. In contrast, the same biomolecules show uniformly distributed fluorescence on all areas of PS, Fig. 3(B). In addition, the time-dependent decay slopes of the emission are uniform across all areas of PS, regardless of the position. This is not the case for individual ZnO NRs and the time-dependent intensity profile is extended more on the two ends of NRs than on the main body of NRs, as shown in Fig. 3(A). In order to probe possible effects of the length, width, and/or aspect ratio (length/width) of NRs on FINE, a broad range of ZnO NRs with varying physical dimensions was tested. ZnO NR samples from multiple synthetic runs, showing the size distribution of 1–70 μm in length and 0.1–2.5 μm in width with an average aspect ratio of 1:15 (width:length) under a SEM, were prepared for DTAF-antiIgG deposition and subsequently used for fluorescence measurements. We repeatedly observed the unique emission behavior of FINE on over 100 individual ZnO NRs. The size distribution histograms of the NRs used in FINE analysis are provided in the ESI, Fig. S1(a).† We note that the NR length plays an important role in the intensification degree of FINE, i.e. the ratio of fluorescence signal of DTAF-antiIgG monitored on the NR ends divided by that on the main NR body is higher for a longer NR than for a shorter NR. However, variations in widths of NRs did not contribute to noticeable differences in the extent of FINE for the range of NR widths and excitation/emission wavelengths used in our measurements. Although protein-conjugated fluorophores were used as model systems in this study to match closely typical biodetection conditions involving coupled pairs of fluorophore–protein, the presence of biomolecules does not influence the nature of FINE observed from ZnO NRs. This is further evidenced by the same fluorescence profile observed on a ZnO NR without protein conjugation, involving only fluorophores on the NR (ESI, Fig. S1(b)†).
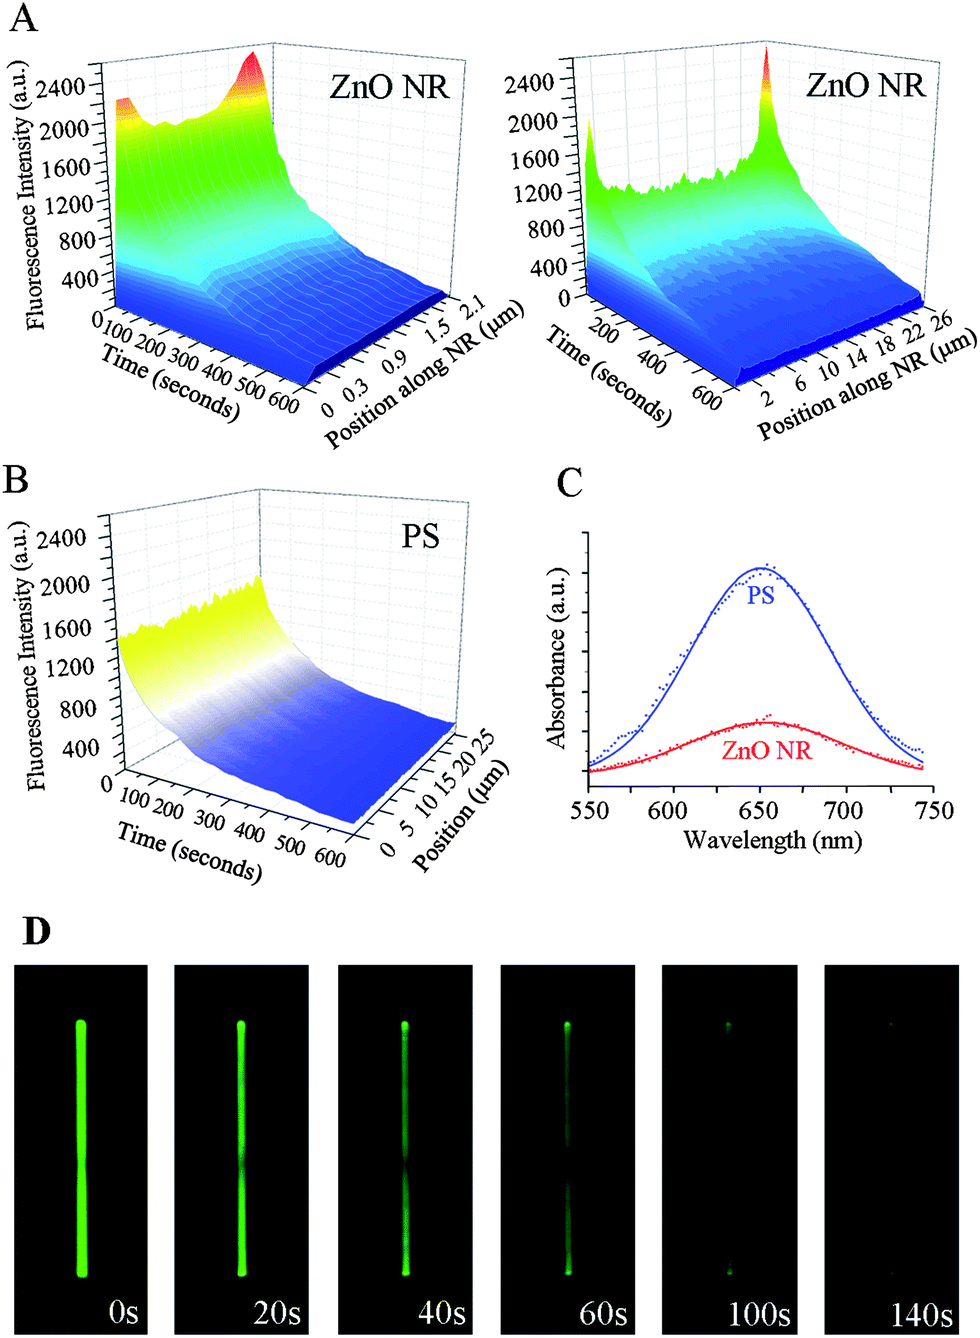 | ||
| Fig. 3 Fluorescence intensity profile along the material length and time. (A) The contour maps display variations in the biomolecular fluorescence intensity along the long axis of a 2 μm-long ZnO NR (left) and a 25 μm-long ZnO NR (right). In all cases, the fluorescence intensity is enhanced on the basal planes of a ZnO NR. (B) The contour map displays the biomolecular fluorescence intensity over time measured from PS. No significant position-dependent intensity differences are observed. (C) In order to compare the amount of proteins adsorbed on ZnO NR versus PS platforms, UV-vis spectra for the characteristic absorbance peak of an oxidized TMB product at 650 nm are obtained from the two platforms treated identically with 50 μg ml−1 HRP. The amount of surface-bound HRP is higher on PS than on ZnO NR platforms. (D) Time-lapse images of a typical fluorescence measurement from 200 μg ml−1 DTAF-antiIgG on a single ZnO NR are displayed. | ||
Understanding FINE
Higher biomolecular fluorescence signal on ZnO NR, when compared to that on the polymeric control platforms, does not correlate with the amount of adsorbed proteins. To estimate the amount of proteins adsorbed on different surfaces, HRP was exploited as a model protein for the well-known chromogenic HRP-TMB assays. When the amount of surface-bound HRP was compared between PS and ZnO NRs by monitoring its characteristic spectroscopic absorption peak at 650 nm, PS showed a much higher absorption signal than ZnO NRs, as shown in Fig. 3(C). This indicates that surface adsorption of HRP is favored on the polymeric surface of PS over ZnO NRs, and a larger amount of proteins is present on PS. At the same time, the biomolecular fluorescence intensity is stronger on ZnO NRs than on PS although the amount of proteins is lower on the NRs. Considering the fact that the amount of adsorbed proteins is more than six times higher on the PS platform than on ZnO NRs based on the area-under-the-curve analysis of the spectroscopic signals, it should be noted that the fluorescence intensification observed from the single ZnO NRs in Fig. 3(A) is gained from a much smaller amount of proteins than that from the control samples.Similarly when considering a single ZnO NR, we do not believe that the higher signal monitored from the NR ends is related to differential amounts of proteins adsorbing onto the basal versus prismic NR planes. The exposed surface area on the prismic planes available for protein adsorption is much larger than the two basal planes, especially for the NRs used in the experiments with an average aspect ratio of 1:15 (width:length). It is likely that more proteins couple onto the side facets than the two ends of the NR. It is known that particle shapes can affect protein binding from nanoparticle ensemble measurements27 which suggests that possible differences due to preferential protein adsorption on certain crystallographic facets cannot be entirely neglected in our experiments. Although very little is known for crystallographically specific adsorption preferences of proteins at the single crystal level, a few systems involving facet-specific binding of 1,4-β-D-glucan cellobiohydrolase on cellulose microfibril crystals show that surface adsorption of proteins is favored on the side facets than on the end facets of the microfibril crystals. The structure of the microfibril crystal resembles that of 1D ZnO NRs.28,29 Considering these factors together, a lower amount of adsorbed proteins is expected on the NR basal planes than on the prismic planes. However, higher biomolecular fluorescence signal is observed from the basal planes. Therefore, the surface-bound protein density is not the key determining factor in observing FINE. Rather, the origin of FINE may lie in the inherent physical and optical properties of ZnO NRs.
Strong electromagnetic fields known to be produced around the tips of the NRs may serve as a source of FINE. Tip-enhancement of electric fields, known as the lightning rod effect, is due to the shape factor of a material and has been extensively reported.30–32 This effect is exploited in applications such as local surface plasmon enhancement of gold NR tips, oscillating band-gap emission of gold NR ends, and tip-enhanced near field optical imaging with carbon nanotubes.30–32 However, we report for the first time signal intensification on the two ends of ZnO NRs involving fluorescence emission from fluorophore-conjugated biomolecules. Similar physics from the lightning rod effect may carry over to our system of study and contributes to better excitation by providing a locally enhanced electric field of excitation for the biomolecules, subsequently resulting in higher fluorescence. Another possibility for FINE focuses on emission, i.e. better guiding and channeling of the emitted light from biomolecules through ZnO NRs based on their well-known waveguiding properties. Light-guiding and light-amplifying properties of ZnO NRs have been extensively demonstrated in their optoelectronic applications.33–44 Metal oxide nanoribbons coupled with a NR laser have specifically been shown to guide visible light from fluorophores, resulting in direct as well as guided fluorescence on the nanoribbons.35 The origin of FINE appears to be more complex than a simple explanation of local excitation field enhancement and, therefore, the exact mechanism of FINE is still under investigation. Fig. 3(D) displays time-lapse fluorescence images of a ZnO NR confirming the photostability trend within individual NRs as discussed above: a faster signal decay on the NR body and a slower decrease on the two ends of the NR. The fluorescence signal on the two NR ends persisted long after 140 s when that on the NR body was no longer visible.
Time-dependence of the biomolecular signal on the basal vs. prismic planes of a single ZnO NR
Quantitative and time-dependent fluorescence analyses were carried out on the end facets and the main body of individual ZnO NRs in order to compare their position-dependent characteristics of the biomolecular fluorescence intensity and photostability. Fig. 4 displays both the raw and normalized fluorescence intensities from the ends (shown in red) and the main body (shown in black) of an individual NR over time. In addition to the much stronger signal observed from DTAF-antiIgG on ZnO NR ends as shown in Fig. 3(A and D), the photostability trend of the biomolecular emission exhibits slight differences between the ends and the main body of ZnO NRs. This is evidenced by the raw fluorescence intensity plots in Fig. 4(A), showing the variations in the time-dependence of the measured fluorescence on the different crystallographic planes within a single ZnO NR. Upon constant illumination with the excitation source, fluorescence is not only higher in intensity on the basal plane (end facets) of the NR but also persists longer in time when compared to the signal from the prismic plane (side facets). In order to analyze half-life values of the fluorescence, the two datasets shown in Fig. 4(A) are normalized with respect to the maximum and minimum intensity values of the respective set and plotted in Fig. 4(B). The early time data of the normalized plots are shown in Fig. 4(C) in order to display clearly the photostability differences on the NR side and end facets where the extended T1/2 of 59 s is observed from the NR end, in comparison with the T1/2 value of 40 s from the prismic plane. Regardless of the analysis position along the length of NRs, the fluorescence half-life of DTAF-antiIgG (T1/2) is significantly increased on individual ZnO NRs when compared to its half-lives on the control platforms. The average values of T1/2, T1/5, and T1/10 measured from the ends and main body of ZnO NRs are provided in Table 1. In addition, the biomolecular fluorescence signal was more stable overall on ZnO NRs showing extended T1/5 and T1/10, when compared to those on PMMA and PS. Similar to the highly localized signal increase observed at the NR ends, photostability profiles also showed NR-position dependence where, upon constant light exposure, the biomolecular fluorescence stability was the highest over time on ZnO NR ends. The time-dependent fluorescence profiles from various positions along the NR main body reveal improved photostability compared to the polymeric control platforms, but a slightly reduced decay time in comparison with the NR ends.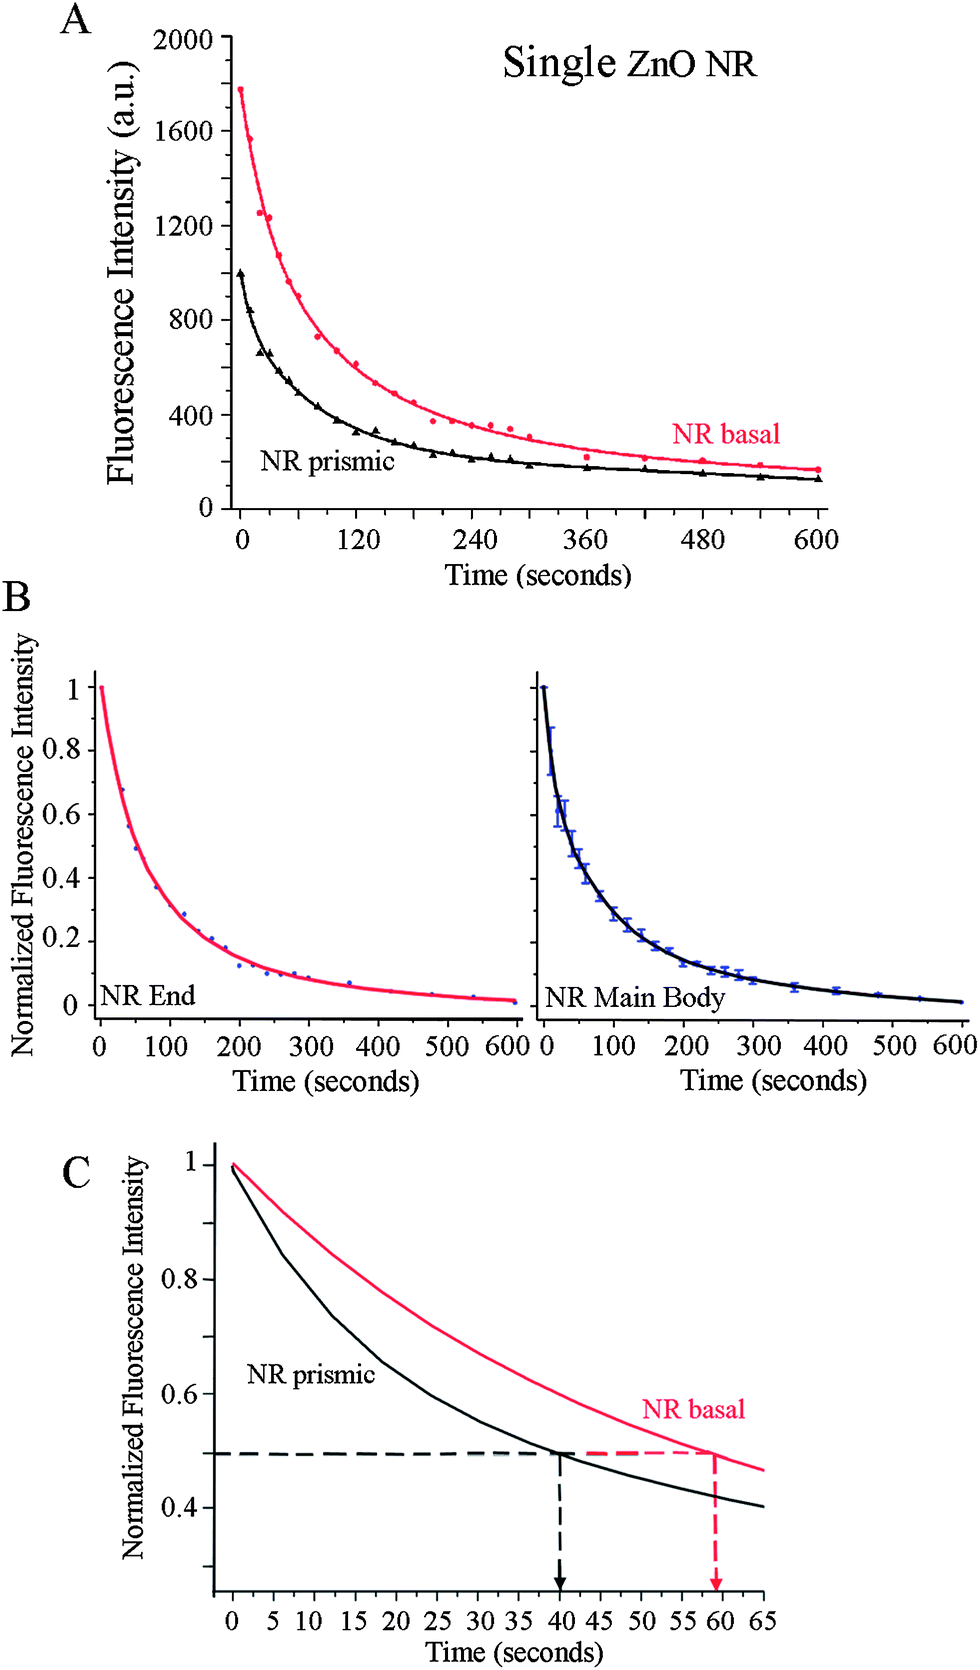 | ||
| Fig. 4 Biomolecular fluorescence characteristics observed from 200 μg ml−1 DTAF-antiIgG on a single ZnO NR. Symbols and solid lines in each graph correspond to the experimental data and curve fits, respectively. (A) Differences in the time-dependence of the fluorescence intensity decay under constant irradiation are clearly observed depending on the crystallographic planes within a single ZnO NR. Red and black data show the biomolecular fluorescence measured from the basal and prismic planes, respectively. When compared to the signal from the main body of the NR, the fluorescence from the NR end is observed not only higher in intensity but also lasts for more prolonged time. (B) The plots show normalized fluorescence intensity profiles for the end (left) and the main body (right) of the ZnO NR, respectively. Each graph is produced by normalizing the two datasets in (A) with regard to the maximum and minimum intensity values of the respective set. (C) Early time photostability trends of the biomolecular fluorescence measured from the NR basal (red) and the NR prismic (black) planes are displayed in this magnified view of the normalized intensity graphs in (B). Fluorescence signal from the basal plane persists much longer (T1/2 = 59 s) than that from the prismic plane (T1/2 = 40 s). | ||
FDTD simulations
We further performed finite-difference time-domain (FDTD) simulations to understand FINE. All simulations were performed using FDTD Solution 7.5 developed by Lumerical Solutions, Inc. The nanostructure and its surrounding medium were divided into meshes of 3 nm in size. The refractive indices of the surrounding medium and ZnO were taken to be 1 and 1.95, respectively. The ZnO NR was modeled as a hexagonal prism with dimensions of 100 nm (side length) and 2.5 μm (length). To simulate the fluorescence radiation, DTAF-antiIgG was modeled as an electric dipole placed in the middle at 10 nm away from the ZnO NR surface. The estimated distance of 10 nm was based on the size of the protein, reflecting the physical separation between the fluorophore and the NR imposed by the coupled protein. Three polarization directions of the electric dipole were considered during simulations. Fig. 5 shows our simulation results for each polarized condition and full movies showing the radiation process for each case are provided in the ESI, Fig. S2.† When the dipole is polarized along the long axis of the ZnO NR as shown in Fig. 5(A), a very large portion of the dipole radiation is coupled into the ZnO NR. This radiation forms surface evanescent waves, propagates along the length of the ZnO NR, and finally radiates to far field from the NR ends. Polarization along the transverse direction of the NR in Fig. 5(B) results in the most limited coupling of the radiation energy with the NR among the three polarized conditions. In this case, a large portion of the dipole radiation from the main body of the ZnO NR is directed downwards towards the substrate. When the dipole is polarized perpendicular to the ZnO NR, almost all energy is coupled back to the NR, leading to the formation and propagation of very strong evanescent waves before finally radiating out from the NR ends, Fig. 5(C). Hence, this polarization direction gives rise to the brightest FINE signal out of the three polarization cases. When considering the random surface orientation of DTAF-antiIgG on the NR surface, contributions of the three polarized situations should be equally accounted for. And the combined emission from the three cases is in good agreement with our experimental observation where the emission from the NR ends is expected to be highly intensified when compared to that from the main body of the NR, yielding the fluorescence signal much brighter on the NR ends than on other regions of the NR.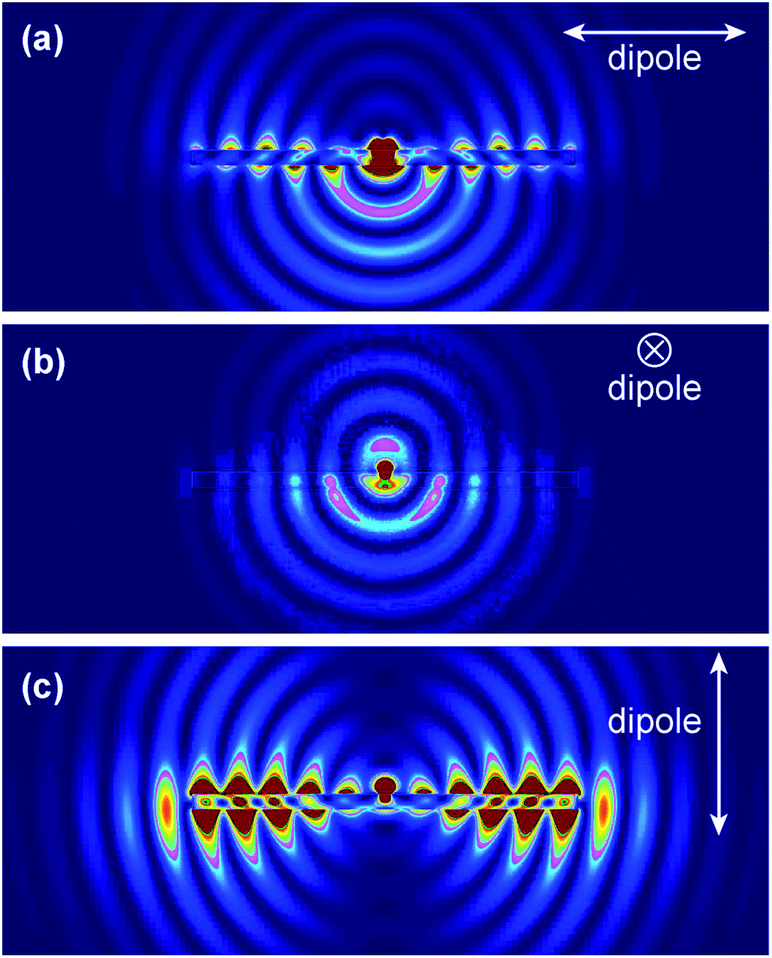 | ||
| Fig. 5 FDTD simulations on the fluorescence emission profile from a fluorophore located at 10 nm away from the surface of a ZnO NR. Snap shot images of the three simulation cases for the dipole polarization, (a) parallel to the ZnO NR, (b) in the transverse direction of the NR, and (c) perpendicular to the ZnO NR, are presented. The full movies containing the radiation flow for the three cases are provided in Fig. S2, ESI.† | ||
Summary
In summary, we investigated for the first time the biomolecular fluorescence emission characteristics on individual ZnO NRs as functions of time and position along the length of NRs. We subsequently compared the results with those measured on conventional polymeric platforms. Quantitative and qualitative examinations of single ZnO NR systems enabled us to identify a unique temporal and spatial biomolecular emission behavior. We observed that the biomolecular fluorescence intensity is highly intensified on the two ends of NRs compared to the main body of NRs, FINE. FDTD simulations also predicted intensified fluorescence emission on NR ends, in good agreement with our experimental observation of FINE. The biomolecular fluorescence intensity over time was significantly increased on individual ZnO NR ends, in contrast to the photostability properties measured on conventional substrates. Biomolecular emission from the main body of the NRs was higher in intensity and photostability relative to those on polymeric platforms, but lower than the measurements made on the NR ends. Our efforts can be highly beneficial in finding new optical applications of individual ZnO NRs that exploit FINE in fluorescence-coupled detection. Our findings will be also valuable in understanding the biomolecular fluorescence signal collected from many NR systems.Acknowledgements
The authors acknowledge financial support for this work by the National Institutes of Health, National Research Service Award (1R01DK088016) from the National Institute of Diabetes and Digestive and Kidney Diseases. The authors also thank Prof. Jianfang Wang, Dr Tian Ming, and Mr Ruibin Jiang in the Department of Physics at the Chinese University of Hong Kong for carrying out the FDTD simulation.References
- A. Dorfman, N. Kumar and J. Hahm, Langmuir, 2006, 22, 4890–4895 CrossRef CAS PubMed.
- A. Dorfman, N. Kumar and J. Hahm, Adv. Mater., 2006, 18, 2685–2690 CrossRef CAS.
- A. Dorfman, O. Parajuli, N. Kumar and J. Hahm, J. Nanosci. Nanotechnol., 2008, 8, 410–415 CrossRef CAS PubMed.
- N. Kumar, A. Dorfman and J. Hahm, Nanotechnology, 2006, 17, 2875–2881 CrossRef CAS.
- V. Adalsteinsson, O. Parajuli, S. Kepics, A. Gupta, W. B. Reeves and J. Hahm, Anal. Chem., 2008, 80, 6594–6601 CrossRef CAS PubMed.
- J. Hahm, in Metal Enhanced Fluorescence, ed. C. D. Geddes, Wiley, 2010 Search PubMed.
- J. Hahm, J. Biomed. Nanotechnol., 2013, 9, 1–25 CrossRef CAS PubMed.
- A. B. Dahlin, Sensors, 2012, 12, 3018–3036 CrossRef PubMed.
- J. H. Luong, K. B. Male and J. D. Glennon, Biotechnol. Adv., 2008, 26, 492–500 CrossRef CAS PubMed.
- M. R. Melo, S. Clark and D. Barrio, Clin. Chem. Lab. Med., 2011, 49, 581–586 CrossRef CAS PubMed.
- C. Wingren and C. A. Borrebaeck, Drug Discovery Today, 2007, 12, 813–819 CrossRef CAS PubMed.
- M. De, P. S. Ghosh and V. M. Rotello, Adv. Mater., 2008, 20, 4225–4241 CrossRef CAS.
- X. Gao, Y. Cui, R. M. Levenson, L. W. Chung and S. Nie, Nat. Biotechnol., 2004, 22, 969–976 CrossRef CAS PubMed.
- I. L. Medintz, H. T. Uyeda, E. R. Goldmann and H. Mattoussi, Nat. Mater., 2005, 4, 435–446 CrossRef CAS PubMed.
- X. Michalet, F. F. Pinaud, L. A. Bentolila, J. M. Tsay, S. Doose, J. J. Li, G. Sundaresan, A. M. Wu, S. S. Gambhir and S. Weiss, Science, 2005, 307, 538–544 CrossRef CAS PubMed.
- J. Tang and R. A. Marcus, J. Chem. Phys., 2005, 123, 204511–204516 CrossRef PubMed.
- D. Ratchford, K. Dziatkowski, T. Hartsfield, X. Li, Y. Gao and Z. Tang, Appl. Phys. Lett., 2011, 109, 103509 Search PubMed.
- U. Resch-Genger, M. Grabolle, S. Cavaliere-Jaricot, R. Nitschke and T. Nann, Nat. Methods, 2008, 5, 763–775 CrossRef CAS PubMed.
- W. C. W. Chan and S. Nie, Science, 1998, 281, 2016–2018 CrossRef CAS PubMed.
- A. Agrawal, R. Deo, G. D. Wang, M. D. Wang and S. Nie, Proc. Natl. Acad. Sci. U. S. A., 2008, 105, 3298–3303 CrossRef CAS PubMed.
- M. Pelton, G. Smith, N. F. Scherer and R. A. Marcus, Proc. Natl. Acad. Sci. U. S. A., 2007, 104, 14249–14254 CrossRef CAS PubMed.
- R. A. Marcus, Philos. Trans. R. Soc. London, Ser. A, 2010, 368, 1109–1124 CrossRef CAS PubMed.
- X. Xu, T. Yamada and A. Otomo, Appl. Phys. B, 2009, 94, 577–583 CrossRef CAS.
- N. Kumar, A. Dorfman and J. Hahm, J. Nanosci. Nanotechnol., 2005, 5, 1915–1918 CrossRef CAS PubMed.
- T. Kaino, in Organic Molecular Solids: Properties and Applications, ed. W. Jones, Taylor & Francis, 2002, ch. 7, p. 207 Search PubMed.
- Y. Koike and R. Gaudino, in Optical Fiber Telecommunications Volume VIA: Components and Subsystems, ed. I. Kaminow, T. Li and A. E. Willner, Elsevier Science, 2013, ch. 10, p. 360 Search PubMed.
- Z. J. Deng, G. Mortimer, T. Schiller, AnthonyMusumeci, D. Martin and R. F. Minchin, Nanotechnology, 2009, 20, 455101 CrossRef PubMed.
- H. Chanzy, B. Henrissat and R. Vuong, FEBS Lett., 1984, 172, 193–197 CrossRef CAS.
- J. Lehtio, J. Sugiyama, M. Gustavsson, L. Fransson, M. Linder and T. T. Teeri, Proc. Natl. Acad. Sci. U. S. A., 2003, 100, 484–489 CrossRef CAS PubMed.
- T. Chen, C. Du, L. H. Tan, Z. Shen and H. Chen, Nanoscale, 2011, 3, 1575–1581 RSC.
- K. Imura, T. Nagahara and H. Okamoto, J. Am. Chem. Soc., 2004, 126, 12730–12731 CrossRef CAS PubMed.
- A. Hartschuh, M. R. Beversluis, A. Bouhelier and L. Novotny, Philos. Trans. R. Soc. London, Ser. A, 2004, 362, 807–819 CrossRef CAS PubMed.
- X. D. Bai, E. G. Wang, P. X. Gao and Z. L. Wang, Nano Lett., 2003, 3, 1147–1150 CrossRef CAS.
- M. Law, D. J. Sirbuly, J. C. Johnson, J. Goldberger, R. J. Saykally and P. Yang, Science, 2004, 305, 1269–1273 CrossRef CAS PubMed.
- D. J. Sirbuly, M. Law, P. Pauzauskie, H. Yan, A. V. Maslov, K. Knutsen, C.-Z. Ning, R. J. Saykally and P. Yang, Proc. Natl. Acad. Sci. U. S. A., 2005, 102, 7800–7805 CrossRef CAS PubMed.
- J. C. Johnson, H. Yan, P. Yang and R. J. Saykally, J. Phys. Chem. B, 2003, 107, 8816–8828 CrossRef CAS.
- M. H. Huang, S. Mao, H. Feick, H. Q. Yan, Y. Y. Wu, H. Kind, E. Weber, R. Russo and P. D. Yang, Science, 2001, 292, 1897–1899 CrossRef CAS PubMed.
- J. C. Johnson, H. Yan, R. D. Schaller, L. H. Haber, R. J. Saykally and P. Yang, J. Phys. Chem. B, 2001, 105, 11387–11390 CrossRef CAS.
- P. J. Pauzauskie and P. Yang, Mater. Today, 2006, 9, 36–45 CrossRef CAS.
- R. Yan, D. Gargas and P. Yang, Nat. Photonics, 2009, 3, 569–576 CrossRef CAS.
- R. Kaiser, Y. Levy, N. Vansteenkiste, A. Aspect, W. Seifert, D. Leipold and J. Mlynek, Opt. Commun., 1994, 104, 234–240 CrossRef.
- S. Börner, C. E. Rüter, T. Voss, D. Kip and W. Schade, Phys. Status Solidi A, 2007, 204, 3487–3495 CrossRef.
- C. Zhang, F. Zhang, S. Qian, N. Kumar, J.-i. Hahm and J. Xu, Appl. Phys. Lett., 2008, 92, 233116 CrossRef.
- C. Zhang, F. Zhang, T. Xia, N. Kumar, J.-i. Hahm, J. Liu, Z. L. Wang and J. Xu, Opt. Express, 2009, 17, 7893–7900 CrossRef CAS PubMed.
Footnote |
| † Electronic supplementary information (ESI) available: ZnO NR size distributions, a FINE image from fluorophores on ZnO NR without protein coupling, and FDTD simulation movies. See DOI: 10.1039/c3nr05031a |
| This journal is © The Royal Society of Chemistry 2014 |