Probing the surface of platinum nanoparticles with 13CO by solid-state NMR and IR spectroscopies†
Solen
Kinayyigit
ab,
Patricia
Lara
ab,
Pierre
Lecante
c,
Karine
Philippot
*ab and
Bruno
Chaudret
*d
aCNRS, LCC (Laboratoire de Chimie de Coordination du CNRS), BP 44099, 205 Route de Narbonne, F-31077 Toulouse Cedex 4, France. E-mail: Karine.Philippot@lcc-toulouse.fr; Tel: +33 561 33 3230
bUniversité de Toulouse, UPS, INPT, LCC, F-31077 Toulouse, France
cCentre d'Elaboration de Matériaux et d'Etudes Structurales du CNRS, Rue Jeanne Marvig, 31077 Toulouse, France
dLPCNO, Laboratoire de Physique et Chimie de Nano-Objets du CNRS, 135, UMR 5215 INSA-CNRS-UPS, Institut National des Sciences Appliquées, 135 Avenue de Rangueil, F-31077 Toulouse, France. E-mail: chaudret@insa-toulouse.fr; Tel: +33 561 55 96 55
First published on 10th October 2013
Abstract
The synthesis and full characterization of platinum nanoparticles (Pt NPs) prepared by decomposition of the Pt(dba)2 complex in the presence of CO and H2 and stabilized either sterically by a polymer, polyvinylpyrrolidone or chemically by a ligand, diphenylphosphinobutane, are reported. In these studies, 13CO was used as a probe molecule to investigate the surface of the particles, using IR and solid-state NMR spectroscopies with magic angle spinning (MAS-NMR). Three nanosystems with different sizes are described: Pt/PVP/13CO (monomodal: 1.2 nm), Pt/dppb/13CO (bimodal: 1.2 nm and 2.0 nm) and Pt/dppb/H2 (monomodal: 2.0 nm) NPs. Spectroscopic data suggest a modification of the electronic state of the nanoparticles between 1.2 nm and 2.0 nm which can be related to the presence of Knight shift.
Introduction
There is an increase in the use of well-defined metal nanoparticles (NPs) in catalysis.1 With a good tuning of the shape, size and composition, NPs can combine both homogeneous and heterogeneous properties of catalysts: a high surface area and a controlled surface with desired catalytic activity and selectivity.2–5 With size ranges of few nanometers, clusters and colloids represent a state where exciting electronic and physical properties that differentiate from their bulk state can emerge.6 At the molecular level, little is known about the surface reactivity of such NPs as well as about the intermediate species formed on the surface. In addition, the ligands present on the outer shell and used for the chemical stabilization of the metal NPs may also alter the electronic structure. Especially for small clusters or colloids, the ratio of the surface to the inner-core shell metal atoms increases and this makes them attractive models for surface investigations. For this purpose, CO can be very useful both as an infrared and an NMR active probe molecule for the determination of coordination sites on metal surfaces.7–17Early IR and liquid NMR studies performed on Pd NPs by Bradley et al. showed that CO molecules first coordinate in bridging mode on the extended faces and later adopt the terminal mode on the edges and the apexes.11,13,14 IR studies on Pd NPs also revealed that the adsorption mode of carbon monoxide is size dependent: as the nanoparticle size decreases, the ratio of terminal CO to the bridging one increases.15 Later on, similar studies were carried out on Pt NPs in solution where IR spectra showed a ligand concentration dependence and thus a size dependence.18,19 No shift and broadening of the signal due to the presence of conduction electrons (Knight shift) were observed by solution 13C NMR on Pt NPs reacted with 13CO due to their very small size (<1 nm).11 With the aid of recent developments in the spectroscopic techniques, especially in solid-state NMR spectroscopy, we are now able to better study the coordination, location and dynamics of the ancillary ligands and reactive adsorbates on the nanoparticle surface.4,20 Previous work in our group focused on the investigation of the coordination of CO on Ru NPs stabilized by a polymer, polyvinylpyrrolidone or simple ligands such as diphosphines and carbenes.21–24 These successful results encouraged us to continue on this way as a better understanding of the surface reactivity of nanoparticle systems is necessary to modify them as catalysts of desire.
Among various nanomaterials, platinum based nanostructures find wide usage especially in the petrochemical and automotive industry due to their stability, high catalytic activity and unique shape and size based properties.25–28 Although several methods have been used for the synthesis of NPs, benefiting from years of experience, the organometallic approach has proven to be a very efficient route for achieving well-controlled NPs in terms of size, chemical composition and structure.29–31 Application of mild conditions of temperature and gas pressure for the decomposition of the metal precursor leads to stable NPs that display average sizes less than 5 nm with narrow size distributions and well-controlled surface states, advantageous especially for catalytic applications.
In this paper, we report the organometallic synthesis of Pt NPs of 1–2 nm in size, stabilized by a polymer, polyvinylpyrrolidone (PVP) or a diphosphine ligand, 1,4-bis(diphenylphosphinobutane) (dppb) and having CO molecules coordinated at the surface. The coordination of CO was achieved either by direct decomposition of the complex, [Pt(dba)2], under a CO atmosphere in the presence of PVP or dppb at room temperature, or by reacting CO with preformed NPs synthesized by decomposition of the same complex under H2. These NPs were fully characterized by TEM, HRTEM, WAXS, FTIR and NMR techniques. In particular, the surface state of these NPs was explored using MAS-NMR spectroscopy. This work follows previous results from the group on Ru and RuPt NPs stabilized with the same polymer and ligand.21,32,33 In this case, CO coordination on segregated RuPt NPs showed the presence of broad bands due to the influence of platinum. In order to evidence the origin of this influence, which could be related to the presence of Knight-shift, we prepared Pt NPs of different sizes (in a limited range: 1.2–2 nm) and surface composition and undertook a surface chemistry study by solid-state NMR spectroscopy.
Experimental section
General
All reactions were carried out using standard Schlenk tube or Fischer-Porter bottle techniques under an inert and dry atmosphere. THF was freshly distilled over sodium/benzophenone under an inert atmosphere prior to use and degassed by three freeze–pump cycles. Toluene and pentane were purified under a nitrogen atmosphere using solvent purification equipment (Braun) and degassed by three freeze–pump cycles prior to use. Potassium tetrachloroplatinate(II) (K2PtCl4) was purchased from Strem Chemicals. Dibenzylideneacetone (dba) and 1,4-bis(diphenylphosphino)butane (dppb) were purchased from Alfa-Aesar. Polyvinylpyrrolidone (PVP) was purchased from Sigma-Aldrich and dried over P2O5 at 80 °C under vacuum for three days prior to use. Argon and H2 gases were purchased from Air Liquid. Extra pure (99.6%) 13CO was purchased from Eurisotop.Characterization techniques
Transmission electron microscopy (TEM) analyses were performed at the Service Commun de Microscopie Electronique de l'Université Paul Sabatier (TEMSCAN). TEM specimens were prepared by dropping the colloidal solution on holey carbon covered copper grids. The TEM analyses were carried out on a JEOL TEM 1011 CX-T electron microscope operating at 100 kV and with a point resolution of 4.5 Å. The mean size of nanoparticles was calculated by manually counting at least 200 nanoparticles on enlarged TEM micrographs. High resolution transmission electron microscopy (HRTEM) studies were performed with a JEOL JEM 2010 Electron Microscope working at a 200 kV with a resolution point of 2.35 Å. FFT analyses were done with Gatan Digital Micrograph Version 1.80.70.Wide-angle X-ray scattering (WAXS) measurements were performed at CNRS-CEMES in Toulouse, using a dedicated two-axis diffractometer. Samples were sealed in 1.0 mm diameter Lindemann glass capillaries under argon. The samples were irradiated with graphite-monochromated molybdenum Kα (0.071069 nm) radiation and a solid-state detector suppressed the strong X-ray fluorescence from platinum at the measurement step. Radial distribution functions (RDF) were obtained after the correction, normalization and Fourier transformation of the collected intensities.
FTIR spectra were recorded on a Perkin-Elmer GX2000 spectrometer equipped with an ATR accessory installed in a glove-box. Pt/PVP/13CO and Pt/dppb/H2 NPs were prepared as KBr pellets under an argon atmosphere. Elemental analyses were performed at the Service Central d'Analyse du CNRS in Vernaison.
Solid-state NMR (MAS NMR) spectra were recorded on a Bruker Avance 400 WB spectrometer in CNRS-LCC. MAS NMR data were recorded using a 4 mm rotor at a spin rate of 12 kHz unless indicated otherwise and all data are in ppm. Pt/PVP/13CO and Pt/dppb/13CO NP samples were measured fresh after synthesis without further treatment. Pt/dppb/H2 NPs were measured before and after 13CO adsorption in a freshly prepared solid sample. The signal observed at 110 ppm in hpdec 13C-NMR data is due to the Teflon inset of the NMR rotor. Liquid NMR spectra (d8-THF) were recorded on a Bruker Avance 400 spectrometer in CNRS-LCC.
Synthesis
[Pt(dba)2] was prepared with small modifications according to the literature procedures (see ESI: Pt(dba)2 preparation†).34Results and discussion
Pt/PVP/13CO NPs were synthesized by decomposition of [Pt(dba)2] under a CO atmosphere in the presence of the polymer PVP as the stabilizing agent (THF; 1 bar of 13CO; r.t.) according to a known procedure (Scheme 1).7,30 Labeled CO was used in the synthesis in order to facilitate the study of their surface by 13C MAS-NMR spectroscopy. TEM and HRTEM analyses of these Pt/PVP/13CO NPs revealed well-dispersed NPs. They display a low contrast in electron microscopy due to their very small size and the presence of excess polymer. Their mean diameter is estimated to be ca. 1.2 ± 0.2 nm (see Fig. ESI1†). | ||
| Scheme 1 Synthesis of platinum nanoparticles from [Pt(dba)2]. | ||
Pt/dppb/13CO NPs were prepared in the same way by decomposition of [Pt(dba)2] in the presence of 0.2 molar equivalents (eq.) of dppb. A quantity of 0.2 molar eq. of ligand per [Pt(dba)2] was necessary to get stable Pt NPs. According to TEM analysis the size distribution of these particles is bimodal. Most of the obtained Pt/dppb/13CO NPs are well-dispersed, homogeneous in size and very small. Their mean diameter is estimated to be 1.2 ± 0.2 nm (see Fig. ESI2†). In addition, some agglomerations are observed in the form of spherical superstructures in which the NPs still remain individual but adopt a larger size of 2.0 ± 0.2 nm (Fig. 1).
 | ||
| Fig. 1 TEM images and the size histogram (inlet) of the superstructures observed in Pt/dppb/13CO NPs. | ||
Decomposition of a THF solution of [Pt(dba)2] under 3 bar of H2 in the presence of 0.2 molar eq. of dppb ligand led to Pt/dppb/H2 NPs that are homogenous and well-dispersed with a mean diameter size of 2.0 ± 0.2 nm (Fig. 2). These preformed NPs were further reacted with CO to have coordinated CO molecules at their surface.
 | ||
| Fig. 2 TEM image and the size histogram (inlet) of Pt/dppb/H2 NPs. | ||
High-resolution transmission electron microscopy (HRTEM) analyses of Pt NPs are presented in Fig. 3. Fast Fourier transformation (FFT) analysis of a Pt/PVP/13CO NP allowed us to measure D hkl values, D1 = 0.224 nm, D2 = 0.209 nm, and D3 = 0.197 nm, corresponding to the face centered cubic (fcc) structure in the [011] direction (Fig. 3(a)). HRTEM analysis of a nanoparticle chosen in a spherical agglomerate containing the larger (ca. 2.0 nm) NPs of Pt/dppb/13CO NPs shows similar crystalline features as for Pt/PVP/13CO NPs, with measured D hkl values of D1 = 0.226 nm, D2 = 0.223 nm, and D3 = 0.199 nm (Fig. 3(b)). FFT analysis of the micrographs of Pt/dppb/H2 NPs allowed us to measure D hkl values of D1 = 0.221 nm, D2 = 0.232 nm, and D3 = 0.191 (Fig. 3(c)). All the NPs studied, regardless of the difference in the synthetic conditions in terms of the stabilizing agent and gas used, are mainly single crystalline with a fcc structure. D hkl values are in good agreement with the theoretical values of 111, 111 and 002 atomic planes of the fcc crystal structure.35
 | ||
| Fig. 3 (a) HRTEM image and inverted micrograph image (inlet) of a nanocrystal of (a) Pt/PVP/13CO NPs, (b) Pt/dppb/13CO NPs, and (c) Pt/dppb/H2 NPs. Each scale refers to 2 nm. | ||
The fcc crystal structure and mean diameter of the Pt NPs were largely confirmed by the wide-angle X-ray scattering (WAXS) analyses. In the reciprocal space, the patterns above 14° in 2 theta are very similar for all NPs and point to the fcc structure of bulk platinum without any significant change in the cell parameters (see Fig. ESI3†). Pt/PVP/13CO NPs produce a broader pattern, consistent with an assembly of smaller Pt particles very close in size with an average value for crystalline domains close to 1.1 nm. Pt/dppb/H2 NPs display the most regular structure whereas Pt/dppb/13CO NPs exhibit both a broad background and sharper peaks. Accordingly, the radial distribution function (RDF) obtained after Fourier transformation of the data displays a set of well resolved peaks for Pt/dppb/H2 NPs, in good agreement with a regular fcc structure (Fig. 4). The coherence length points to an average size close to 1.8 nm for crystalline domains. WAXS results obtained for Pt/dppb/H2 and Pt/PVP/13CO NPs are in perfect agreement with those obtained for colloids previously synthesized under very similar conditions.30 Pt/dppb/13CO is more complex. The fast decrease of amplitude for small r values points to small particles much like in Pt/PVP/13CO but distances then extend at least up to 2.0 nm, thus indicating another contribution from larger or better crystallized particles with at least one dimension of crystalline domains reaching 2.0 nm. This likely indicates a bimodal distribution, as observed by TEM. The observed superstructures include NPs not only agglomerated, but also merged in a larger metallic network. Distances in the range of 0.3–0.6 nm are also significantly distorted compared to that of Pt/PVP/13CO and indicate a less perfect fcc organization, likely in relation with structural disorder in imperfectly merged NPs. Interestingly, a previous WAXS study on NPs synthesized under close conditions with only CO as the surface ligand, not dppb, also evidenced the need to introduce two different sizes to adequately fit experimental results.19
 | ||
| Fig. 4 RDFs of Pt/PVP/13CO NPs, Pt/dppb/13CO and Pt/dppb/H2 NPs. | ||
As observed by HRTEM analysis, Pt/dppb/H2 NPs are very well-crystallized and single crystalline in nature both before and after the exposure to 13CO atmosphere. Enhanced amplitude observed in the RDF after adsorption of 13CO on the surface indicates a small but significant improvement of the crystallization. Since the metal–ligand composition of the NPs is the same, this is most likely the indication of a better structural order of the Pt atoms of the outer shells of the NPs induced by the CO adsorption (see Fig. ESI4†).
Fig. 5 displays the FTIR spectra of both Pt/PVP/13CO and Pt/dppb/13CO NPs. In the IR spectrum of Pt/PVP/13CO NPs, the region below 1500 cm−1 and the broad peak around 3000 cm−1 are characteristic of the PVP polymer (Fig. 5(a)). In addition, the strong adsorption band at ca. 1700 cm−1 corresponds to the vibrations arising from the carbonyl groups of the PVP polymer. The band at 2005 cm−1 is attributed to 13CO molecules coordinated on the Pt NP surface in terminal mode whereas the one at 1830 cm−1 may arise from bridging mode. This is in agreement with previous results where Pt/PVP/CO NPs synthesized under 1 bar of 12CO displayed two bands at 2043 cm−1 and 1870 cm−1.30
 | ||
| Fig. 5 FTIR spectroscopy data of (a) Pt/PVP/13CO NPs and (b) Pt/dppb/13CO NPs. | ||
The 40 cm−1 difference between Pt/PVP NPs synthesized under 12CO and 13CO is in agreement with the expected shift to lower frequencies as the total mass of CO increases, in correspondence with Hooke's law.36 It has been previously reported that CO adsorbs predominantly on linear on-top sites with a low occupancy of bridging sites for polymer-stabilized and supported Pt NPs.7,37 Several studies on CO adsorption of single crystals were made using spectroscopic techniques.37–41 Two stretching vibrations for adsorbed CO were observed on Pt(111) crystal surfaces, near 2100 cm−1 and at 1870 cm−1, assigned to on-top and bridging positions, respectively.39
Pt/dppb/13CO NPs exhibit one strong broad 13CO band at 1962 cm−1 attributed to linear mode and two other bands at 1820 and 1745 cm−1 which are in the region expected for the bridging mode (Fig. 5(b)). The terminal 13CO vibrations of Pt/PVP/13CO NPs are higher in frequency by 43 cm−1 than those of Pt/dppb/13CO NPs. This is mostly due to the higher coverage of 13CO on the clean surface of the Pt/PVP/13CO NPs compared to the surface of Pt NPs with coordinating ligands. Both IR results and the liquid NMR studies confirm the lack of molecular clusters in our Pt/dppb/13CO NP system (see Fig. ESI5 and ESI6†).42,43
In order to coordinate CO molecules on the surface, Pt/dppb/H2 NPs were treated under 12CO atmosphere at different reaction times. After 2 h of 0.5 bar of 12CO adsorption, the IR spectrum displays two individual bands centered at 2014 cm−1 and 1789 cm−1 (Fig. 6). These 12CO vibrations correspond to 1970 cm−1 and 1749 cm−1 when calculated for 13CO.36 With 64 h of CO adsorption, the band at 2014 cm−1 shifts to higher frequencies up to 2039 cm−1 (ν(13CO) ∼ 1994 cm−1) with an increase in intensity. This band is assigned to vibrational transitions of adsorbed CO in terminal sites on the NP surface. The weaker band at 1789 cm−1 most likely results from the bridging carbonyl stretching vibrations and it does not alter much with increasing CO adsorption with time.
 | ||
| Fig. 6 FTIR spectra of Pt/dppb/H2 NPs before and after CO adsorption. | ||
Coordination of CO on the Pt NPs was monitored by magic-angle spinning (MAS) NMR with and without 1H–13C cross-polarization (CP). Previous solid-state NMR studies on Ru/PVP NPs have shown that CO molecules are dynamic on the surface whereas the presence of coordinated ligands such as dppb on the surface prevents the exchange between the bridging and terminal CO groups.21
Fig. 7 displays the 13C MAS-NMR and 1H–13C CP MAS-NMR of Pt/PVP/13CO NPs. Multiple peaks between 0 and 50 ppm and the single peak at 175 ppm are due to the stabilizing polymer, PVP. The weak singlet at 125 ppm is most likely due to CO2 molecules formed on the surface upon oxidation of CO during the synthesis. The two bands at 193 ppm and 208 ppm both correspond to terminal CO ligands; the upfield one being possibly a multicarbonyl mode.
 | ||
| Fig. 7 (a) 13C-MAS NMR and (b) 1H–13C CP MAS-NMR of Pt/PVP/13CO NPs (4 mm rotor; spin rate 12 kHz). | ||
The low intensity of the spinning side bands in the solid-state NMR spectra of Pt/PVP/13CO NPs may be an indication of some mobility of the CO molecules on the metal surface. However the CO modes do not interconvert and are far from being as mobile as in the ruthenium case. Upon cross polarization, these CO bands almost disappear, indicating that the surface is free from hydrogen atoms close to the CO molecules. This is not surprising since PVP only provides a steric stabilization around the NPs. This is similar to the behavior of Ru/PVP/H2 NPs upon CO adsorption where the CO bands were hardly observed in the 1H–13C CP MAS-NMR spectrum, also due to the absence of nearby hydrogens.21 However, the presence of two signals corresponding to two different coordination modes of CO on the Pt surface relative to the observation of only a single peak for that on the Ru surface at high CO coverage is a good indication that CO molecules adsorbed on the Pt metal surface are not mobile. This may be due to the stronger π-back donation from Pt to CO compared to that from Ru.16
The 13C MAS-NMR spectrum of Pt/dppb/13CO NPs shows signals at 25 ppm, 128 ppm, 184 ppm, 195 ppm, 219 ppm and 258 ppm (Fig. 8(a)). The two singlets at 25 ppm and 128 ppm are due to the methylene and phenyl carbons of the dppb ligand, respectively, while the other peaks can be attributed to the coordinated CO. There are well-defined spinning side bands in the spectra. In addition, upon cross-polarization transfer from 1H to 13C, CO bands are still observed with a slight decrease whereas these signals disappear on Pt/PVP/13CO NPs. Therefore, CO coordinated on the Pt/dppb/13CO NP surface is even less mobile than that on Pt/PVP/13CO NPs, a behavior also observed for Ru/dppb NPs compared to Ru/PVP NPs, and CO groups are located in the vicinity of protons, the source of which are the phosphine ligands.21
 | ||
| Fig. 8 (a) 13C-MAS NMR and (b) 1H–13C CP MAS-NMR of Pt/dppb/13CO NPs (4 mm rotor with a Teflon spacer; spin rate 12 kHz). | ||
Bradley et al. reported that the chemical shift of the adsorbed terminal CO was 192 ppm for Pt/PVP NPs.11 Here, the complication of the data and the multiple peaks observed are due to a metal surface saturated with dppb and 13CO ligands, possessing different local environments, hence different modes of CO coordination and different extents of backdonation from the Pt metal to CO. The broad peak at ca. 258 ppm is characteristic of a bridging mode of CO whereas the peaks at 219 ppm, 195 ppm and 184 ppm are due to the terminal and multicarbonyl COs adsorbed on the Pt NP surface. Lowering the temperature did not lead to significant changes in the spectra (see Fig. ESI7–ESI10†).
A broad peak centered at 44 ppm is visible on the 1H–31P CP MAS-NMR data for Pt/dppb/13CO NPs. It is shifted downfield compared to Pt/dppb/H2 NPs which resonate at 21 ppm (Fig. 9).
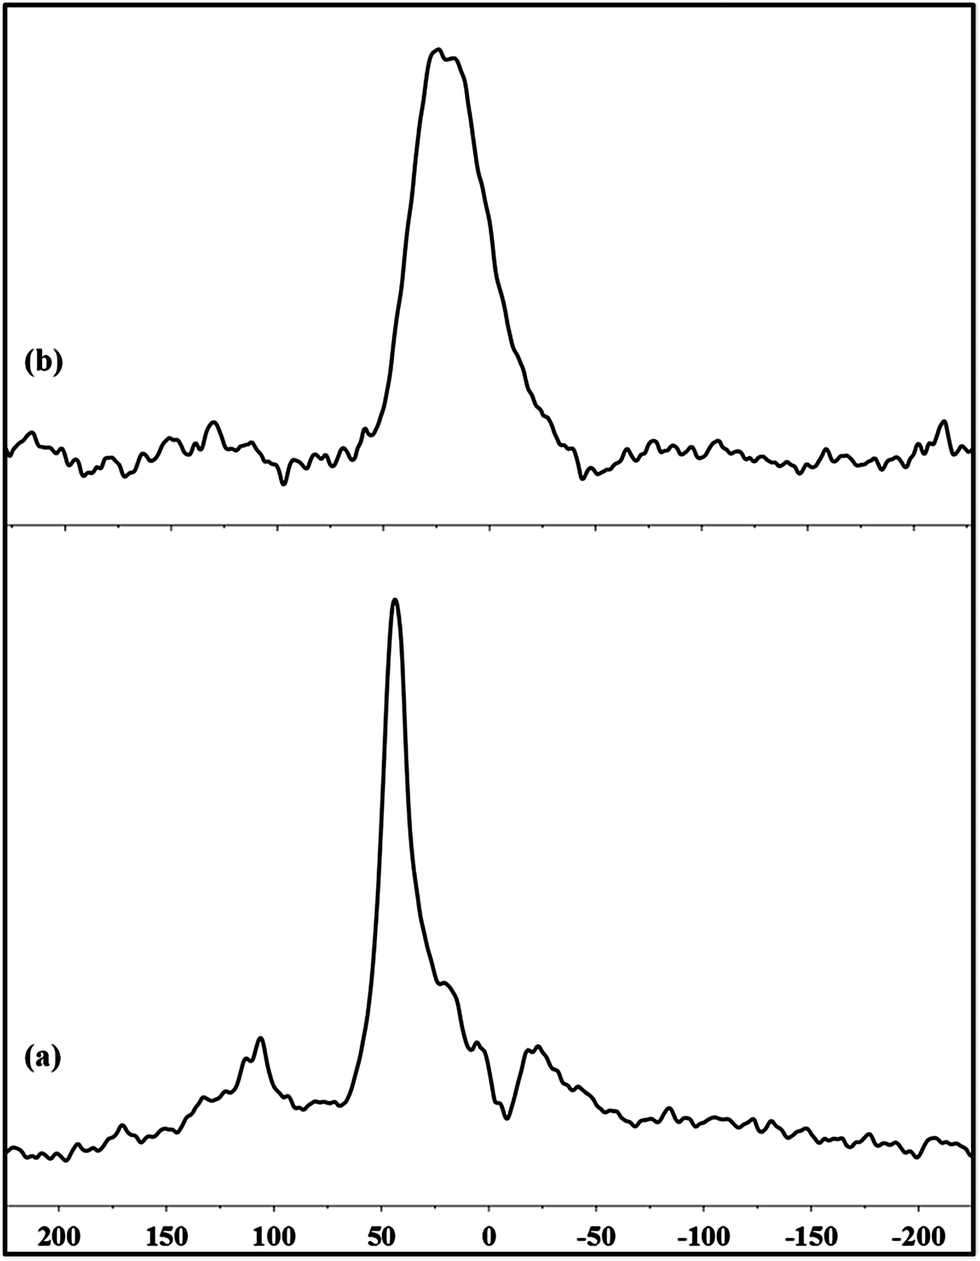 | ||
| Fig. 9 1H–31P CP MAS-NMR of (a) Pt/dppb/13CO NPs (4 mm rotor with a Teflon spacer; spin rate 10 kHz) and (b) Pt/dppb/H2 NPs (2.5 mm rotor with a Teflon spacer; spin rate 16 kHz). | ||
Fig. 10 presents the 1H–13C MAS-NMR spectra of Pt/dppb/H2 NPs before and after the adsorption of 13CO molecules. After 2 h of reaction with 13CO (0.5 bar; r.t.), the NMR spectrum of Pt/dppb/H2 NPs displays a broad peak at ca. 188 ppm (Fig. 10(b)). After 24 h of reaction with 13CO (0.5 bar; r.t.), a broader peak above 200 ppm is observed. This region is known to correspond to bridging CO molecules for Ru NPs.21 After 3 days under 13CO (1 bar; r.t.), three different signals may be observed near 198 ppm, 226 ppm and 254 ppm, at chemical shifts similar to the results achieved from Pt/dppb/13CO NPs, where the surface is saturated with 13CO molecules, but much broader and displaying much lower intensity (Fig. 10(e)).
 | ||
| Fig. 10 1H–13C CP MAS-NMR of Pt/dppb/H2 NPs with (a) 0 h, (b) 2 h, and (c) 24 h of 0.5 bars of 13CO adsorption, (d) 48 h of 1 bar and (e) 3 days of 1 bar of 13CO adsorption (taken with a 2.5 mm rotor with a spin rate of 16 kHz). | ||
This lack of sensitivity can arise from two factors: the presence of Knight shift, i.e. free electrons broadening the resonances of the coordinated ligands or the presence of a surface dynamics, ligands being mobile at the surface. The width of the 31P resonance of Pt/dppb/H2 suggests the presence of a broadening due to Knight shift which also explains the width of the CO signals observed in 13C MAS-NMR spectra. Thus, these CO groups which do not have protons nearby are even more difficult to observe. This, in turn, suggests that the 13C and 31P spectra observed for Pt/dppb/13CO arise from the small (1.2 nm) and not from the large (2.0 nm) NPs. Therefore, this result evidences a modification of the electronic configuration of the NPs between 1.2 nm and 2.0 nm.
As in the case of Ru, in the absence of an ancillary ligand, the small Pt/PVP/13CO NPs display only terminal CO groups. In contrast to Ru, no exchange has been observed between terminal and bridging CO. This may result from two factors: the small size of the particles which does not allow the formation of extended faces and the stronger coordination of CO to Pt due to a better backbonding.16 When a phosphine ligand is added, the spectrum evidences again both the lack of fluxionality of the CO groups and the presence of a bridging CO signal. This signal, relatively enhanced compared to the terminal ones in the cross polarization mode in the NMR spectrum, can be due to CO forced to adopt a bridging configuration by the presence of a nearby phosphine ligand.
Conclusions
In this paper, we described three nanosystems with different sizes: Pt/PVP/13CO (monomodal: 1.2 nm), Pt/dppb/13CO (bimodal: 1.2 and 2.0 nm) and Pt/dppb/H2 (monomodal: 2.0 nm). Pt/dppb/13CO presents a case where the contribution of the smaller NPs in the system is spectroscopically evidenced by the observation of strong terminal CO peaks in the MAS-NMR spectrum. The presence of exclusively terminal CO groups in the small particles is in agreement with the absence of extended faces. It is interesting to note the existence of three different resonances which do not exchange and can be compared to three chemical environments for CO. It is difficult to assign them but they are likely due to different nature of Pt environments (apex, edges, faces). Addition of an ancillary ligand, in the present case a diphosphine, can however force CO to adopt a bridging mode.No fluxionality was observed but the difficulty to observe the signals of coordinated CO and the width of the 31P signal of the phosphines for 2.0 nm NPs strongly suggest a difference in the electronic state of the Pt NPs between 1.2 nm and 2.0 nm which could be interpreted as the appearance of Knight shift.
Acknowledgements
The authors thank Y. Coppel, and V. Collière for solid-state NMR measurements and HRTEM analysis, respectively. Financial support was provided by CNRS and the Nanosonwings Grant (246763) of European Research Council.Notes and references
- G. A. Somorjai and J. Y. Park, Chem. Soc. Rev., 2008, 37, 2155 RSC.
- Transition Metal Nanoparticles in Catalysis, Nanoparticles in Catalysis, ed. D. Astruc, Wiley-VCH, Weinheim, 2008 Search PubMed.
- A. Roucoux and K. Philippot, Hydrogenation with Noble Metal Nanoparticles, Handbook of Homogeneous Hydrogenations, Wiley-VCH, Weinheim, 2007 Search PubMed.
- G. A. Somorjai, H. Frei and J. Y. Park, J. Am. Chem. Soc., 2009, 131, 16589 CrossRef CAS PubMed.
- G. Schmid, Chem. Rev., 1992, 92, 1709 CrossRef CAS.
- G. A. Schmid and L. F. Chi, Adv. Mater., 1998, 10, 515 CrossRef CAS.
- D. de Caro and J. S. Bradley, New J. Chem., 1998, 22, 1267 RSC.
- D. de Caro and J. S. Bradley, Langmuir, 1998, 14, 245 CrossRef CAS.
- J. Grunes, J. Zhu, M. C. Yang and G. A. Somorjai, Catal. Lett., 2003, 86, 157 CrossRef CAS.
- P. Deshlahra, K. Pfeifer, G. H. Bernstein and E. E. Wolf, Appl. Catal., A, 2011, 391, 22 CrossRef CAS.
- J. S. Bradley, J. M. Millar, E. W. Hill and S. Behal, J. Catal., 1991, 129, 530 CrossRef CAS.
- J. S. Bradley, J. M. Millar and E. W. Hill, J. Am. Chem. Soc., 1991, 113, 4016 CrossRef CAS.
- J. S. Bradley, E. W. Hill, S. Behal, C. Klein, B. Chaudret and A. Duteil, Chem. Mater., 1992, 4, 1234 CrossRef CAS.
- J. S. Bradley, E. W. Hill, C. Klein, B. Chaudret and A. Duteil, Stud. Surf. Sci. Catal., 1993, 75, 969 CrossRef CAS.
- J. S. Bradley, J. M. Millar, E. W. Hill, S. Behal, B. Chaudret and A. Duteil, Faraday Discuss., 1991, 92, 255 RSC.
- A. Fielicke, P. Gruene, G. Meijer and D. M. Rayner, Surf. Sci., 2009, 603, 1427 CrossRef CAS.
- (a) L. R. Becerra, C. A. Klug, C. P. Slichter and J. H. Sinfelt, J. Phys. Chem., 1993, 97, 12014 CrossRef CAS; (b) T. M. Duncan, K. W. Zilm, D. M. Hamilton and T. W. Root, J. Phys. Chem., 1989, 93, 2583–2590 CrossRef CAS.
- C. Amiens, D. De Caro, B. Chaudret, J. S. Bradley, R. Mazel and C. Roucau, J. Am. Chem. Soc., 1993, 115, 11638 CrossRef CAS.
- A. Rodriguez, C. Amiens, B. Chaudret, M.-J. Casanove, P. Lecante and J. S. Bradley, Chem. Mater., 1996, 8, 1978 CrossRef CAS.
- C. Dybowski and S. Bai, Anal. Chem., 2008, 80, 4295 CrossRef CAS PubMed.
- F. Novio, K. Philippot and B. Chaudret, Catal. Lett., 2010, 140, 1 CrossRef CAS.
- P. Lara, O. Rivada-Wheelaghan, S. Conejero, R. Poteau, K. Philippot and B. Chaudret, Angew. Chem., Int. Ed., 2011, 50, 12080 CrossRef CAS PubMed.
- T. Perry, K. Pelzer, G. Buntkowski, K. Philippot, H.-H. Limbach and B. Chaudret, ChemPhysChem, 2005, 6, 605 CrossRef PubMed.
- J. Gárcia-Antón, M. R. Axet, S. Jansat, K. Philippot, B. Chaudret, T. Pery, G. Buntkowsky and H.-H. Limbach, Angew. Chem., Int. Ed., 2008, 47, 2074 CrossRef PubMed.
- N. R. Shiju and V. V. Guliants, Appl. Catal., A, 2009, 356, 1–17 CrossRef CAS.
- Z. Peng and H. Yang, Nano Today, 2009, 4, 143 CrossRef CAS.
- A. D. Taylor, R. C. Sekol, J. M. Kizuka, S. D'Cunha and C. M. Comisar, J. Catal., 2008, 259, 5 CrossRef CAS.
- F. Şen and G. Gőkağaç, J. Phys. Chem. C, 2007, 111, 1467 Search PubMed.
- I. Favier, S. Massou, E. Teuma, K. Philippot, B. Chaudret and M. Gómez, Chem. Commun., 2008, 3296 RSC.
- F. Dassenoy, K. Philippot, T. O. Ely, C. Amiens, P. Lecante, E. Snoeck, A. Mosset, M.-J. Casanove and B. Chaudret, New J. Chem., 1998, 22, 703 RSC.
- K. Philippot and B. Chaudret, C. R. Chim., 2003, 6, 1019 CrossRef CAS.
- P. Lara, M.-J. Casanove, P. Lecante, P.-F. Fazzini, K. Philippot and B. Chaudret, J. Mater. Chem., 2012, 22, 3578 RSC.
- P. Lara, T. Ayvali, M.-J. Casanove, P. Lecante, A. Mayoral, P.-F. Fazzini, K. Philippot and B. Chaudret, Dalton Trans., 2013, 42, 372 RSC.
- K. Moseley and P. M. Maitlis, J. Chem. Soc. D, 1971, 982 RSC.
- S. Hovmőller and X. Zou, Microsc. Res. Tech., 1999, 46, 147 CrossRef.
- R. M. Silverstein, G. C. Bassler and T. C. Morrill, Spectrometric Identification of Organic Compounds, John Wiley & Sons, 4th edn, 1981. Derived from Hooke's law:
 . ν = The vibrational frequency (cm−1), C = velocity of light (cm sec−1), F = force constant of bond (dynes cm−1), Mx and My = mass (g) of atom x and atom y, respectively. Therefore ν(13CO) is equal to [0.978 ν(12CO)].
 - N. Sheppard and T. T. Nguyen, in Advances in Infrared and Raman Spectroscopy, ed. R. J. Clarke and R. E. Hester, Heyden and Son, London, 1978 Search PubMed.
- G. Ertl, M. Neumann and K. M. Streit, Surf. Sci., 1977, 64, 393 CrossRef CAS.
- H.-J. Krebs and H. Lűth, Appl. Phys., 1977, 14, 337 CAS.
- B. E. Hayden and A. M. Bradshaw, Surf. Sci., 1983, 125, 787 CrossRef CAS.
- E. Carrasco, A. Aumer, M. A. Brown, R. Dowler, I. Palacio, S. Song and M. Sterrer, Surf. Sci., 2010, 604, 1320 CrossRef CAS.
- J. C. Calabrese, L. F. Dahl, P. Chini, G. Longoni and S. Martinengo, J. Am. Chem. Soc., 1974, 96, 2614 CrossRef CAS.
- A. J. Dickinson, L. P. L. Carrette, J. A. Collins, K. A. Friedrich and U. Stimming, Electrochim. Acta, 2002, 47, 3733 CrossRef CAS.

Footnote |
| † Electronic supplementary information (ESI) available: Synthesis of the Pt(dba)2 precursor, TEM images of Pt/PVP/H2 and Pt/dppb/13CO NPs, further results from WAXS studies, solution NMR spectra of Pt/dppb/13CO NPs and MAS-NMR spectra of Pt/dppb/13CO and Pt/dppb/H2 NPs at 260 K. See DOI: 10.1039c3nr03948j |
| This journal is © The Royal Society of Chemistry 2014 |