DOI:
10.1039/C3NJ00979C
(Paper)
New J. Chem., 2014,
38, 406-418
TTF–fluorene dyads and their M(CN)2− (M = Ag, Au) salts designed for photoresponsive conducting materials†
Received
(in Montpellier, France)
22nd August 2013
, Accepted 4th November 2013
First published on 5th November 2013
Abstract
To explore photoresponsive conducting materials, we developed new tetrathiafulvalene (TTF)–fluorene D–A dyads with a σ-bonded thiomethylene spacer (1a–d) or a π-conjugated ethylene spacer (2a–b) and reported their synthesis, electrochemical and optical properties. Fluorescence studies suggested that the fluorescence from an excited fluorene part is quenched by an intramolecular electron transfer process from the electron-donating TTF part to the fluorene part, and the intramolecular interaction through the π-conjugated ethylene spacer is stronger and shows more suppression than the non-planar σ-bonded thiomethylene spacer. We also investigated photoelectric conversion functionality by a photoelectrochemical method using the thin films of dyads 1–2 spin-coated on ITO-coated glass substrates. We observed electric current generation that depends on the absorption spectra of thin films, suggesting that absorbed photons are converted to electric currents on the thin film/ITO electrode. Crystal structure analysis and measurement of photoconductivity of a single crystalline sample of molecule 1d having 4,5-bis(methylthio)-substituents suggest generation of photocurrents along the stacking direction of the TTF parts by the photoinduced intramolecular electron transfer and the resultant charge-separated state. Furthermore, we also reported the crystal structure analyses, photoconductivity and magnetic properties of the cation radical salts, 2b2M(CN)2 (M = Ag, Au), where 2b contains a 4,5-ethylenedithio-substituent. The Ag(CN)2 salt showed a semiconducting behaviour with a room temperature conductivity of 0.088 S cm−1 due to a half-filled Mott insulating band structure of this crystal that originates from a strongly dimerized intermolecular interaction. Upon photoirradiation, this salt showed a slight enhancement of conductivities of ca. 14%.
1. Introduction
Recently, numerous research studies have concentrated on the development of new functional organic conductors, in which external stimuli such as photoexcitation, magnetic field and electric field can change electronic states of target organic conductors and cause drastic phase transitions, and have created unprecedented materials such as magnetic field-induced organic superconductors, field effect transistors and organic thrysters.1–4 Among them, pulsed laser photoexcitation of an insulating [Cu(DCNQI)2] (DCNQI = 2,5-dimethyl-N,N-dicyanoquinonediimine) salt cancelled a Peierls distortion of the crystal lattice of this salt and caused an ultrafast and highly efficient photocarrier generation below 20 ps.5 Furthermore, a cation radical salt, (EDO-TTF)2PF6 (EDO-TTF = ethylenedioxy-tetrathiafulvalene), exhibited an ultrafast photoinduced phase transition from a charge-ordered insulating phase to a metal phase within 1.5 ps around room temperature.6 In these salts, strong electron–lattice couplings that are characteristic of organic conductors played important roles in inducing efficient “photo-domino” insulator-to-metal phase transitions. These responses made organic conducting materials quite attractive for the application to switching devices that can operate very quickly at room-temperature and encouraged us to explore new organic materials that show outstanding photoresponsivities.
For the development of photofunctional materials, donor–acceptor (D–A) type dyads based on TTF frameworks have also been extensively studied to create new functional organic materials such as fluorescence-based chemical sensors, photovoltaic cells and NLO organic crystals.7–14 Several TTF-C60 dyads have been investigated as photofunctional materials because the C60 moiety shows fast charge separation and slow charge combination in the photoinduced excited state that are preferable for the application to solar cells.15–17 On the other hand, to investigate photoinduced conducting crystalline materials, we have also studied crystal structures and electrochemical, optical and conducting properties of several TTF-based D–A dyads combined with fluorescent molecules such as 2,5-diphenyl-1,3,4-oxadiazole (PPD),18,19 1,3-benzothiazole (BTA),20,21 and 4,4-difluoro-4-bora-3a,4a-diaza-s-indacene (BODIPY),22 because these fluorescent parts have planar π-electron frameworks that are indispensable for the formation of effective π-stacking columnar structures, considering the difficulty in the cases of TTF dyads containing a bulky C60 molecule. We have reported photocurrent generation based on single crystalline samples of these D–A dyads, and found that preferable π-stacking structures of the TTF moieties and formation of photoinduced charge-separated states between the TTF moieties and fluorescent parts are quite important factors influencing photoconductivity.19 Among them, we recently focused on fluorene derivatives because fluorene is well-known as a strongly fluorescent π-electron framework in the fields of polymer-based electroluminescent materials and solar cells,23–26 and D–A dyads containing TTF and 2,5,7-trinitrofluorene derivatives showed interesting charge-transfer interactions.27,28 We used fluorene as an antenna for photoexcitation as in the cases of porphyrins combined with fluorenyl pendants29,30 because of its highly fluorescent character and high planarity. We synthesized new TTF–fluorene D–A dyads with a σ-bonded thiomethylene spacer (1a–d) or a π-conjugated ethylene spacer (2a–b) (Chart 1) to create photoresponsive materials such as photoinduced conductors and photoelectric conversion materials.31 In this paper, we report synthesis, electrochemical and optical properties, photoelectric conversion functionality of dyads 1a–d, 2a–b, and crystal structure analysis and photoconductivity of a single crystalline sample of molecule 1d. Furthermore, we will also report on the crystal structure analyses, photoconductivity and magnetic properties of the cation radical salts, 2b2M(CN)2 (M = Ag, Au).
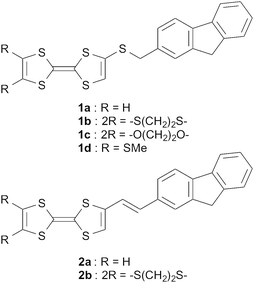 |
| | Chart 1 Molecular structures of dyads 1a–d and 2a–b. | |
2. Experimental section
2.1 General
THF was freshly distilled under N2 over sodium/benzophenone. Benzene was distilled under N2 over calcium hydride. CCl4 was distilled under N2 over P2O5. 2-Hydroxylmethyl-fluorene was synthesized according to the reported method.29 Other chemical reagents were purchased and used without further purification. NMR spectra were recorded using a JEOL JNM-400 400 MHz spectrometer. High-resolution mass spectra (HRMS) using EI+ and FAB+ methods were recorded on a JEOL JMS-700 mass spectrometer. IR spectra were recorded on KBr pellets using a JASCO FT/IR-4100.
2.2 Synthesis
2-Bromomethyl-fluorene (4)29.
2-Hydroxylmethyl-fluorene (196 mg, 1.00 mmol) was dissolved in a dry CCl4–dry THF mixed solvent (10 mL, v/v = 1/1) under N2. After cooling the mixture to −10 °C, phosphorus tribromide (40 μL, 0.37 mmol) in dry CCl4 (0.19 mL) was added dropwise for 15 min and the reaction flask was warmed to room temperature and stirred for 9 h. After evaporation of solvents, the residue was extracted with chloroform, washed with water and dried with sodium sulfate. After filtration of the drying reagent, the filtrate was evaporated in vacuo, and the residue was purified by column chromatography on silica gel with chloroform as an eluent. 2-Bromomethyl-fluorene (4) was obtained as white powder (187 mg, 0.72 mmol) in 72% yield after recrystallization from chloroform–n-hexane.
1H NMR (400 MHz, DMSO-d6) δ 7.89 (dd, J1 = 8.4 Hz, J2 = 8.4 Hz, 2H), 7.65 (s, 1H), 7.59 (d, J = 7.2 Hz, 1H), 7.47 (dd, J1 = 7.6 Hz, J2 = 1.6 Hz, 1H), 7.39 (dd, J1 = 7.2 Hz, J2 = 7.2 Hz, 1H), 7.33 (td, J1 = 7.6 Hz, J2 = 1.6 Hz, 1H), 4.81 (s, 2H), 3.96 (s, 2H).
Compound 1a.
4-(2′-Cyanoethylthio)-TTF32 (74 mg, 0.26 mmol) was dissolved in dry DMF and cooled to 0 °C under N2. A 28 wt% methanolic solution of sodium methoxide (0.34 mmol) was added and the colour of solution changed to dark brown. After stirring at 0 °C for 15 min, 2-bromomethyl-fluorene (4) (101 mg, 0.39 mmol) was added and stirred for 10 h at room temperature. After evaporation of solvents, the residue was purified by column chromatography on silica gel with chloroform as an eluent. Compound 1a was obtained as orange powder (57 mg, 0.14 mmol) in 53% yield after recrystallization from chloroform–n-hexane.
mp. 129–130 °C (dec.); 1H NMR (400 MHz, acetone-d6–CS2) δ 7.78 (d, J = 7.3 Hz, 1H), 7.75 (d, J = 7.8 Hz, 1H), 7.54 (d, J = 7.3 Hz, 1H), 7.50 (s, 1H), 7.26–7.37 (m, 3H), 6.53 (s, 2H), 6.33 (s, 1H), 4.11 (s, 2H), 3.90 (s, 2H); IR (KBr) ν (cm−1) 645, 716, 745, 774, 794, 840, 937, 1403, 1422, 1454, 3064; EI-HRMS m/z calcd for C20H14S5: 413.9699; found: 413.9718 [M+].
Compounds 1b, 1c, 1d were synthesized by the same method as compound 1a.
Compound 1b.
Yield 73%; mp. 51–52 °C (dec.); 1H NMR (400 MHz, acetone-d6–CS2) δ 7.78 (d, J = 7.6 Hz, 1H), 7.74 (d, J = 7.8 Hz, 1H), 7.53 (d, J = 6.8 Hz, 1H), 7.48 (s, 1H), 7.26–7.36 (m, 3H), 6.34 (s, 1H), 4.11 (s, 2H), 3.90 (s, 2H), 3.40 (s, 4H); IR (KBr) ν (cm−1) 736, 770, 828, 930, 1396, 1421, 1453, 3049; FAB-HRMS (matrix: 3-nitrobenzyl alcohol) m/z calcd for C22H16S7: 503.9297; found. 503.9305 [M+].
Compound 1c.
Yield 59%; mp. 142–143 °C (dec.); 1H NMR (400 MHz, acetone-d6–CS2) δ 7.78 (d, J = 7.6 Hz, 1H), 7.75 (d, J = 7.8 Hz, 1H), 7.54 (d, J = 7.3 Hz, 1H), 7.49 (s, 1H), 7.26–7.35 (m, 3H), 6.36 (s, 1H), 4.31 (s, 4H), 4.11 (s, 2H), 3.90 (s, 2H); IR (KBr) ν (cm−1) 718, 741, 868, 950, 1083, 1168, 1197, 1392, 1454, 1509, 1648, 2917, 2938, 2979, 3032, 3087; EI-HRMS m/z calcd for C22H16O2S5: 471.9754; found: 471.9763 [M+].
Compound 1d.
Yield 85%; mp. 118–119 °C (dec.); 1H NMR (400 MHz, acetone-d6–CS2) δ 7.78 (d, J = 7.6 Hz, 1H), 7.75 (d, J = 7.8 Hz, 1H), 7.54 (d, J = 6.9 Hz, 1H), 7.49 (s, 1H), 7.26–7.35 (m, 3H), 6.36 (s, 1H), 4.11 (s, 2H), 3.90 (s, 2H), 2.462 (s, 3H), 2.458 (S, 3H); IR (KBr) ν (cm−1) 734, 770, 896, 926, 1222, 1307, 1394, 1426, 1454, 2915, 3048; FAB-HRMS (matrix: 3-nitrobenzyl alcohol) m/z calcd for C22H18S7: 505.9454; found: 505.9450 [M+].
Compound 2a.
2-Bromomethyl-fluorene (4) (200 mg, 0.77 mmol) and triphenylphosphine (202 mg, 077 mmol) were dissolved in dry benzene (50 mL) under N2 atmosphere. After refluxing for 10 h, diethyl ether (50 mL) was added and the resultant white precipitate was filtered and dried in vacuo to give Wittig reagent 5 in 69% yield.
A 28 wt% methanolic solution of sodium methoxide (0.49 mmol) was added to a suspension of Wittig reagent 5 (87 mg, 0.17 mmol) in dry benzene (20 mL) and stirred for 10 min under N2 at room temperature, while the reaction mixture changed to a red solution. Then, formyl-TTF33 (39 mg, 0.17 mmol) was added to the reaction mixture and stirred for 16 h at room temperature. After filtering off the white precipitate, the filtrate was evaporated in vacuo. The residue was purified by column chromatography on silica gel with chloroform–n-hexane (v/v = 1/1) as an eluent. Compound 2a (35 mg) was obtained as red powder after recrystallization from chloroform–n-hexane in 53% yield.
mp. 196–198 °C (dec.); 1H NMR (400 MHz, acetone-d6–CS2) δ 7.76 (d, J = 6.8 Hz, 1H), 7.75 (d, J = 7.4 Hz, 1H), 7.65 (s, 1H), 7.53 (d, J = 7.4 Hz 1H), 7.46 (d, J = 6.8 Hz, 1H), 7.34 (dd, J1 = 7.4 Hz, J2 = 6.8 Hz, 1H), 7.28 (dd, J1 = 7.4 Hz, J2 = 7.4 Hz, 1H), 7.09 (d, J = 15.8 Hz, 1H), 6.61 (s, 1H), 6.51 (s, 2H), 6.45 (d, J = 15.8 Hz, 1H), 3.91 (s, 2H); IR (KBr) ν (cm−1) 647, 734, 771, 796, 820, 940, 1454, 1530, 3063; EI-HRMS m/z calcd for C21H14S4: 393.9978; found: 393.9994 [M+].
Compound 2b was synthesized by the same method as compound 2a.
Compound 2b.
Yield 43%; mp. 209–210 °C (dec.); 1H NMR (400 MHz, acetone-d6–CS2) δ 7.70 (d, J = 7.3 Hz, 1H), 7.68 (d, J = 7.3 Hz, 1H), 7.58 (s, 1H), 7.49 (d, J = 7.3 Hz, 1H), 7.40 (d, J = 7.3 Hz, 1H), 7.32 (dd, J1 = 7.3 Hz, J2 = 7.3 Hz, 1H), 7.25 (dd, J1 = 7.3 Hz, J1 = 7.3 Hz, 1H), 6.98 (d, J = 15.6 Hz, 1H), 6.49 (s, 1H), 6.43 (d, J = 15.6 Hz, 1H), 3.88 (s, 2H), 3.37 (s, 4H); IR (KBr) ν (cm−1) 732, 768, 823, 940, 1286, 1398, 1420, 1454, 3016; EI-HRMS m/z calcd for C23H16S6: 483.9576; found: 483.9581 [M+].
Preparation of cation radical salts of 2b.
The Ag(CN)2− and Au(CN)2− salts of molecule 2b were prepared as dark purple platelet crystals by a galvanostatic (I = 0.7 μA) oxidation using a conventional U-type electrocrystallization cell in the presence of molecule 2b (5.0 mg) and the corresponding tetra-n-butylammonium salts of the anions (100 mg) as a supporting electrolyte under nitrogen atmosphere in the mixture of dry chlorobenzene and dry ethanol (10 ml, v/v = 1![[thin space (1/6-em)]](https://www.rsc.org/images/entities/char_2009.gif) :
:![[thin space (1/6-em)]](https://www.rsc.org/images/entities/char_2009.gif) 9) at 16 °C for two weeks.
9) at 16 °C for two weeks.
2.3 X-Ray data collection, structure solution and refinement
X-Ray diffraction data were collected for the single crystal of molecule 1d using a Rigaku RAXIS-RAPID imaging plate diffractometer with graphite monochromated Mo-Kα radiation (λ = 0.71075 Å), and for the single crystals of 2b2Ag(CN)2 and 2b2Au(CN)2 using a Rigaku AFC-7 Mercury CCD diffractometer with graphite monochromated Mo-Kα radiation (λ = 0.71070 Å). Lorentz and polarization corrections were applied. The structures of these compounds were solved by a direct method (SIR92),34 expanded by DIRDIF94,35 and refined on F with a full-matrix least squares analysis. The non-hydrogen atoms were refined anisotropically. Hydrogen atoms were refined using the riding model [d(C–H) = 0.95 Å]. All the calculations were performed using the CrystalStructure crystallographic software package of the Molecular Structure Corporation.36 Crystal data and structure refinement parameters are given in Table 1.
Table 1 Crystallographic data for 1d, 2b2Ag(CN)2, and 2b2Au(CN)2
| |
1d
|
2b
2Ag(CN)2 |
2b
2Au(CN)2 |
| Temperature/K |
296 |
293 |
293 |
| Chemical formula |
C22H18S7 |
C24H16NS6Ag0.5 |
C24H16NS6Au0.5 |
| Formula weight |
506.80 |
564.69 |
609.24 |
| Crystal colour, habit |
Orange, platelet |
Dark purple, platelet |
Dark purple, platelet |
| Dimensions, mm |
0.70 × 0.15 × 0.05 |
0.50 × 0.10 × 0.10 |
0.40 × 0.20 × 0.10 |
| Crystal system |
Monoclinic |
Monoclinic |
Monoclinic |
|
a/Å |
17.4587(17) |
4.8941(11) |
4.8963(16) |
|
b/Å |
5.3231(6) |
29.077(7) |
29.144(10) |
|
c/Å |
25.758(2) |
16.270(4) |
16.156(6) |
|
β/° |
106.132(2) |
90.862(3) |
90.918(4) |
|
V/Å3 |
2299.5(4) |
2315.1(9) |
2305.0(13) |
| Space group, Z |
P21/c, 4 |
P21/c, 4 |
P21/c, 4 |
|
ρ
calc/g cm−3 |
1.464 |
1.620 |
1.755 |
|
μ/cm−1 |
6.935 |
10.141 |
37.849 |
|
F
000
|
1048.00 |
1146.00 |
1210.00 |
| 2θmax/° |
54.8 |
61.7 |
61.9 |
| Range of data |
−22 ≤ h ≤ 22 |
−6 ≤ h ≤ 4 |
−4 ≤ h ≤ 6 |
| −6 ≤ k ≤ 6 |
−38 ≤ k ≤ 30 |
−39 ≤ k ≤ 31 |
| −33 ≤ l ≤ 31 |
−21 ≤ l ≤ 19 |
−20 ≤ l ≤ 21 |
| Reflections collected |
19![[thin space (1/6-em)]](https://www.rsc.org/images/entities/char_2009.gif) 165 165 |
20![[thin space (1/6-em)]](https://www.rsc.org/images/entities/char_2009.gif) 816 816 |
20![[thin space (1/6-em)]](https://www.rsc.org/images/entities/char_2009.gif) 926 926 |
| Independent reflections |
5107 (Rint = 0.047) |
6378 (Rint = 0.047) |
6435 (Rint = 0.058) |
| Reflections used |
2482 (I > 2σ(I)) |
2145 (I > 2σ(I)) |
2612 (I > 1.5σ(I)) |
| Number of variables |
280 |
302 |
302 |
| GOF on F |
0.877 |
1.112 |
1.184 |
|
R
1
|
0.0547 (I > 2σ(I)) |
0.0420 (I > 2σ(I)) |
0.0473 (I > 1.5σ(I)) |
| wR2 [I > 2σ(I)] |
0.0850 |
0.0460 |
0.0482 |
2.4 Electrical resistivity, photoconductivity and SQUID measurements
Electrical resistivities were measured on a single crystal of 1d at room temperature by a two-terminal method. Resistivities of single crystalline samples of 2b2Ag(CN)2, and 2b2Au(CN)2 salts were measured by a four-terminal method in the temperature range of 110 to 300 K. Gold wires (15 μϕ) were contacted to single crystals with a gold paste in parallel to the stacking axis of TTF parts. Photoconductivities of these single crystals, namely, increases of electric currents under irradiation were measured by a two-probe method using an ultrahigh resistance meter (ADVANTEST R8340A) and chopped white-light (ca. 1.5 Hz, 300–600 nm) from a 300 W Xe lamp (Asahi Spectra MAX-302) under an application of bias voltage (5 or 50 V) between two terminals. Magnetic susceptibilities were measured in the temperature range of 1.9 to 300 K under an applied field of 10 kOe using a SQUID magnetometer (MPMS-XL, Quantum Design). Paramagnetic susceptibilities (χM) were obtained by subtracting the diamagnetic contribution estimated using Pascal's constants37 from the observed magnetic susceptibilities.
2.5 Measurement of photocurrents generated on thin film samples of dyads spin-coated on ITO substrates
Thin films of dyads were prepared on an ITO-coated soda-lime glass substrate (Aldrich No. 576352 with a surface resistance of 70–100 Ω per sq) by a spin-coating method (spin-coated area: 1.0 cm × 0.8 cm) using 20 μL of 1 g L−1 solution of the dyads in CHCl3 at 2000 rpm for 60 s. The prepared ITO substrates were used as a working electrode. Platinum and Ag/AgCl electrodes were also used as counter and reference electrodes, respectively. These three kinds of electrodes were immersed in 0.5 M aqueous KCl solution, and photocurrents between the working and platinum counter electrodes were measured using a BAS Electrochemical Analyzer Model 612B under irradiation from a 150 W Xe lamp where monochromatized light in the wavelength range from 300 to 730 nm was produced by holographic monochromators using a fluorescence spectrometer JASCO FP-6200.
3. Results and discussion
3.1 Synthesis of 1a–d, 2a–b
Synthesis of TTF–fluorene dyads 1a–d and 2a–b was performed as shown in Scheme 1. Thus, the corresponding 4-(2′-cyanoethylthio)-TTF derivatives 3a–d were prepared according to the reported method.32 The 2-cyanoethylthio protecting group of 3a–d was removed with a 28 wt% methanolic solution of sodium methoxide in dry DMF at 0 °C under nitrogen atmosphere, and the resultant sodium TTF-thiolates were reacted with 2-bromomethyl-fluorene 429 at 0 °C overnight. After the solvents were evaporated in vacuo, the crude mixtures were purified by column-chromatography on silica gel with CHCl3 as an eluent. Compounds 1a–d having a fluorene group through a thiomethylene spacer were obtained in 53%, 73%, 59% and 85% yields, respectively. On the other hand, the Wittig reagent 5 was prepared by the reaction between 4 and triphenylphosphine under benzene reflux. Then, compound 5 was reacted successively with an excess of 28 wt% methanolic solution of sodium methoxide and the corresponding formyl-substituted TTF derivatives 6a–b33 in benzene at room temperature. The solvents were removed in vacuo, and the crude mixtures were separated by column-chromatography on silica gel with CHCl3–n-hexane (v/v = 1/1) as an eluent. Fluorene-substituted compounds 2a and 2b with an ethylene spacer were obtained in 53% and 43% yields, respectively. The coupling constants (J ∼ 15 Hz) of 1H-NMR spectra of compounds 2a and 2b indicated that the ethylene spacer parts of these compounds have a trans-configuration.
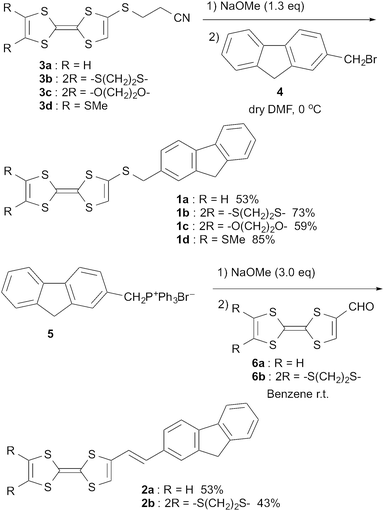 |
| | Scheme 1 Synthesis of dyads 1a–d and 2a–b. | |
3.2 Electrochemical properties of 1a–d, 2a–b
Electrochemical properties of 1a–d, 2a–b were investigated by the cyclic voltammetry technique in benzonitrile at 25 °C. The redox potentials of the dyads are summarized in Table 2 together with those of TTF measured under the identical conditions. All the dyads showed two pairs of one-electron reversible redox waves (E1 and E2) and one irreversible wave (Ered). The E1, E2 and Ered values are almost the same as those of TTF (+0.41 V and +0.80 V) and fluorene (−1.1 V), suggesting that the first and second oxidations occur at the TTF part and the first reduction occurs at the fluorene part, respectively. These results suggest that the HOMO orbital of all compounds mainly locates on the TTF part and they have a good enough electron-donating ability. The first redox potentials of all molecules except for 2a are higher than that of TTF because their TTF parts are substituted by electron-withdrawing alkylthio groups. For the same reason, compounds 2a–b having the ethylene spacer possess better electron-donating abilities (lower E1) than compounds 1a–b having the thiomethylene spacer.
Table 2 Redox potentials of 1a–d, 2a–b, TTF and fluorenea
| Compound |
E
red
|
E
1
|
E
2
|
E
2 − E1 |
|
V vs. Ag/AgCl, 0.1 mol L−1n-Bu4NClO4 in benzonitrile at 25 °C, Pt electrodes, scan rate of 50 mV s−1.
Irreversible step.
|
|
1a
|
−1.1b |
+0.44 |
+0.81 |
0.37 |
|
1b
|
−1.1b |
+0.51 |
+0.83 |
0.32 |
|
1c
|
−1.2b |
+0.45 |
+0.79 |
0.34 |
|
1d
|
−1.1b |
+0.51 |
+0.80 |
0.31 |
|
2a
|
−1.1b |
+0.40 |
+0.79 |
0.39 |
|
2b
|
−1.1b |
+0.48 |
+0.80 |
0.32 |
| TTF |
|
+0.41 |
+0.80 |
0.39 |
| Fluorene |
−1.1b |
|
|
|
3.3 Absorption and fluorescence spectra
UV-Visible absorption spectra of the 10−5 M CHCl3 solutions of compounds 1a–d, 2a–b and the related compounds, TTF, fluorene and styryl–fluorene dyad (7) (Chart 2) were measured at room temperature as shown in Fig. 1 and wavelengths of maximum absorption peaks (λmax) are summarized in Table 3. Compound 1a showed strong absorption maxima at 276 and 309 nm and a weak shoulder maximum around 390 nm, whereas absorption maxima were observed at 312 nm in the case of TTF and at 266 nm in the case of fluorene. Thus, the shape of the absorption spectrum of 1a resembles the overlap of those of TTF and fluorene as shown in Fig. 1(a), suggesting that the intramolecular interaction between the TTF and fluorene moieties is small in 1a. All the compounds 1a–d having a fluorene through a thiomethylene spacer showed almost the same absorption spectra although the substituents on the TTF parts affect the shapes of the spectra around 350 nm to a certain extent as shown in Fig. 1(b). On the other hand, the molecules containing an ethylene spacer 2a–b indicated strong absorption maxima in the longer wavelength region around 340 nm than those of 1a–d (276 nm). Furthermore, they showed relatively strong absorption bands around 400–500 nm that can be assigned to the intramolecular charge-transfer (ICT) transition between the HOMO that localizes on the TTF part to the LUMO that locates on the fluorene part because this shoulder absorption was not observed in both TTF and fluorene. These results suggest that the intramolecular interactions between TTF and fluorene parts in molecules 2a–b are stronger than those in molecules 1a–d due to the π-conjugated electronic structure of molecules 2a–b.
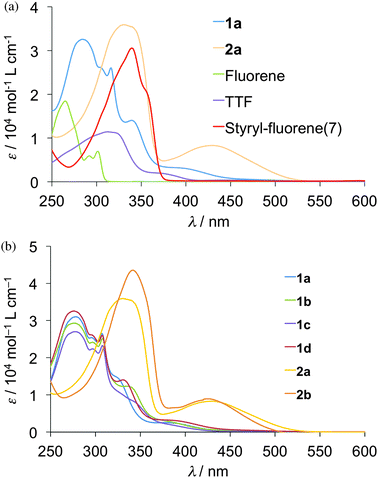 |
| | Fig. 1 UV-vis absorption spectra of 1a–d, 2a–b in 10−5 M CHCl3 solution. | |
Table 3 Wavelength of maximum absorption peaks (λmax), emission peaks (λem) under excitation light (λex), and 0–0 transition energy (E0–0)a
| Molecule |
λ
max/nm |
λ
ex/nm |
λ
em/nm |
E
0–0 (eV) |
|
0–0 transition energy (E0–0) was estimated from the cross position of the absorption and emission spectra.
|
|
1a
|
276, 309, 335, 386 |
278 |
336 |
3.93 |
|
1b
|
277, 310, 340, 385 |
276 |
335 |
3.93 |
|
1c
|
276, 310, 347, 387 |
277 |
332 |
4.03 |
|
1d
|
276, 309, 335, 387 |
276 |
336 |
3.95 |
|
2a
|
340, 438 |
338 |
397, 416 |
3.31 |
|
2b
|
341, 425 |
341 |
397, 416 |
3.29 |
| TTF |
312 |
— |
— |
— |
| Fluorene |
266, 303 |
265 |
339 |
3.88 |
|
7
|
340 |
340 |
373, 385, 419 |
3.44 |
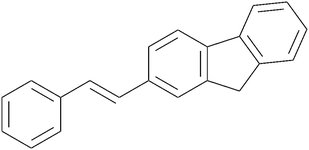 |
| | Chart 2 Structure of styryl–fluorene (7). | |
Emission spectra of the 10−6 M CHCl3 solution of fluorene, compounds 1a, 2a, and styryl–fluorene (7) were measured at room temperature under the identical conditions as shown in Fig. 2. When the solution of fluorene was irradiated by an excitation light of 265 nm that corresponds to its absorption maximum, only a small amount of fluorescence was observed around 340 nm. However, in the case of π-extended fluorene dyad 7, fluorescence was largely enhanced and observed at 373, 385, and 419 nm with an excitation light of 340 nm. Upon excitation of compound 1a having the thiomethylene spacer, almost the same intensity of fluorescence as that of fluorene was observed, suggesting that only a slight suppression of fluorescence occurred due to weak intramolecular interaction between the TTF and fluorene moieties in 1a. On the other hand, in the case of 2a having the π-conjugated ethylene spacer, large suppression (88%) of red-shifted fluorescence was observed as shown in Fig. 2. These results suggest that (1) the fluorescence from the excited fluorene part is quenched by an intramolecular electron transfer process from the electron-donating TTF part to the fluorene part because the fluorene part possesses electron-accepting ability upon excitation and (2) the intramolecular interaction through the π-conjugated ethylene spacer is stronger and shows more suppression than the non-planar σ-bonded thiomethylene spacer. Gibbs free energy ΔGPET for such a photo-induced intramolecular electron transfer process (PET) can be calculated on the basis of the Rehm–Weller equation,38 ΔGPET = e[E1 − Ered] − E0–0 − C, where C is a Coulombic term (∼0.1 eV). Largely negative values for 1 (ca. −2.5 eV) and for 2 (ca. −1.9 eV) suggest that the PET process is thermodynamically favourable in the cases of these dyads 1, 2.
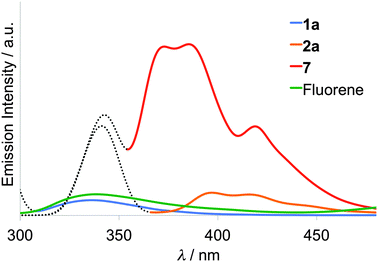 |
| | Fig. 2 Emission spectra of fluorene, 1a, 2a, and styryl–fluorene (7) in 10−6 M CHCl3 solution (dashed line: scattering of excitation light). | |
3.4 Molecular orbital calculation
Molecular orbitals and simulated UV-Vis spectra of compounds 1a and 2a were calculated on the basis of the DFT theory and TD-DFT method (B3LYP/6-31G**) using GAUSSIAN 09 package as shown in Fig. 3 and Fig. S1 and S2 (ESI†).39 In the optimized molecular structure of 1a, TTF and fluorene parts are connected to the thiomethylene spacer in almost completely anti-conformation to each other and arrange stepwise without overlapping of π-electron frameworks, suggesting its weak intramolecular interaction. The HOMO of 1a localizes completely on the TTF part and the LUMO comprises of the π-electron orbital of the fluorene part and the non-bonding orbital of the TTF part. The HOMO – LUMO gap energy is calculated to be 3.57 eV from the energy levels of HOMO (−4.68 eV) and LUMO (−1.11 eV). The TD-DFT calculation suggests that its observed strong absorption around 276 nm and weak shoulder absorption around 386 nm correspond to a strong π–π* transition of the fluorene part at 284 nm and a weak intramolecular charge-transfer (ICT) transition between HOMO and LUMO at 390 nm with a small oscillator strength of f = 0.06, respectively (see ESI,† Fig. S1 and Table S1).
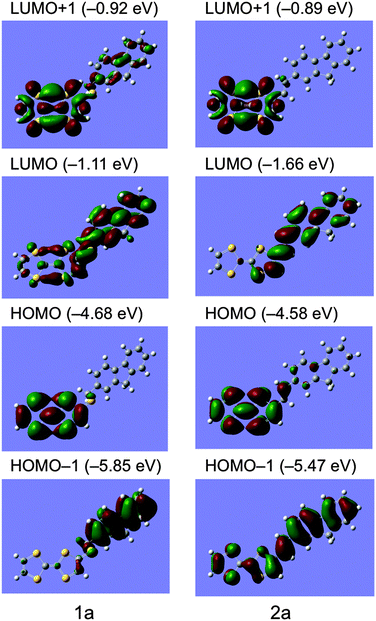 |
| | Fig. 3 Molecular orbitals of compounds 1a and 2a calculated on the basis of the DFT method (B3LYP/6-31G**). | |
On the other hand, the optimized molecular structure of compound 2a has an almost planar π-conjugated framework with a slight boat-form conformation of the TTF part. The HOMO level of 2a (−4.58 eV) is 0.10 eV higher than that of 1a (−4.68 eV), supporting the electrochemical results that 2a has higher donating ability (E1 = +0.40 V) than that of 1a (+0.44 V). The HOMO and LUMO of 2a localize mainly on the TTF and fluorene parts, respectively, however, relatively large atomic coefficients are observed on each counterpart of molecules, suggesting stronger ICT interaction of 2a compared to that of 1a. Indeed, the TD-DFT calculation of 2a indicates that its observed strong absorption around 340 nm and relatively large absorption around 438 nm correspond to a strong π–π* transition of the π-conjugated TTF–fluorene dyad (HOMO − 1 to LUMO) at 348 nm and an intramolecular charge-transfer (ICT) transition between HOMO and LUMO at 494 nm with a larger oscillator strength of f = 0.22 than those of 1a (0.06), respectively (see ESI,† Fig. S2 and Table S2). These calculations also support the results of the fluorescence quenching behaviours that compound 2a has a stronger ICT interaction and shows larger quenching of fluorescence due to the photoinduced intramolecular electron transfer process mentioned above.
3.5 Photoelectric conversion functionalities of thin films
Measurements of photocurrents generated on thin film samples of dyads 1a–d and 2a–b were performed by a photoelectrochemical method to examine the photoelectric conversion functionality of the synthesized TTF–fluorene dyads. Thin films of the dyads were spin-coated on an ITO-glass substrate and these ITO substrates were used as a working electrode. Photocurrents between the working and platinum counter electrodes were measured in 0.5 M aqueous KCl solution under irradiation from a 150 W Xe lamp. As shown in the photocurrent action spectra for the thin films of 1a and 2a (Fig. 4a and b), positive photocurrent generation was observed under −0.30 V bias voltage vs. Ag/AgCl reference electrode with photocurrent maxima (Imax) of 400 nA cm−2 around 310 nm for 1a and 4000 nA cm−2 around 345 nm for 2a, which correspond to the absorption maxima of the identical thin-film samples spin-coated on the ITO substrate. These positive photocurrents suggest that the electron transfers from the conduction band of the ITO electrode (Ec: −4.5 V) to the hole generated on dyad molecules on the ITO electrode. A possible mechanism of such a positive photocurrent generation is proposed in Fig. 5.40,41 These results suggest that photons absorbed by dyad molecules were converted into electric currents as a result of the charge transfer process between the TTF and fluorene parts because no photocurrent was observed in the cases of thin films of only TTF or only fluorene. The maximum efficiencies of photoelectric conversion (ηmax) were calculated to be 0.38% at 311 nm for 1a, 0.49% at 345 nm for 2a from values of maximum photocurrent per 1 cm2 thin film sample (Imax/A cm−2), absorbance of the thin film used (A), power of irradiated light (W/W cm−2) at wavelength λ nm as summarized in Table 4 from an equation as follows; ηmax = [number of generated photoelectrons (Imax/e)]/[number of absorbed photons [(1 – 10−A)Wλ/hc]] where e is the elementary charge of an electron, h is Planck's constant and c is the velocity of light.40 These results suggest that dyad 2a has a little higher photoelectric conversion ability than dyad 1a because dyad 2a having a π-conjugated ethylene spacer showed much larger quenching of fluorescence and has a better ability to form the photoinduced charge-separated state than 1a having a non-planar σ-bonded thiomethylene spacer. Furthermore, the planar molecular structure of the π-conjugated dyad 2a may be favourable to cause an effective electron transfer process and the resultant generation of photocurrents upon irradiation, compared to the twisted molecular structure of 1a. Fig. 6 shows the bias voltage (vs. Ag/AgCl) dependence of photocurrents of the thin film of 2a spin-coated on the ITO electrode under 345 nm light irradiation. These cathodic (positive) photocurrents increase with increasing negative bias voltage from ca. 0.21% under 0 V to 0.49% under −0.3 V, suggesting that such an application of negative bias voltage raises the energy level of the conduction band of the ITO electrode (Ec) and promotes the electron transfer process from the dyad-modified ITO electrode to the hole generated on dyad molecules. These phenomena also suggest the proposed mechanism in Fig. 5 and are almost the same as the cases of the other TTF-based dyads studied so far.18,20,22
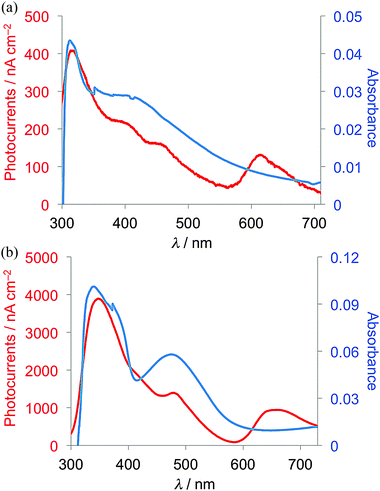 |
| | Fig. 4 Photocurrent action spectra under −0.30 V bias voltage vs. Ag/AgCl reference electrode (red) and absorption spectra of the thin film samples spin-coated on the ITO electrode (blue) of (a) 1a and (b) 2a. | |
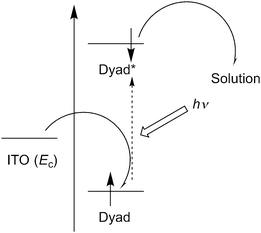 |
| | Fig. 5 A possible mechanism of the positive photocurrent generation of the thin film samples spin-coated on the ITO electrode. | |
Table 4 Estimation of maximum photoelectric conversion efficiency (ηmax) of the thin film samples of dyads
| |
Maximum photocurrent (Imax/nA cm−2) at −0.3 V |
Light power (W/mW cm−2) |
λ (nm) |
Absorbance of the thin film (A) |
η
max (%) |
|
1a
|
400 |
4.4 |
311 |
0.043 |
0.38 |
|
1b
|
260 |
5.2 |
313 |
0.053 |
0.18 |
|
1c
|
550 |
5.2 |
313 |
0.094 |
0.22 |
|
1d
|
250 |
6.3 |
316 |
0.050 |
0.14 |
|
2a
|
4000 |
14.8 |
345 |
0.096 |
0.49 |
|
2b
|
2170 |
13.9 |
348 |
0.077 |
0.34 |
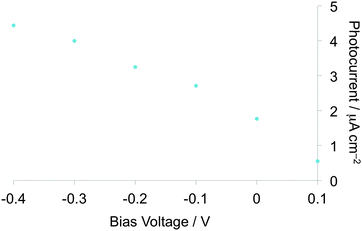 |
| | Fig. 6 Applied bias voltage (vs. Ag/AgCl) dependence of photocurrents of the thin film spin-coated on the ITO electrode for 2a. | |
3.6 Crystal structure of 1d
An X-ray crystal structure analysis of 1d was performed using an orange platelike single crystal recrystallized from CHCl3–n-hexane. This crystal belongs to the monoclinic P21/c space group, and there is one crystallographically independent molecule in the unit cell. Fig. 7 shows the molecular structure of 1d. The TTF part has a boat-form conformation with bent angles of 6.85° and 4.72° at the sulfur positions of the TTF skeleton, whereas the TTF and fluorene moieties have high planarity with maximum differences from their least-square planes (0.063 and 0.021 Å, respectively). On the other hand, TTF and fluorene moieties are arranged almost orthogonally to each other with a dihedral angle of 34.6° as shown in Fig. 7(a) because of the connection through the σ-bonded thiomethylene spacer, suggesting that the intramolecular π–π interaction between the TTF and fluorene parts may be weakened in the crystalline state of 1d. These structural features are quite different from those of the molecular structure of 2b in the 2![[thin space (1/6-em)]](https://www.rsc.org/images/entities/char_2009.gif) :
:![[thin space (1/6-em)]](https://www.rsc.org/images/entities/char_2009.gif) 1 Ag(CN)2 salt, which has the π-bonded ethylene spacer, as discussed later. Fig. 8 shows the crystal structure of 1d. As Fig. 8b indicates, molecule 1d forms a uniform stacking structure in a head-to-head manner along the b-axis, and a one-dimensional uniform intermolecular interaction between each part of the molecule is realized in the segregated stacking along the b-axis, where a short S–S contact that is shorter than the sum of the van der Waals radii (3.70 Å) of sulfur exists between the sulfur atoms of the TTF moieties along the stacking direction [S(6)–S(3): 3.6855(18) Å]. In this crystal, two TTF parts are dimerized along the side-by-side direction with a large overlap integral between the HOMOs located on the TTF part (p = −8.78 × 10⁻³) as shown in Fig. 8a. Furthermore, relatively large overlap integrals between the TTF part (bTTF = 4.37 × 10⁻³) and also between the LUMOs located on the fluorene parts (bfluorene = 2.90 × 10⁻³) were calculated along the b-axis on the basis of the extended Hückel approximation. Due to these relatively large intermolecular interactions, this crystal is expected to show photoinduced conductivities along the b-axis through the intramolecular electron transfer and the resultant charge-separated state upon photoirradiation.
1 Ag(CN)2 salt, which has the π-bonded ethylene spacer, as discussed later. Fig. 8 shows the crystal structure of 1d. As Fig. 8b indicates, molecule 1d forms a uniform stacking structure in a head-to-head manner along the b-axis, and a one-dimensional uniform intermolecular interaction between each part of the molecule is realized in the segregated stacking along the b-axis, where a short S–S contact that is shorter than the sum of the van der Waals radii (3.70 Å) of sulfur exists between the sulfur atoms of the TTF moieties along the stacking direction [S(6)–S(3): 3.6855(18) Å]. In this crystal, two TTF parts are dimerized along the side-by-side direction with a large overlap integral between the HOMOs located on the TTF part (p = −8.78 × 10⁻³) as shown in Fig. 8a. Furthermore, relatively large overlap integrals between the TTF part (bTTF = 4.37 × 10⁻³) and also between the LUMOs located on the fluorene parts (bfluorene = 2.90 × 10⁻³) were calculated along the b-axis on the basis of the extended Hückel approximation. Due to these relatively large intermolecular interactions, this crystal is expected to show photoinduced conductivities along the b-axis through the intramolecular electron transfer and the resultant charge-separated state upon photoirradiation.
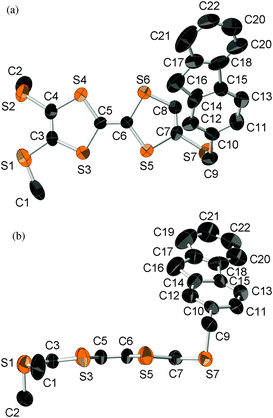 |
| | Fig. 7 ORTEP drawing (ellipsoids at 50% probability level) of the molecular structure of 1d. (a) Top view and (b) side view. The hydrogen atoms are omitted for clarity. | |
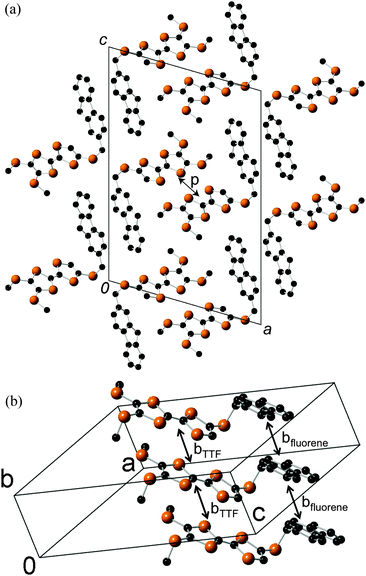 |
| | Fig. 8 (a) Crystal structure of 1d viewed along the ac-plane. (b) Stacking structure and overlap integrals between TTF parts and between fluorene parts along the stacking direction. | |
3.7 Photocurrent measurements on the single crystalline sample of 1d
To investigate the conductivity response toward light irradiation, photoconductivity of the single crystalline sample of 1d was measured by a two-probe method along the b-axis that corresponds to the stacking axis of the TTF parts. Electrical contacts were achieved with two gold wires using gold pastes (length between the terminals: 83 μm), and increases of electric currents under chopped white-light irradiation from a 300 W Xe lamp (ca. 1.5 Hz, 21.8 mW cm−2, 300–600 nm) were measured under an application of 50 V between two terminals. As shown in Fig. 9, sharp changes in electrical currents, that is, photocurrent generation of ca. 15 nA, were induced by chopped light irradiation. These sudden increases and decreases are considered to be driven by transient carriers generated by the photoinduced charge transfers. The photocurrent value of 15 nA corresponds to a conductivity change from 5.2 × 10⁻⁷ S cm−1 under dark to 9.6 × 10⁻⁷ S cm−1 under irradiation (Δσ = 4.4 × 10⁻⁷), indicating conductivity enhancement of ca. 86%. This result suggests that the single crystal of 1d can cause photoconductivities along the stacking direction of the TTF parts by the photoinduced intramolecular electron transfer and the resultant charge-separated state, even though such a photocurrent value is not so remarkable probably due to weakness of intermolecular interaction along the stacking direction.
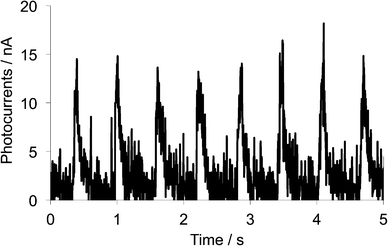 |
| | Fig. 9 Photocurrent changes upon chopped white light irradiation (ca. 1.5 Hz, 300–600 nm) onto the single crystal of 1d measured along the b-axis. | |
3.8 Preparation, crystal structure and band structure of the Ag(CN)2 and Au(CN)2 salts of 2b
Platelike purple crystals of the Ag(CN)2 and Au(CN)2 salts of 2b were prepared by galvanostatic oxidation in the mixture of dry chlorobenzene and dry ethanol (v/v = 1![[thin space (1/6-em)]](https://www.rsc.org/images/entities/char_2009.gif) :
:![[thin space (1/6-em)]](https://www.rsc.org/images/entities/char_2009.gif) 9) using the corresponding tetra-n-butylammonium salts of these counteranions as supporting electrolytes at 16 °C under a nitrogen atmosphere. X-Ray crystal structure analyses were performed for these Ag(CN)2 and Au(CN)2 salts. These salts have a 2
9) using the corresponding tetra-n-butylammonium salts of these counteranions as supporting electrolytes at 16 °C under a nitrogen atmosphere. X-Ray crystal structure analyses were performed for these Ag(CN)2 and Au(CN)2 salts. These salts have a 2![[thin space (1/6-em)]](https://www.rsc.org/images/entities/char_2009.gif) :
:![[thin space (1/6-em)]](https://www.rsc.org/images/entities/char_2009.gif) 1 composition of dyad
1 composition of dyad![[thin space (1/6-em)]](https://www.rsc.org/images/entities/char_2009.gif) :
:![[thin space (1/6-em)]](https://www.rsc.org/images/entities/char_2009.gif) anion and are completely isomorphous to each other. The ORTEP drawings of molecular structure and the crystal structures of the Ag(CN)2 salt are shown in Fig. 10 and 11, respectively. This crystal belongs to the monoclinic P21/c space group, and there are crystallographically independent one dyad molecule and a half of a Ag(CN)2 anion in the unit cell, where silver atom locates on the inversion center. The TTF and fluorene moieties have high planarity with maximum differences from their least-square planes (0.032 and 0.055 Å, respectively). On the other hand, the molecule has a little twisted structure with a torsional angle between TTF and fluorene moieties of 19.3°. These results suggest that molecule 2b containing a π-bonded ethylene spacer in this cation radical salt has higher planarity than the neutral molecule 1d having a σ-bonded thiomethylene spacer. As Fig. 11 indicates, each TTF and fluorene moieties of 2b form segregated stacking structures along the a-axis and the Ag(CN)2 anions are surrounded by the fluorene moieties. There are many S–S contacts shorter than the sum of the van der Waals radii of sulfur (3.7 Å) along the a-axis (a: S3–S2 = 3.75 Å, S5–S4 = 3.76 Å) and the side-by-side direction (p: S2–S6 = 3.62 Å, S6–S2 = 3.62 Å, q: S2–S6 = 3.64 Å, S6–S2 = 3.64 Å) between the TTF parts as shown in Fig. 12. The overlap integrals between the HOMOs of TTF moieties (a, p, q) were calculated on the basis of the extended Hückel approximation. Relatively large overlap integrals along the stacking a-axis (a: 5.81 × 10⁻³) and large side-by-side overlap integrals (p: 19.8 × 10⁻³ and q: −6.63 × 10⁻³) were obtained. On the other hand, an overlap integral along the a-axis between the LUMOs of the fluorene moieties is quite small (aFluorene = 0.14 × 10⁻³). These results indicate that a uniform interaction between the TTF parts exists along the stacking a-axis and two adjacent TTF parts form a side-by-side dimerized structure (p). Due to these relatively large intermolecular interactions between the TTF, this crystal is expected to show good conductivity in the ground state and photoconductivity along the a-axis upon photoirradiation.
anion and are completely isomorphous to each other. The ORTEP drawings of molecular structure and the crystal structures of the Ag(CN)2 salt are shown in Fig. 10 and 11, respectively. This crystal belongs to the monoclinic P21/c space group, and there are crystallographically independent one dyad molecule and a half of a Ag(CN)2 anion in the unit cell, where silver atom locates on the inversion center. The TTF and fluorene moieties have high planarity with maximum differences from their least-square planes (0.032 and 0.055 Å, respectively). On the other hand, the molecule has a little twisted structure with a torsional angle between TTF and fluorene moieties of 19.3°. These results suggest that molecule 2b containing a π-bonded ethylene spacer in this cation radical salt has higher planarity than the neutral molecule 1d having a σ-bonded thiomethylene spacer. As Fig. 11 indicates, each TTF and fluorene moieties of 2b form segregated stacking structures along the a-axis and the Ag(CN)2 anions are surrounded by the fluorene moieties. There are many S–S contacts shorter than the sum of the van der Waals radii of sulfur (3.7 Å) along the a-axis (a: S3–S2 = 3.75 Å, S5–S4 = 3.76 Å) and the side-by-side direction (p: S2–S6 = 3.62 Å, S6–S2 = 3.62 Å, q: S2–S6 = 3.64 Å, S6–S2 = 3.64 Å) between the TTF parts as shown in Fig. 12. The overlap integrals between the HOMOs of TTF moieties (a, p, q) were calculated on the basis of the extended Hückel approximation. Relatively large overlap integrals along the stacking a-axis (a: 5.81 × 10⁻³) and large side-by-side overlap integrals (p: 19.8 × 10⁻³ and q: −6.63 × 10⁻³) were obtained. On the other hand, an overlap integral along the a-axis between the LUMOs of the fluorene moieties is quite small (aFluorene = 0.14 × 10⁻³). These results indicate that a uniform interaction between the TTF parts exists along the stacking a-axis and two adjacent TTF parts form a side-by-side dimerized structure (p). Due to these relatively large intermolecular interactions between the TTF, this crystal is expected to show good conductivity in the ground state and photoconductivity along the a-axis upon photoirradiation.
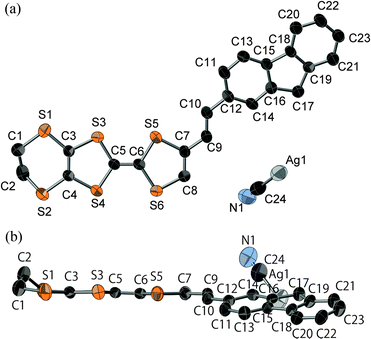 |
| | Fig. 10 ORTEP drawings (ellipsoids at 50% probability level) of the molecular structure in the crystal of 2b2Ag(CN)2. (a) Top view and (b) side view. The hydrogen atoms are omitted for clarity. | |
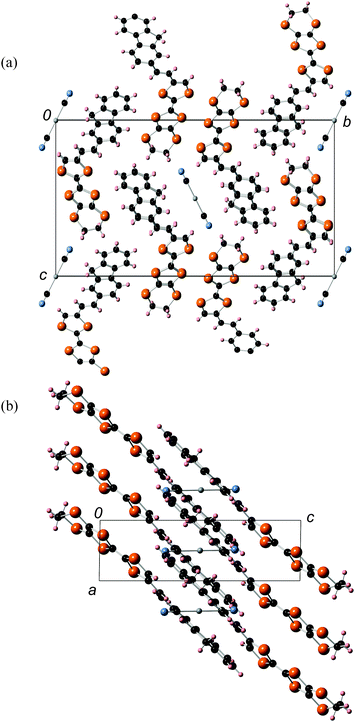 |
| | Fig. 11 Crystal structures of 2b2Ag(CN)2 (a) viewed along the bc-plane and (b) viewed along the ac-plane. | |
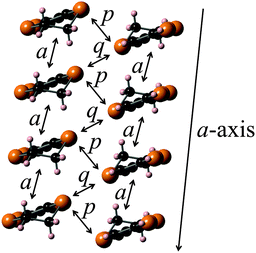 |
| | Fig. 12 Stacking structure and overlap integrals between the TTF moieties calculated on the basis of the extended Hückel approximation (a: 5.81, p: 19.8, q: −6.63 (×10−3)). | |
The energy band structure and Fermi surface of 2b2Ag(CN)2 were calculated by a tight-binding method using the calculated overlap integrals (a, p, q) on the TTF stacking layer (the ab-plane) as shown in Fig. 13. A strong side-by-side dimerization causes a band dispersion to split into two bands with a relatively large energy gap between the upper and lower bands (−0.15 eV). Due to such a band splitting, the upper band with a band width of 0.38 eV has an effective 1/2 filling of the band structure, suggesting a Mott-type insulating electronic structure of this salt. The Fermi surface of the present salt is completely one-dimensional and open along the kb-direction because of its one-dimensional stacking structure of the strongly dimerized molecules.
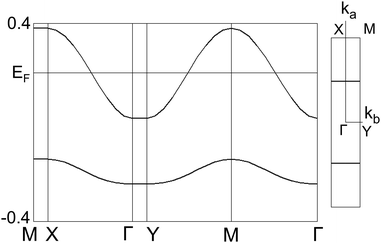 |
| | Fig. 13 Energy band structure and Fermi surface of 2b2Ag(CN)2. | |
3.9 Temperature dependence of resistivities and magnetic susceptibilities of 2b2Ag(CN)2
Temperature dependence of electrical resistivities of the single crystalline sample of 2b2Ag(CN)2 was measured using a four-probe method along the a-axis as shown in Fig. 14. Room temperature conductivity of this sample is 0.088 S cm−1. Below room temperature, resistivities showed semiconducting behaviour, and an anomaly of the slope of resistivities was observed around 185 K, where activation energy (Ea) changed from 0.35 eV above 185 K to 0.14 eV below 185 K. Such a semiconducting behaviour may be due to the half-filled Mott insulating band structure of this crystal as discussed above. Although a sudden resistivity jump was also observed at 137 K, the slope of the Arrhenius plot showed no anomaly at the same temperature, suggesting the possibility of some cracks in the crystal.
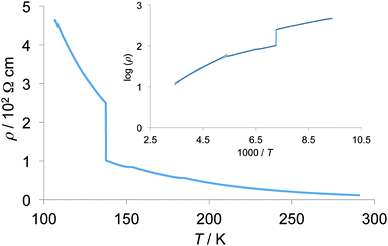 |
| | Fig. 14 Temperature dependence of electrical resistivity of 2b2Ag(CN)2. The inset shows its Arrhenius plot. | |
Temperature dependence of magnetic susceptibilities of the polycrystalline samples of the 2b2Ag(CN)2 salt was measured using a SQUID magnetometer down to 1.9 K at 10 kOe. The susceptibility at room temperature (χrt) was 8.7 × 10⁻⁴ emu mol−1 after correction of diamagnetic contribution, and is much higher than that of normal metallic materials (3–5 × 10⁻⁴ emu mol−1) and is rather close to the susceptibility of completely localized S = 1/2 π-spin systems (χrt = 1.25 × 10⁻³ emu mol−1), suggesting the localization nature of the π-spins on the TTF part of this complex. Below room temperature, magnetic susceptibilities slightly decreased with decreasing temperature as shown in Fig. 15, indicating a weak antiferromagnetic interaction among the π-spins on the TTF part as the monotonic decrease of χT values suggests in the inset of Fig. 15. Although resistivity anomalies were observed around 185 K and 137 K as mentioned above, no distinguished anomaly was detected in the temperature range of 100–200 K in the magnetic susceptibility measurement. Because the susceptibilities showed a gradual increase in the low temperature region below ca. 80 K even after the correction of Curie impurities (S = 1/2, 2.0%), such an increase may be derived from some spin localization nature at low temperature.
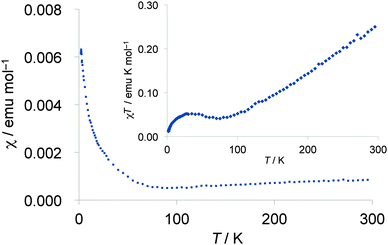 |
| | Fig. 15 Temperature dependence of paramagnetic susceptibilities (χ) of the polycrystalline samples of the 2b2Ag(CN)2 salt after the correction of Curie impurities (S = 1/2, 2.0%). Inset shows temperature dependence of χT values. | |
3.10 Photocurrent measurements on the single crystalline sample of 2b2Ag(CN)2
Photoconductivity of the single crystal of 2b2Ag(CN)2 was also measured by a two-probe method (length between the terminals: 166 μm) along the a-axis under a chopped white-light irradiation from a 300 W Xe lamp (ca. 1.5 Hz, 16.9 mW cm−2, 300–600 nm) under an application of 5 V between two terminals. Because this salt showed semiconducting behaviour even in the ground state, an electric current of 34 μA under dark was observed. Upon chopped light irradiation, sharp changes in electrical currents of ca. 2.1 μA at 5 V were observed as shown in Fig. 16, suggesting that the photoconductivity value of the 2b2Ag(CN)2 salt is much larger than that of the neutral crystal of 1d (ca. 15 nA under 50 V). The value corresponds to the conductivity change from 2.7 × 10⁻² S cm−1 to 2.9 × 10⁻² S cm−1 (Δσ = 2 × 10⁻³ S cm−1), suggesting that the conductivity of this cation radical Ag(CN)2 salt can also be enhanced by ca. 14% upon irradiation.
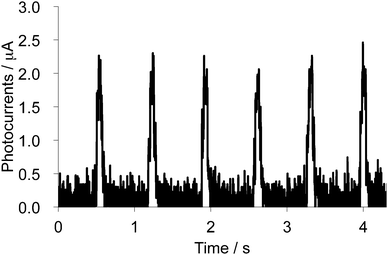 |
| | Fig. 16 Photocurrent changes upon chopped white light irradiation (300–600 nm) onto the single crystal of 2b2Ag(CN)2 measured along the a-axis. | |
4. Conclusion
We have synthesized new D–A type TTF–fluorene dyads with a σ-bonded thiomethylene spacer 1a–d and a π-conjugated ethylene spacer 2a–b for the development of photoresponsive organic conducting materials. The photoelectrochemical measurements on the spin-coated thin films of these dyads suggest that positive photocurrents can be generated by the intramolecular electron transfer between the TTF and fluorene parts and the dyad 2a containing the π-conjugated ethylene spacer gave higher photoelectric conversion efficiency. The cation radical salt, 2b2Ag(CN)2, showed semiconducting behaviour with a half-filled Mott insulating electronic structure. We observed photocurrent generation for the single crystalline sample of 1b and the single crystalline sample of the 2b2Ag(CN)2 salt. Observed photoconductivity of the 2b2Ag(CN)2 salt was much larger than that of the neutral crystal of 1d. These results suggest that the TTF-based D–A dyads such as the TTF–fluorene dyads studied in this paper can be regarded as candidates for optoelectronic materials such as photoelectric conversion materials and photoconducting applications.
Acknowledgements
This work was financially supported in part by Grants-in-Aid for Scientific Research (No. 20110006 and No. 21750150) from the Ministry of Education, Culture, Sports, Science and Technology of Japan, and by Grant for Young Researcher from JGC-S Scholarship Foundation.
Notes and references
- H. Kobayashi, H. B. Cui and A. Kobayashi, Chem. Rev., 2004, 104, 5265–5288 CrossRef CAS PubMed.
- E. Coronado and P. Day, Chem. Rev., 2004, 104, 5419–5448 CrossRef CAS PubMed.
- T. Mori, J. Phys.: Condens. Matter, 2008, 20, 180410 CrossRef.
- F. Sawano, I. Terasaki, H. Mori, T. Mori, M. Watanabe, N. Ikeda, Y. Nogami and Y. Noda, Nature, 2005, 437, 522–524 CrossRef CAS PubMed.
- F. O. Karutz, J. U. von Schutz, H. Wachtel and H. C. Wolf, Phys. Rev. Lett., 1998, 81, 140–143 CrossRef CAS.
- M. Chollet, L. Guerin, N. Uchida, S. Fukaya, H. Shimoda, T. Ishikawa, K. Matsuda, T. Hasegawa, A. Ota, H. Yamochi, G. Saito, R. Tazaki, S. Adachi and S. Koshihara, Science, 2005, 307, 86–89 CrossRef CAS PubMed.
- M. R. Bryce, Adv. Mater., 1999, 11, 11–23 CrossRef CAS.
- J. L. Segura and N. Martin, Angew. Chem., Int. Ed., 2001, 40, 1372–1409 CrossRef CAS.
- A. Gorgues, P. Hudhomme and M. Salle, Chem. Rev., 2004, 104, 5151–5184 CrossRef CAS PubMed.
- M. Bendikov, F. Wudl and D. F. Perepichka, Chem. Rev., 2004, 104, 4891–4945 CrossRef CAS PubMed.
- S. Wenger, P.-A. Bouit, Q. Chen, J. l. Teuscher, D. D. Censo, R. Humphry-Baker, J.-E. Moser, J. L. Delgado, N. Martín, S. M. Zakeeruddin and M. Gratzel, J. Am. Chem. Soc., 2010, 132, 5164–5169 CrossRef CAS PubMed.
- F. G. Brunetti, J. L. Lopez, C. Atienza and N. Martin, J. Mater. Chem., 2012, 22, 4188–4205 RSC.
- D. Canevet, M. Salle, G. X. Zhang, D. Q. Zhang and D. B. Zhu, Chem. Commun., 2009, 2245–2269 RSC.
- G. X. Zhang, D. Q. Zhang, X. F. Guo and D. B. Zhu, Org. Lett., 2004, 6, 1209–1212 CrossRef CAS PubMed.
- H. Nishikawa, S. Kojima, T. Kodama, I. Ikemoto, S. Suzuki, K. Kikuchi, M. Fujitsuka, H. X. Luo, Y. Araki and O. Ito, J. Phys. Chem. A, 2004, 108, 1881–1890 CrossRef CAS.
- L. Sanchez, I. Perez, N. Martin and D. M. Guldi, Chem.–Eur. J., 2003, 9, 2457–2468 CrossRef CAS PubMed.
- F. Giacalone, J. L. Segura, N. Martin, J. Ramey and D. M. Guldi, Chem.–Eur. J., 2005, 11, 4819–4834 CrossRef CAS PubMed.
- H. Fujiwara, Y. Sugishima and K. Tsujimoto, Tetrahedron Lett., 2008, 49, 7200–7203 CrossRef CAS.
- K. Furukawa, Y. Sugishima, H. Fujiwara and T. Nakamura, Chem. Lett., 2011, 292–294 CrossRef CAS.
- H. Fujiwara, S. Yokota, S. Hayashi, S. Takemoto and H. Matsuzaka, Physica B, 2010, 405, S15–S18 CrossRef CAS.
- S. Yokota, K. Tsujimoto, S. Hayashi, F. Pointillart, L. Ouahab and H. Fujiwara, Inorg. Chem., 2013, 52, 6543–6550 CrossRef CAS PubMed.
- K. Tsujimoto, R. Ogasawara and H. Fujiwara, Tetrahedron Lett., 2013, 54, 1251–1255 CrossRef CAS.
- R. H. Friend, R. W. Gymer, A. B. Holmes, J. H. Burroughes, R. N. Marks, C. Taliani, D. D. C. Bradley, D. A. Dos Santos, J. L. Bredas, M. Logdlund and W. R. Salaneck, Nature, 1999, 397, 121–128 CrossRef CAS.
- U. Scherf and E. J. W. List, Adv. Mater., 2002, 14, 477–487 CrossRef CAS.
- L. Zhang, M. J. Li, C. Y. Wang, G. Q. Lai and Y. J. Shen, Polym. Bull, 2013, 70, 353–369 CrossRef CAS.
- N. A. D. Yamamoto, L. L. Lavery, B. F. Nowacki, I. R. Grova, G. L. Whiting, B. Krusor, E. R. de Azevedo, L. Akcelrud, A. C. Arias and L. S. Roman, J. Phys. Chem. C, 2012, 116, 18641–18648 CAS.
- S. Amriou, C. S. Wang, A. S. Batsanov, M. R. Bryce, D. F. Perepichka, E. Orti, R. Viruela, J. Vidal-Gancedo and C. Rovira, Chem.–Eur. J., 2006, 12, 3389–3400 CrossRef CAS PubMed.
- D. F. Perepichka, M. R. Bryce, I. F. Perepichka, S. B. Lyubchik, C. A. Christensen, N. Godbert, A. S. Batsanov, E. Levillain, E. J. L. McInnes and J. P. Zhao, J. Am. Chem. Soc., 2002, 124, 14227–14238 CrossRef CAS PubMed.
- S. Drouet, C. O. Paul-Roth and G. Simonneaux, Tetrahedron, 2009, 65, 2975–2981 CrossRef CAS.
- C. O. Paul-Roth, J. A. G. Williams, J. Letessier and G. Simonneaux, Tetrahedron Lett., 2007, 48, 4317–4322 CrossRef CAS.
- H. Fujiwara, K. Tsujimoto, Y. Sugishima, S. Takemoto and H. Matsuzaka, Physica B, 2010, 405, S12–S14 CrossRef CAS.
- C. Y. Jia, D. Q. Zhang, W. Xu and D. B. Zhu, Org. Lett., 2001, 3, 1941–1944 CrossRef CAS PubMed.
- J. Garin, J. Orduna, S. Uriel, A. J. Moore, M. R. Bryce, S. Wegener, D. S. Yufit and J. A. K. Howard, Synthesis-Stuttgart, 1994, 489–493 CrossRef CAS.
- A. Altomare, G. Cascarano, C. Giacovazzo and A. Guagliardi, J. Appl. Crystallogr., 1993, 26, 343–350 CrossRef.
-
P. T. Beurskens, G. Admiraal, G. Beurskens, W. P. Bosman, D. de Gelder, R. Israel and J. M. M. Smith, Technical Report of the Crystallography Laboratory, University of Nijmegen, Nijmegen, The Netherlands, 1994 Search PubMed.
-
CrystalStructure Analysis Package, Molecular Structure Corp., Houston, TX, 1992 Search PubMed.
-
E. König, Landolt Bornstein, Group II: Atomic and Molecular Physics, Magnetic Properties of Coordination and Organometallic Transition Metal Compounds, Spring Verlag, Berlin, 1966, vol. 2 Search PubMed.
- D. Rehm and A. Weller, Isr. J. Chem., 1970, 8, 259 CrossRef CAS.
-
M. J. Frisch, G. W. Trucks, H. B. Schlegel, G. E. Scuseria, M. A. Robb, J. R. Cheeseman, G. Scalmani, V. Barone, B. Mennucci, G. A. Petersson, H. Nakatsuji, M. Caricato, X. Li, H. P. Hratchian, A. F. Izmaylov, J. Bloino, G. Zheng, J. L. Sonnenberg, M. Hada, M. Ehara, K. Toyota, R. Fukuda, J. Hasegawa, M. Ishida, T. Nakajima, Y. Honda, O. Kitao, H. Nakai, T. Vreven, J. A. Montgomery Jr., J. E. Peralta, F. Ogliaro, M. Bearpark, J. J. Heyd, E. Brothers, K. N. Kudin, V. N. Staroverov, R. Kobayashi, J. Normand, K. Raghavachari, A. Rendell, J. C. Burant, S. S. Iyengar, J. Tomasi, M. Cossi, N. Rega, J. M. Millam, M. Klene, J. E. Knox, J. B. Cross, V. Bakken, C. Adamo, J. Jaramillo, R. Gomperts, R. E. Stratmann, O. Yazyev, A. J. Austin, R. Cammi, C. Pomelli, J. W. Ochterski, R. L. Martin, K. Morokuma, V. G. Zakrzewski, G. A. Voth, P. Salvador, J. J. Dannenberg, S. Dapprich, A. D. Daniels, Ö. Farkas, J. B. Foresman, J. V. Ortiz, J. Cioslowski and D. J. Fox, Gaussian 09, Revision B.1, Gaussian, Inc., Wallingford, CT, 2010 Search PubMed.
- J. Zhai, T. X. Wei, C. H. Huang and H. Cao, J. Mater. Chem., 2000, 10, 625–630 RSC.
- F. Y. Li, L. P. Jin, Y. Y. Huang, C. H. Huang, J. Zheng and J. Q. Guo, J. Mater. Chem., 2001, 11, 1783–1788 RSC.
Footnote |
| † Electronic supplementary information (ESI) available: NMR charts of dyads 1a–d, 2a–b, and UV-Vis simulated spectra of 1a and 2a calculated on the basis of the TD-DFT method. CCDC 953471–953473. For ESI and crystallographic data in CIF or other electronic format see DOI: 10.1039/c3nj00979c |
|
| This journal is © The Royal Society of Chemistry and the Centre National de la Recherche Scientifique 2014 |
Click here to see how this site uses Cookies. View our privacy policy here. ![[thin space (1/6-em)]](https://www.rsc.org/images/entities/char_2009.gif) :
:![[thin space (1/6-em)]](https://www.rsc.org/images/entities/char_2009.gif) 9) at 16 °C for two weeks.
9) at 16 °C for two weeks.
![[thin space (1/6-em)]](https://www.rsc.org/images/entities/char_2009.gif) 165
165![[thin space (1/6-em)]](https://www.rsc.org/images/entities/char_2009.gif) 816
816![[thin space (1/6-em)]](https://www.rsc.org/images/entities/char_2009.gif) 926
926


![[thin space (1/6-em)]](https://www.rsc.org/images/entities/char_2009.gif) :
:![[thin space (1/6-em)]](https://www.rsc.org/images/entities/char_2009.gif) 1 Ag(CN)2 salt, which has the π-bonded ethylene spacer, as discussed later. Fig. 8 shows the crystal structure of 1d. As Fig. 8b indicates, molecule 1d forms a uniform stacking structure in a head-to-head manner along the b-axis, and a one-dimensional uniform intermolecular interaction between each part of the molecule is realized in the segregated stacking along the b-axis, where a short S–S contact that is shorter than the sum of the van der Waals radii (3.70 Å) of sulfur exists between the sulfur atoms of the TTF moieties along the stacking direction [S(6)–S(3): 3.6855(18) Å]. In this crystal, two TTF parts are dimerized along the side-by-side direction with a large overlap integral between the HOMOs located on the TTF part (p = −8.78 × 10⁻³) as shown in Fig. 8a. Furthermore, relatively large overlap integrals between the TTF part (bTTF = 4.37 × 10⁻³) and also between the LUMOs located on the fluorene parts (bfluorene = 2.90 × 10⁻³) were calculated along the b-axis on the basis of the extended Hückel approximation. Due to these relatively large intermolecular interactions, this crystal is expected to show photoinduced conductivities along the b-axis through the intramolecular electron transfer and the resultant charge-separated state upon photoirradiation.
1 Ag(CN)2 salt, which has the π-bonded ethylene spacer, as discussed later. Fig. 8 shows the crystal structure of 1d. As Fig. 8b indicates, molecule 1d forms a uniform stacking structure in a head-to-head manner along the b-axis, and a one-dimensional uniform intermolecular interaction between each part of the molecule is realized in the segregated stacking along the b-axis, where a short S–S contact that is shorter than the sum of the van der Waals radii (3.70 Å) of sulfur exists between the sulfur atoms of the TTF moieties along the stacking direction [S(6)–S(3): 3.6855(18) Å]. In this crystal, two TTF parts are dimerized along the side-by-side direction with a large overlap integral between the HOMOs located on the TTF part (p = −8.78 × 10⁻³) as shown in Fig. 8a. Furthermore, relatively large overlap integrals between the TTF part (bTTF = 4.37 × 10⁻³) and also between the LUMOs located on the fluorene parts (bfluorene = 2.90 × 10⁻³) were calculated along the b-axis on the basis of the extended Hückel approximation. Due to these relatively large intermolecular interactions, this crystal is expected to show photoinduced conductivities along the b-axis through the intramolecular electron transfer and the resultant charge-separated state upon photoirradiation.


![[thin space (1/6-em)]](https://www.rsc.org/images/entities/char_2009.gif) :
:![[thin space (1/6-em)]](https://www.rsc.org/images/entities/char_2009.gif) 9) using the corresponding tetra-n-butylammonium salts of these counteranions as supporting electrolytes at 16 °C under a nitrogen atmosphere. X-Ray crystal structure analyses were performed for these Ag(CN)2 and Au(CN)2 salts. These salts have a 2
9) using the corresponding tetra-n-butylammonium salts of these counteranions as supporting electrolytes at 16 °C under a nitrogen atmosphere. X-Ray crystal structure analyses were performed for these Ag(CN)2 and Au(CN)2 salts. These salts have a 2![[thin space (1/6-em)]](https://www.rsc.org/images/entities/char_2009.gif) :
:![[thin space (1/6-em)]](https://www.rsc.org/images/entities/char_2009.gif) 1 composition of dyad
1 composition of dyad![[thin space (1/6-em)]](https://www.rsc.org/images/entities/char_2009.gif) :
:![[thin space (1/6-em)]](https://www.rsc.org/images/entities/char_2009.gif) anion and are completely isomorphous to each other. The ORTEP drawings of molecular structure and the crystal structures of the Ag(CN)2 salt are shown in Fig. 10 and 11, respectively. This crystal belongs to the monoclinic P21/c space group, and there are crystallographically independent one dyad molecule and a half of a Ag(CN)2 anion in the unit cell, where silver atom locates on the inversion center. The TTF and fluorene moieties have high planarity with maximum differences from their least-square planes (0.032 and 0.055 Å, respectively). On the other hand, the molecule has a little twisted structure with a torsional angle between TTF and fluorene moieties of 19.3°. These results suggest that molecule 2b containing a π-bonded ethylene spacer in this cation radical salt has higher planarity than the neutral molecule 1d having a σ-bonded thiomethylene spacer. As Fig. 11 indicates, each TTF and fluorene moieties of 2b form segregated stacking structures along the a-axis and the Ag(CN)2 anions are surrounded by the fluorene moieties. There are many S–S contacts shorter than the sum of the van der Waals radii of sulfur (3.7 Å) along the a-axis (a: S3–S2 = 3.75 Å, S5–S4 = 3.76 Å) and the side-by-side direction (p: S2–S6 = 3.62 Å, S6–S2 = 3.62 Å, q: S2–S6 = 3.64 Å, S6–S2 = 3.64 Å) between the TTF parts as shown in Fig. 12. The overlap integrals between the HOMOs of TTF moieties (a, p, q) were calculated on the basis of the extended Hückel approximation. Relatively large overlap integrals along the stacking a-axis (a: 5.81 × 10⁻³) and large side-by-side overlap integrals (p: 19.8 × 10⁻³ and q: −6.63 × 10⁻³) were obtained. On the other hand, an overlap integral along the a-axis between the LUMOs of the fluorene moieties is quite small (aFluorene = 0.14 × 10⁻³). These results indicate that a uniform interaction between the TTF parts exists along the stacking a-axis and two adjacent TTF parts form a side-by-side dimerized structure (p). Due to these relatively large intermolecular interactions between the TTF, this crystal is expected to show good conductivity in the ground state and photoconductivity along the a-axis upon photoirradiation.
anion and are completely isomorphous to each other. The ORTEP drawings of molecular structure and the crystal structures of the Ag(CN)2 salt are shown in Fig. 10 and 11, respectively. This crystal belongs to the monoclinic P21/c space group, and there are crystallographically independent one dyad molecule and a half of a Ag(CN)2 anion in the unit cell, where silver atom locates on the inversion center. The TTF and fluorene moieties have high planarity with maximum differences from their least-square planes (0.032 and 0.055 Å, respectively). On the other hand, the molecule has a little twisted structure with a torsional angle between TTF and fluorene moieties of 19.3°. These results suggest that molecule 2b containing a π-bonded ethylene spacer in this cation radical salt has higher planarity than the neutral molecule 1d having a σ-bonded thiomethylene spacer. As Fig. 11 indicates, each TTF and fluorene moieties of 2b form segregated stacking structures along the a-axis and the Ag(CN)2 anions are surrounded by the fluorene moieties. There are many S–S contacts shorter than the sum of the van der Waals radii of sulfur (3.7 Å) along the a-axis (a: S3–S2 = 3.75 Å, S5–S4 = 3.76 Å) and the side-by-side direction (p: S2–S6 = 3.62 Å, S6–S2 = 3.62 Å, q: S2–S6 = 3.64 Å, S6–S2 = 3.64 Å) between the TTF parts as shown in Fig. 12. The overlap integrals between the HOMOs of TTF moieties (a, p, q) were calculated on the basis of the extended Hückel approximation. Relatively large overlap integrals along the stacking a-axis (a: 5.81 × 10⁻³) and large side-by-side overlap integrals (p: 19.8 × 10⁻³ and q: −6.63 × 10⁻³) were obtained. On the other hand, an overlap integral along the a-axis between the LUMOs of the fluorene moieties is quite small (aFluorene = 0.14 × 10⁻³). These results indicate that a uniform interaction between the TTF parts exists along the stacking a-axis and two adjacent TTF parts form a side-by-side dimerized structure (p). Due to these relatively large intermolecular interactions between the TTF, this crystal is expected to show good conductivity in the ground state and photoconductivity along the a-axis upon photoirradiation.


